dOi: 10.1556/168.2018.19.1.5
Introduction
The niche differentiation hypothesis with respect to re- sources is a well-appreciated theory of species coexistence (Hutchinson 1959, Walter 1991). The hypothesis states that stable species coexistence entails different resource-use strat- egies among species, otherwise, competitively inferior spe- cies will eventually go extinct. One logical expectation from this hypothesis is that the spatial distribution of most species in a heterogeneous environment will significantly correlate with at least one environmental variable (e.g., edaphic nutri- ents) (Hubbell and Foster 1983). This expectation has been examined extensively and is adequately supported by vari- ous studies on tropical, subtropical, and temporal forest com- munities (Gunatilleke et al. 2006, John et al. 2007, Lai et al.
2009, Zhang et al. 2011, Zhang et al. 2012a), leading numer- ous ecologists to conclude that niche differentiation with re- spect to resources is a dominant mechanism of species coex- istence, particularly for sessile organisms such as tree species in forest communities (Comita et al. 2007).
The widespread evidence of species-habitat association is necessary but not sufficient for justifying the importance of the niche differentiation hypothesis in species coexistence
(Itoh et al. 2003, Noguchi et al. 2007). Significant species- habitat associations only suggest that habitats might have a detectable effect on the spatial distribution of species. These associations do not explain whether species differ in habitat preferences, which is theoretically essential for species coex- istence in the niche differentiation hypothesis. In an extreme case, the spatial distribution of all species in a community can correlate simultaneously with the same single environmental variable without any niche differentiation with respect to the resources among them.
In natural forest communities, several possible ecologi- cal processes exist, apart from niche differentiation, and such processes may contribute to or result in an observed species- habitat association. These include historical patterns of dis- persal, colonization, or previous physical conditions; the in- fluence of competitors or other biological enemies; and habi- tat-related competitive superiority (Pickett and Bazzaz 1978, Goldberg 1985, Wesser and Armbruster 1991, Thomson et al.
1996, Harms et al. 2001). For example, a population’s history of seed dispersal and immigration may lead to an ephemeral or transient match between the current population distribu- tion and the habitat (Primack and Miao 1992, Losos 1995).
Source-sink population dynamics, in which recruitment sub-
The prevalence of species-habitat association is not adequate for justifying the niche differentiation hypothesis
G. Shen
1,2,3,4, S. Tan
2, Q. Yang
1,2, X. Y. Sun
1,2, X. W. Sun
1,2and X. Wang
1,2,3,41Tiantong National Station for Forest Ecosystem Research, Zhejiang, Ningbo, 315114, China
2School of Ecological and Environmental Sciences, East China Normal University, Shanghai 200241, China
3Shanghai Institute of Pollution Control and Ecological Security, 1515 North Zhongshan Rd. (No.2), Shanghai 200092, China
4Corresponding authors: Xihua Wang (xhwang@des.ecnu.edu.cn); Guochun Shen (gcshen@des.ecnu.edu.cn)
Keywords: Cross-validation, Habitat complexity, Habitat preference, Species diversity, Tiantong plot.
Abstract: The hypothesis of niche differentiation with respect to resources is considered to be one of the most influential explanations for the maintenance of species diversity. The hypothesis has been examined extensively by testing its prediction of species-habitat association, which posits that the spatial distribution of species is highly correlated with environmental vari- ables. However, we argue that widespread evidence of the species-habitat association lacks adequate rigor to justify the niche differentiation hypothesis. In this study, we tested whether and to what extent the observed species-habitat association could be caused by ecological processes other than niche differentiation, in a 20-ha subtropical forest plot. The niche differentiation hypothesis was evaluated by testing the species-habitat association and performing a cross-evaluation of the habitat-diversity expectation, which posits that a strong positive correlation exists between species diversity and habitat complexity. Failure to support the habitat-diversity expectation would at a minimum indicate that the niche differentiation hypothesis might not be the main underlying process of species distribution, despite prevalence of the species-habitat association in the same plot. Our analysis revealed that distributions of most species (86.11%) in the plot were significantly associated with at least one of eight topographical and soil nutrient variables. However, there was almost no significant positive correlation between species diver- sity and habitat complexity at various spatial scales in the same plot. The results indicate that additional caution is warranted when interpreting the species-habitat association from the niche differentiation perspective. A significant species-habitat asso- ciation indicates only a species’ habitat preference. The association may reveal nothing about interspecific differences in habitat preference, which is a requirement of the niche differentiation hypothesis.
sidies from favorable habitats maintain sink subpopulations in less favorable habitats, could result in a long persistent spe- cies-habitat association (Pulliam 1988). Therefore, observed species-habitat associations might not or only partially result from niche differentiation among species.
To rigorously test the relevance of the niche differen- tiation hypothesis on species coexistence, other analyses in addition to the species-habitat association test are required.
One typical solution is to test whether significant interspe- cific differences in habitat preferences exist among species with a significant species-habitat association (Itoh et al. 2003, Noguchi et al. 2007). However, this solution is not sufficient to completely evaluate the importance of the niche differen- tiation hypothesis on species coexistence because “signifi- cance” here only means that the observed interspecific differ- ences are statistically different from null communities with random habitat preference differences (e.g., communities generated by random torus translation null model in Harms et al. (2001)). Whether these significant differences are large enough to promote species coexistence (e.g., the limiting similarity hypothesis) and the strength of the effect of these differences on species coexistence are not clearly understood.
Thus, the question as to whether niche differentiation is the main underlying process of the observed species-habitat as- sociation remains unanswered.
A second possible solution is to directly test the effects of niche differentiation on community structures. If niche differ- entiation is a dominant process in the species-habitat associa- tion, species diversity will increase with habitat complexity.
Highly complex environments usually offer a wider variety of suitable habitats than do structurally simple environments, and thus enable more habitat-specialized species to coexist (Whittaker and Fernandez Palacios 2007). If a positive as- sociation between species diversity and habitat complexity cannot be observed, at least the effect of niche differentia- tion might be weaker than other possible ecological processes (e.g., dispersal and source-sink population dynamics), and the observed species-habitat association could be mainly attribut- able to processes other than niche differentiation among spe- cies. This expected species diversity and habitat complexity association has been used in numerous studies to examine the relevance of the niche differentiation hypothesis (Hamilton et al. 1963, Johnson and Simberloff 1974, Potts et al. 2004, Stein et al. 2014).
The objective of the current study was to determine whether (and to what extent) niche differentiation and oth- er alternative ecological processes can induce the observed species-habitat association. A cross-validation method based on two independent expectations from the niche differen- tiation hypothesis was used with the same 20-ha Tiantong subtropical forest plot. The first expectation was the preva- lence of species-habitat associations and was examined us- ing species-habitat association tests. The second expectation was the positive association between species diversity and habitat complexity, and was examined using the association test between species diversity and habitat profile (Potts et al. 2004). Specifically, we expected that 1) if niche differ-
entiation among species is the main process underlying the species-habitat association, both wide-spread evidence of a species-habitat association and a strong positive correlation between species diversity and habitat complexity could be detected in the same plot; 2) if processes other than niche differentiation are largely responsible for the species-habitat association, weak or no evidence of the association between species diversity and habitat profile would be observed with a strong species-habitat association in the plot.
Materials and methods
Forest community data and environmental variables
We used a 20-ha (500 m × 400 m; 29°48.696’–29°48.
938’N, 121°46.953’–121°47.278’E) Tiantong forest dynamic plot in Ningbo, Zhejiang Province, China, as the study area.
The plot has a rough topology with 298 m of topographic relief (Fig. 1), and thus is large and heterogeneous enough to cover a substantial range of habitat complexity. The whole plot supports a typical subtropical evergreen broad-leaved forest with 151 species and 92,233 free-standing tree indi- viduals ≥ 1 cm in diameter at breast height (DBH). All of these individuals were tagged, measured, mapped, and identi- fied to species during 2007–2009. The plot is in the Palearctic region and has a typical subtropical monsoon climate with a hot, humid summer and a drier cold winter. The mean annual temperature is 16.2 °C and the annual precipitation is 1374.7 mm. Most precipitation occurs during the monsoon season, from May to August. The soil type is Oxisols. The whole plot was dominated by Eurya loquaiana, Litsea elongate, and Choerospondias axiliaris. Further detailed description of the Tiantong plot can be found in the study by Yang et al. (2011).
Because the reliability of any statistical method requires a reasonable minimum sample size, 79 rare species having less than 50 individuals in the entire plot were excluded from the species-habitat association tests, resulting in 72 species from a total sample of 151 species. In the correlation tests between species diversity and habitat complexity, all 151 species in the plot were evaluated. Because species coexist- ence mechanisms may vary substantially along various life stages (Comita et al. 2007), we categorized the individuals into a group containing small individuals (those with a DBH
< DBHmedian, in thatDBHmedian is the median DBH of the tree species population) and a group comprising large individuals (individuals with a DBH > DBHmedian). The two groups were analyzed separately.
The environmental variables used in the current study include four topographical parameters and four soil nutrient characteristics. The four topographical parameters were mean elevation, mean convexity (the elevation of the focal quadrat minus the mean elevation of the eight surrounding quadrats), mean aspect, and mean slope in each 5 m × 5 m non-over- lapping quadrat in the plot. They were calculated from the topology of the plot by using methods described by Harms et al. (2001). The four soil nutrient variables were soil pH, total N, total P, and total C, which were sampled from soil depths
ranging from 0 to 10 cm with high spatial resolution (Zhang et al. 2012b). We then generated maps of the estimated soil resource availability at the 5 m × 5 m scale for the entire plot by using block universal kriging (Stein 1999).
Species habitat association tests
The heterogeneous Cox point process model (Møller and Waagepetersen 2004) was used to examine the species-hab- itat association for each species in the Tiantong plot. An ad- vantage of this method is that it can be used to remove biases from other non-habitat clustering mechanisms (e.g., dispersal limitation) when testing for species-habitat association (Shen et al. 2013). This capability of the model is achieved by modeling the habitat effect and non-habitat clustering effect simultaneously on the spatial distribution of a species. The model is expressed as follows:
log L(u) = m + H(u)bT + D(u)
where log L(u) is a log-transformed random intensity func- is a log-transformed random intensity func- tion of a given species at any spatial location u in the whole plot, m is an intercept, b is a vector of regression parameters of length p, and H(u) is a vector of habitat variables at the spatial location u. In this study, all eight aforementioned envi- ronmental variables were included in H(u). The term D(u) is a random, zero-mean, and spatially correlated “residual effect”
that serves to model sources of aggregative variation not cap- tured by the habitat regression term H(u)bT. The spatial corre- lation of D(.) is a Gaussian process and is modeled using the Matérn covariance function (Oliver et al. 2005), which can describe diverse clustering behaviors ranging from tight and well-defined clusters to more dispersed and diffused clusters.
The parameters m, b and other parameters in D(u) in the heterogeneous Cox point process model were estimated using
a two-step approach presented by Waagepetersen and Guan (2009). Model selections regarding which environmental variable was included in the model and which form of co- variance function was used in D(u) were conducted through a step-wise model reduction. Shen et al. (2013) provided de- tails of model introduction, parameter estimation, and model selection.
The significance of the association of each species with habitat variables was estimated using the best-fitting hetero- geneous Cox point process model. To prevent the occurrence of a multiple testing problem (i.e., high type I error), the P-value of each habitat variable from the model was adjusted using methods presented by Sidak (1967). Consequently, if any adjusted P-value of b in the model for a species is smaller than 0.05, then at least one environmental variable signifi- cantly affects the spatial distribution of the species.
Correlation between habitat complexity and species diversity
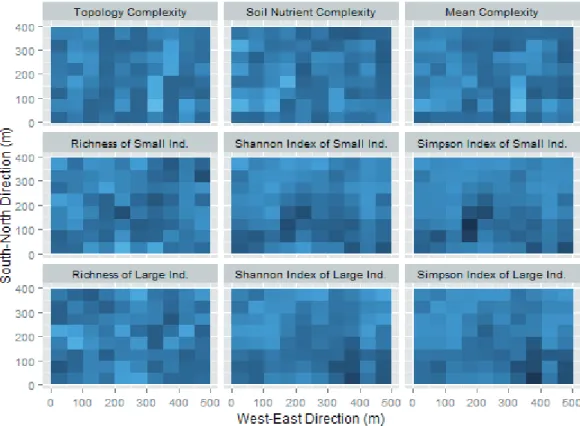
The entire 20-ha Tiantong plot was divided into 80 non- overlapping 50 m × 50 m quadrats. Habitat complexity and species diversity were calculated for each quadrat. The habi- tat complexity was measured using the topology complexity, mean variability of soil nutrients, and a mean complexity index (Fig. 2, top row), which is the mean of standardized topology complexity and the standardized mean variability of soil nutrients. Specifically, the topology complexity of each 50 m × 50 m quadrat was estimated as a fractal dimension of the topology profile at a 5 m × 5 m scale (Gneiting et al.
2012). In general, a higher complexity of a quadrat surface indicates a larger fractal dimension for that quadrat. The mean of soil nutrient variability was calculated as the mean Figure 1. Topological map of the 20-ha Tiantong permanent forest plot.
of the standard deviations of each measured soil nutrient vari- able in each quadrat. Species diversity was measured using the species richness, Simpson species diversity index, and Shannon species diversity index for each DBH size group in each quadrat (Fig. 2). Pearson’s product moment correlations and their P-values were calculated between each pair of spe- cies diversity indices and habitat complexity indices. To in- vestigate whether the quadrat size influenced our conclusions (González-Megías et al. 2007, Garzon-Lopez et al. 2014), we also examined the correlations between habitat complexity in- dices and species diversity indices in 20 m × 20 m and 100 m × 100 m non-overlapping quadrats.
The surface area of quadrats always increases with topo- graphic complexity. Because of the increased surface area, the number of individuals in each quadrat might increase with the topographical complexity of the quadrats. Therefore, topographically complex quadrats may contain a higher num- ber of species because of the increased surface area per se.
Because surface area estimates are scale dependent, a method that is based on fractal geometry was used to estimate the sur- face area-independent species richness for each quadrat. First, a scale-independent “spacing” estimator was used to convert the total number of individuals in quadrats having various surface complexities into the same dimension (Pennycuick and Kline 1986, Johnson et al. 2003). Here, the spacing rep- resents the average distance between different individuals on an idealized flat surface, and the reciprocal of spacing thus
provides an estimate of the adjusted total number of individu- als on a unit flat space. The adjusted species richness can be estimated through rarefaction according to the adjusted total abundance of each quadrat (Hurlbert 1971). Pearson’s prod- uct moment correlations and their P-values were calculated between each pair of adjusted species richness and habitat complexity indices. All of the analyses in the current study were conducted in the R environment (R Version 3.1.2) (R Core Team 2014).
Results
Similar to other studies, only a small number of spe- cies (13.89% in the group comprising small individuals and 9.72% in the group comprising large individuals) were ir- relevantly distributed to the observed topographical and soil nutrient variables (Fig. 3). Specifically, more than 86.11% of all species were significantly associated with one or more en- vironmental variables (Fig. 3). Even after correcting the type I error originating from the multiple test, the percentage of species having a significant correlation with at least one envi- ronmental variable reached 66.67% and 70.71% in the groups comprising small and large individuals, respectively.
Almost no significant positive correlation existed between all pairs of species diversity indices, adjusted species rich- ness, and habitat complexity indices in the Tiantong plot (Fig.
4 and 5, Table 1), except one positive correlation between Figure 2. Relative habitat complexity and relative species diversity in the Tiantong plot at the 50 m × 50 m quadrat scale. The darker the color is in a quadrat, the less complex (or less diverse) the quadrat. The habitat complexity was quantified using the topology com- plexity (fractal dimension of the quadrat), soil nutrient complexity (mean of soil nutrient variability), and mean complexity of topology and soil nutrient complexities. The species diversity was measured using the species richness, Shannon diversity index, and Simpson diversity index in each quadrat for the groups comprising small individuals (panels in the second row) and large individuals (panels in the third row).
species richness and the mean habitat complexity index at the 100 m × 100 m quadrat scale (shown in Table S2). Several significant, but negative, correlations existed between species diversity and habitat complexity for the group comprising large individuals at the 50 m × 50 m quadrat scale (Table 1).
These negative relationships between species diversity indi- ces and habitat complexity indices increased in frequency at the 20 m × 20 m quadrat scale, but disappeared at the 100 m
× 100 m quadrat scale (Tables S1 and S2). The negative cor- relations indicated that a higher habitat complexity resulted in less species diversity. This result contradicts the second expectation of the niche differentiation hypothesis.
Discussion
Similar to the results of other studies (Gunatilleke et al.
2006, John et al. 2007, Lai et al. 2009, Zhang et al. 2011, Zhang et al. 2012a), most species in the Tiantong plot were significantly correlated with at least one environmental vari- able. This result is consistent with the prediction of the spe-
cies-habitat association in the niche differentiation hypoth- esis. However, the results obtained from our correlation tests between species diversity and habitat complexity do not sup- port the relevance of the niche differentiation hypothesis be- cause random and even negative correlations between species diversity and habitat complexity were observed in the same Tiantong plot. Such non-positive relationships were also ob- served in other studies (Tamme et al. 2010, Gazol et al. 2013, Laanisto et al. 2013). The inconsistent results suggest that widespread species-habitat associations might be largely gen- erated by ecological processes other than the species niche differentiation in our natural forest community. These results cannot disprove the potential effect of niche differentiation on species coexistence, but they imply that the effect of niche differentiation on species diversity might be relatively weak- er than that of other processes.
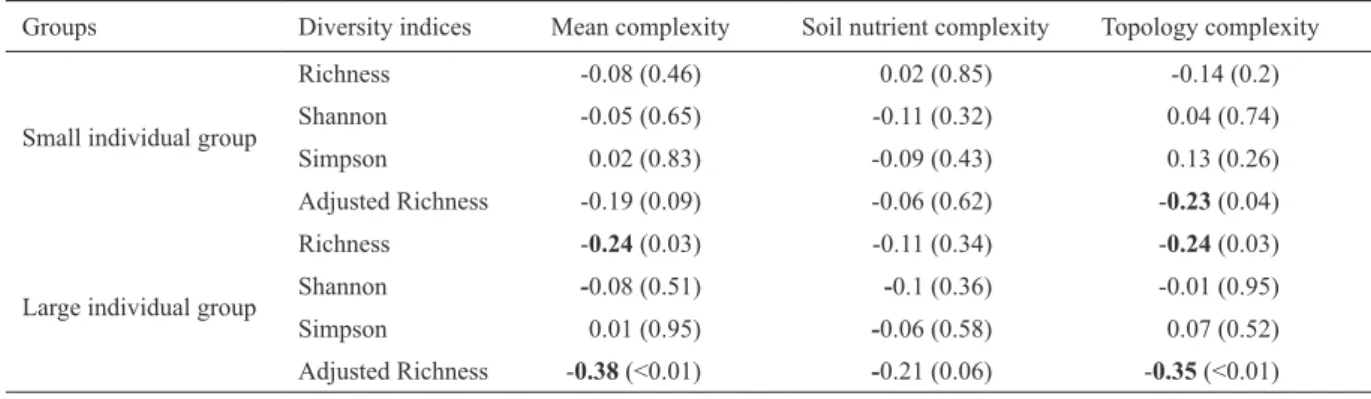
Indeed, other evidence suggests that the negative rela- tionship between species diversity and habitat complexity might be induced by processes (e.g., typhoons or soil nutrient availability) that determine the total number of individuals Table 1. Pearson’s product moment correlations and their associated P-values (in parentheses) between all pairs of habitat complexity indices and species diversity indices at the 50 m × 50 m quadrat scale. Correlation coefficients are expressed in bold if their associated P-values are < 0.05.
Groups Diversity indices Mean complexity Soil nutrient complexity Topology complexity
Small individual group
Richness -0.08 (0.46) 0.02 (0.85) -0.14 (0.2)
Shannon -0.05 (0.65) -0.11 (0.32) 0.04 (0.74)
Simpson 0.02 (0.83) -0.09 (0.43) 0.13 (0.26)
Adjusted Richness -0.19 (0.09) -0.06 (0.62) -0.23 (0.04)
Large individual group
Richness -0.24 (0.03) -0.11 (0.34) -0.24 (0.03)
Shannon -0.08 (0.51) -0.1 (0.36) -0.01 (0.95)
Simpson 0.01 (0.95) -0.06 (0.58) 0.07 (0.52)
Adjusted Richness -0.38 (<0.01) -0.21 (0.06) -0.35 (<0.01)
0.0 0.1 0.2
0 1 2 3 4 5 6 7 8
Proportion of Species
Group Large
Individuals Small Individuals
Number of significantly Correlated Environmental Variables
Figure 3. Distribution of species with dissimilar numbers of significantly correlated environmental variables in the Tiantong plot.
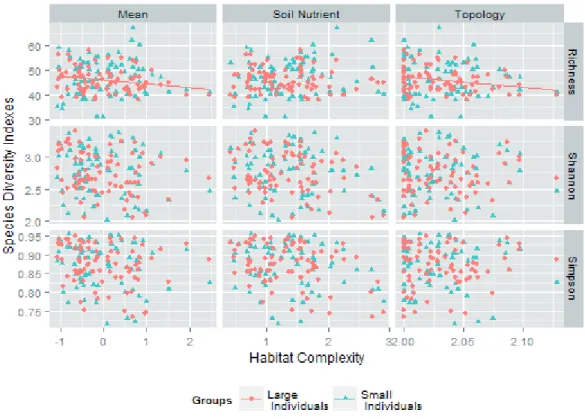
Figure 4. Scatter plots of three habitat complexity indices and three species diversity indices of the groups comprising small individuals (blue triangles and dashed lines) and large individuals (red points and solid lines) at the 50 m × 50 m quadrat scale. The three habitat com- plexity indices are the topology complexity (fractal dimension of the quadrat), soil nutrient complexity (mean of soil nutrient variability), and mean complexity of topology and soil nutrient complexities of each quadrat. The three species diversity indices are the species rich- ness, Shannon diversity index, and Simpson diversity index of each quadrat. No significant positive correlation was observed between any pair of these habitat complexity indices and species diversity indices (correlation coefficients and P-values shown in Table 1).
Figure 5. Scatter plots of three habitat complexity indices and the adjusted species richness of the groups comprising small individuals (blue triangles and dashed lines) and large individuals (red points and solid lines) at the 50 m × 50 m quadrat scale. The three habitat complexity indices are the topology complexity (fractal dimension of the quadrat), soil nutrient complexity (mean of soil nutrient vari- ability), and mean complexity of topology and soil nutrient complexities of each quadrat. The lines represent the linear regression lines of each pair of habitat complexity and adjusted species richness.
in various habitats. Figure S1 showed that there is a negative relationship between habitat complexity and number of tree individuals in the Tiantong plot. Thus a more heterogeneous habitat may be more disturbed, fragmented, and have fewer individuals, and therefore a lower species richness (Laanisto et al. 2013). As heterogeneity increases for a given area, the amount of effective area available for individual spe- cies decreases, thereby increasing the likelihood of stochas- tic extinctions and reducing species diversity (Allouche and Kadmon 2012). This negative correlation between species di- versity and habitat complexity may be largely attributable to typhoons, which have been proven to be a major disturbance almost yearly in the Tiantong forest community (Wang et al.
2014).
Our results also emphasize the importance of distinguish- ing between species habitat preference and the interspecific difference in habitat preferences. Species habitat preference is sufficient to generate the observed prevalent species-hab- itat association, but is unrelated to the interspecific habitat preference difference, which is the core concept of the niche differentiation hypothesis. Therefore, the species-habitat as- sociation test per se cannot identify whether differences in habitat preference exist, or play a crucial role in the natural forest community (Begon et al. 2006).
Whether interspecific differences in habitat preference exist and whether they promote species coexistence in het- erogeneous environments can be investigated further (Itoh et al. 2003, Noguchi et al. 2007). However, as mentioned in the Introduction, such investigations are inadequate to sup- port the relevance of niche differentiation in species coex- istence. Moreover, methods used to assess the relevance of habitat preference differences are still not fully developed (Itoh et al. 2003, Potts et al. 2004, Noguchi et al. 2007). The most challenging of these methods is to establish a reason- able null model in which the effect of niche differentiation among species is precisely controlled. Iton et al. (2003) used torus random shifts to break down the relationship between species distribution and habitats. In this method, even though the effect of interspecific niche differentiation was removed from the null model, a new bias that increased the differences between observed and expected species habitat presences was created. Potts et al. (2004) attempted to reduce this bias by controlling the niche breadth for each species in the null mod- el. However, the niche breadth is only one of several charac- teristics of species niche preference. In an ideal null model, the same observed habitat preference must be preserved for each species and the differences in habitat preference among species must be removed simultaneously; this is because the species habitat preference can exist without interspecific niche differentiation.
In summary, some caution is necessary in interpreting the species-habitat association from the niche differentiation per- spective. Widespread evidence of species-habitat associations is not adequate to justify the niche differentiation hypothesis, because species-habitat associations can result from basic and common biological requirements of organisms, and thus are possibly irrelevant to any niche differentiation among spe- cies.
Acknowledgements: We gratefully thank Haibo Yang, Xiaofeng Fang, Heming Liu and many field workers for their contributions to the Tiantong plot. We would also like to thank Dr. Joanne Maio for her assistance with English language and grammatical editing of the manuscript. This work was supported by the National Key Research and Development Program (2016YFC0503102 to G.C.S) and National Natural Science Foundation of China [31470487 to G.C.S. and 31210103920 to X.H.W].
References
Allouche, O. and R. Kadmon. 2012. Area-heterogeneity tradeoff and the diversity of ecological communities. Proc. Natl. Acad. Sci.
USA. 109:17495–17500.
Begon, M., C.R. Townsend and J. L. Harper. 2006. Ecology: From Individuals to Ecosystems. Fourth edition. Wiley-Blackwell, UK.
Comita, L., R. Condit and S. Hubbell. 2007. Developmental changes in habitat associations of tropical trees. J. Ecol. 95:482–492.
Garzon-Lopez, C.X., P.A. Jansen, S.A. Bohlman, A. Ordonez and H.
Olff. 2014. Effects of sampling scale on patterns of habitat as- sociation in tropical trees. J. Veg. Sci. 25:349–362.
Gazol, A., R. Tamme, J. Price, I. Hiiesalu, L. Laanisto and M. Pärtel.
2013. A negative heterogeneity-diversity relationship found in experimental grassland communities. Oecologia 173:545–555.
Gneiting, T., H. Sevikova and D.B. Percival. 2012. Estimators of fractal dimension: assessing the roughness of time series and spatial data. Stat. Sci. 27:247–277.
Goldberg, D.E. 1985. Effects of soil pH, competition, and seed preda- tion on the distributions of two tree species. Ecology 66:503–511.
González-Megías, A., J. María Gómez and F. Sánchez-Piñero. 2007.
Diversity-habitat heterogeneity relationship at different spatial and temporal scales. Ecography 30:31–41.
Gunatilleke, C.V.S., I.A.U.N. Gunatilleke, S. Esufali, K.E. Harms, P.M.S. Ashton, D.F.R.P. Burslem and P.S. Ashton. 2006.
Species–habitat associations in a Sri Lankan dipterocarp forest.
J. Trop. Ecol. 22:371–384.
Hamilton, T.H., I. Rubinoff, R.H. Barth and G.L. Bush. 1963. Species abundance: natural regulation of insular variation. Science 142:1575–1577.
Harms, K.E., R. Condit, S.P. Hubbell and R.B. Foster. 2001. Habitat associations of trees and shrubs in a 50-ha neotropical forest plot.
J. Ecol. 89:947–959.
Hubbell, S. and R. Foster. 1983. Diversity of canopy trees in a neo- tropical forest and implications for conservation. In: S.J. Sutton, T.C. Whitmoreand A.C. Chadwick (eds.), Tropical Rain Forest:
Ecology and Management. Blackwell Science, Oxford, UK. pp.
25-41.
Hurlbert, S.H. 1971. The nonconcept of species diversity: a critique and alternative parameters. Ecology 54:577–586
Hutchinson, G.E. 1959. Homage to Santa Rosalia or why are there so many kinds of animals? Am. Nat. 93:145–159.
Itoh, A., T. Yamakura, T. Ohkubo, M. Kanzaki, P. A. Palmiotto, J.
V. LaFrankie, P.S. Ashton and H.S. Lee. 2003. Importance of topography and soil texture in the spatial distribution of two sympatric dipterocarp trees in a Bornean rainforest. Ecol. Res.
18:307–320.
John, R., J.W. Dalling, K.E. Harms, J.B. Yavitt, R.F. Stallard, M.
Mirabello, S.P. Hubbell, R. Valencia, H. Navarrete, M. Vallejo and R.B. Foster. 2007. Soil nutrients influence spatial distri-
butions of tropical tree species. Proc. Natl. Acad. Sci. USA.
104:864–869.
Johnson, M.P., N.J. Frost, M.W.J. Mosley, M.F. Roberts and S.J. Haw- kins. 2003. The area-independent effects of habitat complexity on biodiversity vary between regions. Ecol. Lett. 6:126–132.
Johnson, M.P. and D.S. Simberloff. 1974. Environmental determi- nants of island species numbers in the British Isles. J. Biogeogr.
1:149–154.
Laanisto, L., R. Tamme, I. Hiiesalu, R. Szava-Kovats, A. Gazol and M. Pärtel. 2013. Microfragmentation concept explains non- positive environmental heterogeneity–diversity relationships.
Oecologia 171:217–226.
Lai, J., X. Mi, H. Ren and K. Ma. 2009. Species-habitat associations change in a subtropical forest of China. J. Veg. Sci. 20:415–423.
Losos, E.C. 1995. Habitat specificity of two palm species: ex- perimental transplantation in Amazonian successional forests.
Ecology 76:2595–2606.
Møller, J. and R.P. Waagepetersen. 2004. Statistical Inference and Simulation for Spatial Point Processes. Chapman and Hall/CRC Press, New York, USA.
Noguchi, H., A. Itoh, T. Mizuno, K. Sri-ngernyuang, M. Kanzaki, S.
Teejuntuk, W. Sungpalee, M. Hara, T. Ohkubo, P. Sahunalu, P.
Dhanmmanonda and T. Yamakura. 2007. Habitat divergence in sympatric Fagaceae tree species of a tropical montane forest in northern Thailand. J. Trop. Ecol. 23:549–558.
Oliver, M.A., R.M. Lark, B. Minasny and A.B. McBratney. 2005.
The Matérn function as a general model for soil variograms.
Geoderma 128:192–207.
Pennycuick, C.J. and N.C. Kline. 1986. Units of measurement for fractal extent, applied to the coastal distribution of bald eagle nests in the Aleutian Islands, Alaska. Oecologia 68:254–258.
Pickett, S.T.A. and F.A. Bazzaz. 1978. Organization of an assem- blage of early successional species on a soil moisture gradient.
Ecology 59:1248–1255.
Potts, M.D., S.J. Davies, W.H. Bossert, S. Tan and M.N.N. Supardi.
2004. Habitat heterogeneity and niche structure of trees in two tropical rain forests. Oecologia 139:446–453.
Primack, R.B. and S.L. Miao. 1992. Dispersal can limit local plant distribution. Conser. Biol. 6:513–519.
Pulliam, H. 1988. Sources, sinks and population regulation. Am. Nat.
132:652–661.
R Core Team. 2014. R: A Language and Environment for Statistical Computing. R Foundation for Statistical Computing, Vienna, Austria.
Shen, G., F. He, R. Waagepetersen, I.-F. Sun, Z. Hao, Z.-S. Chen and M. Yu. 2013. Quantifying effects of habitat heterogeneity and other clustering processes on spatial distributions of tree species.
Ecology. 91:2436–2443.
Sidak, Z. 1967. Rectangular confidence regions for the means of mul- tivariate normal distributions. J. Am. Stati. Associ. 62:626–633.
Stein, A., K. Gerstner and H. Kreft. 2014. Environmental heterogene- ity as a universal driver of species richness across taxa, biomes and spatial scales. Ecol. Lett. 17:866–880.
Stein, M.L. 1999. Interpolation of Spatial Data: Some Theory for Kriging. Springer, New York.
Tamme, R., I. Hiiesalu, L. Laanisto, R. Szava-Kovats and M. Pärtel.
2010. Environmental heterogeneity, species diversity and co- existence at different spatial scales. J. Veg. Sci. 21:796–801.
Thomson, J.D., G.D. Weiblen, B.A. Thomson, S. Alfaro and P.
Legendre. 1996. Untangling multiple factors in spatial distribu- tions: lilies, gophers, and rocks. Ecology. 77:1698–1715.
Waagepetersen, R. and Y. Guan. 2009. Two-step estimation for inho- mogeneous spatial point processes. J. R. Stat. Soc. B. 71:685–
702.
Walter, G. H.1991. What is resource partitioning? J. Theor. Biol..
150:127–143.
Wang, Z., X. wang and G. Shen. 2014. Effects of typhoon disturbance on the litter production in an evergreen broad-leaved forest in the Tiantong, Zhejiang. J. ECNU. 2014:79–89.
Wesser, S.D. and W.S. Armbruster. 1991. Species distribution con- trols across a forest-steppe transition: a causal model and experi- mental test. Ecol. Monogr. 61:323–342.
Whittaker, R.J. and J.M. Fernandez Palacios. 2007. Island Bio geo
graphy: Ecology, Evolution, and Conservation. Oxford Univ - ersity Press, UK.
Yang, Q.S., Z.P. Ma, Y.B. Xie, Z.G. Zhang, Z.H. Wang, H.M. Liu, P. Li, N. Zhang, D.L. Wang, H.B. Yang, X.F. Fang, E.R. Yan and X.H. Wang. 2011. Community structure and species com- position of an evergreen broad leaved forest in Tiantong’s 20 ha dynamic plot, Zhejiang province, eastern China. Biodiver. Sci.
19:215–223.
Zhang, L., X. Mi, H. Shao and K. Ma. 2011. Strong plant-soil as- sociations in a heterogeneous subtropical broad-leaved forest.
Plant and Soil 347:211–220.
Zhang, C., Y. Zhao, X. Zhao and K. Gadow. 2012a. Species-habitat associations in a northern temperate forest in China. Silva Fenn.
46:501–519.
Zhang, N., X. Wang, Z. Zheng, Z. Ma, Q. Yang, X. Fang and Y. Xie.
2012b. Spatial heterogeneity of soil properties and its relation- ships with terrain factors in broadleaved forest in Tiantong of Zhejiang Province, East China. C. J. Appl. Ecol. 23:2361–2369.
Received May 8, 2017 Revised July 6, 2017, March 31, 2018 Accepted April 13, 2018 Electronic Supplement
Table S1. Pearson’s product moment correlations and their associated P-values (in parentheses) between all pairs of hab- itat complexity indices and species diversity indices at the 20 m × 20 m quadrat scale.
Table S2. Pearson’s product moment correlations and their associated P-values (in parentheses) between all pairs of habitat complexity indices and species diversity indices at the 100 m × 100 m quadrat scale.
Figure S1. Relationships between observed total abundance in each quadrat and the complexity indexes at the 50 m × 50 m quadrat scale.
The file is available from www.akademiai.com