Community ECology 20(2): 194-204, 2019 1585-8553 © AkAdémiAi kiAdó, BudApest
dOi: 10.1556/168.2019.20.2.9
Introduction
Subalpine meadows, a category of vegetation based on perennial herbaceous plants, are widely distributed in China (Wu 1980, p. 243). However, studies on the ecology of sub- alpine meadow communities in China only began in the mid- dle of the past century. These studies focused primarily on classifying vegetation types and flora and thus have provided almost no research breakthroughs due to limitations in field investigation and measurement methods (Li 1962). Recently, improvements in quantitative ecology and biodiversity meas- urement methods have allowed for multi-level and multi- scale research on subalpine meadows. Current research in subalpine meadows has focused on community characteris- tics (Shangguan et al. 1989, Song et al. 2005), community diversity (Ma et al. 1995, Qu et al. 2015), classification and sorting (Jiang et al. 1994, Li et al. 2005), and influences of abiotic factors on communities (Xu et al. 2013, Liu et al
2018). Different diversity indices vary in ecological signifi- cance, and various indices are affected by multiple factors, which can lead to different results in community analyses.
Therefore, comprehensive analysis and measurement of more than one diversity index have become necessary in commu- nity ecology.
The Heyeping subalpine meadow on Luya Mountain is at 2500 m above sea level and is a typical subalpine meadow in North China. Since the mid-20th century, the subalpine meadow of Luya Mountain has been a hotspot of vegeta- tion ecology research. Studies in this meadow have mostly focused on classifying and ranking populations, spatial dis- tribution patterns of populations, determining community types, dominant populations, soil C and N content, and spa- tial heterogeneity (Li et al. 2005, Cheng et al. 2002, Wu et al.
2007, Wu et al. 2013, Zhang et al. 2005). Despite these stud- ies, comprehensive research on the diversity pattern of the
Multi-dimensional diversity patterns of the subalpine meadow on Heyeping peak, Luya Mountain, Shanxi province, China
J. Bai
1, T. ShangGuan
1and D. Guo
1,21College of Environmental & Resource Sciences, Wucheng Road 92, Xiaodian District, Taiyuan 030006, Shanxi, China
2Corresponding author. Tel: 86-13620613391; E-mail: gdghjkx@126.com
Keywords: Diversity pattern; Environmental factors; Index correlation; Multi-dimensional diversity; Subalpine meadow.
Abstract: Plant community diversity is a major research focus in community ecology. The relationship between diversity patterns and different diversity indices is important for developing and improving biodiversity protection. In order to fully understand multi-dimensional diversity patterns of the subalpine meadow on Heyeping peak of Luya Mountain, we used a systematic sampling method and set 150 1 m × 1 m plots in June of 2018. Based on an analysis of the subalpine meadow community on Heyeping peak, we measured multiple diversity indices, carried out a correlation analysis between diversity and environmental factors, and compared correlations among different diversity indices. The goal was to clarify the ecologi- cal mechanisms and variation among various diversity indices and environmental factors. The main results were as follows:
(1) The species diversity distribution was uniform, the taxonomic level was narrow, functional differences were small, and different pedigree structures were present in each plot. (2) A stable correlation between pedigree diversity index (PD) and species diversity index indicated niche conservativism; the net relatedness index (NRI) of community lineage structure was significantly correlated with the nearest species taxon index (NTI), species richness, and evenness index, indicating that plant community composition in the study area is mainly affected by habitat filtration. (3) The average taxonomic distinctness index (Δ+) and the average taxonomic distinctness index (Λ+) had a stable correlation; only the functional richness index (FRic) and Patrick species richness index were closely related. (4) Among the selected environmental factors, only the forest line had a stable correlation with species diversity index and PD and showed a negative correlation change, indicating an
“edge effect” distribution of species diversity in the study area. In summary, the forest line was the key factor affecting the distribution of species diversity in the study area and the species relationships within the community. This work was sup- ported by the National Natural Science Foundation of China (31400358).
Abbreviations: PD–Pedigree Diversity index; NTI–Nearest species Taxon Index; NRI–Net Relatedness Index; FRic–Functional Richness; FEve–Functional Evenness; FDiv–Functional Divergence; FDis–Functional Dispersion; Rao–Rao index; Δ+–average taxonomic distinctness index; Λ+–variation in taxonomic distinctness index.
Nomenclature: Cronquist (1984) for plants.
subalpine meadow community has not been conducted and ecological mechanisms of diversity on Luya Mountain have not been determined.
In this study, we investigated species diversity, taxonomic diversity, functional diversity, and pedigree diversity of plants in the subalpine meadow on Luya Mountain and calculated correlations among four types of diversity index and all four diversity indices with environmental factors. The goals of this study were to clarify the distribution of diversity and differ- entiation trends of the study area to further explore regional biodiversity measurement methods. Our results can hopefully provide a reference for protection, control, and recovery of biodiversity, and provide a theoretical basis for scientific and effective management of this meadow.
1. Materials and methods
1.1 Overview of the study field
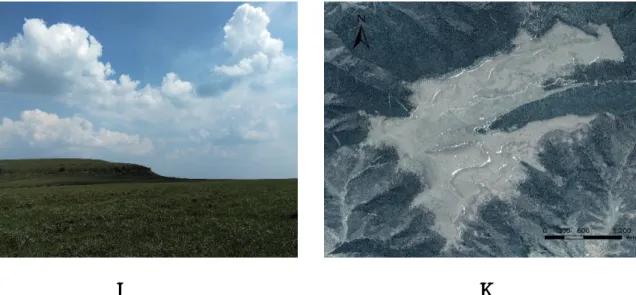
The study area is located on the main peak of Luya Mountain, Heyeping, Shanxi province, China (38°41′54.6′′–38°44′29.4′′N, 11°49′53.6′′–111°52′47.2′′E), at an elevation of 2783 m (Fig. 1). According to meteoro- logical data of Wujiagou (1555 m above sea level), annual average temperature of the study area is 6-10°C, annual precipitation is 384–679 mm, annual evaporation is 1800 mm, annual average relative humidity is 50–55%, and the frost-free period is 130-170 days. The soil is subal- pine meadow soil, and the soil parent material is mainly residue from rock weathering and slope accumulation. The soil surface layer has a 5-10 cm turf layer and the organic matter content can reach 10-15%. Subalpine meadow soil always provides an excellent foundation for alpine pas- ture. In addition, the fungus Cordyceps and the herbaceous plant Fritillaria are widely distributed, and subalpine meadow soil belts can develop alpine cultivation. Luya
Mountain is a temperate deciduous broad-leaved forest in the vegetation division, which has a clearly vertical veg- etation spectrum. The Heyeping meadow is classified as a subalpine shrub meadow zone with maximum elevation of 2450-2772 m and contains Artemisia grasses and meadows of Kobresia myosuroides (Wu et al. 2007, Ma et al. 2001).
1.2 Methods
1.2.1 Plots and field survey
Combining GIS image interpretation and literature re- view, the area with the least human interference was selected.
The sampling scheme used the system sampling method to select the ideal area. As shown in Figure 2, a total of 30 plots (5 m × 5 m) were set up and a 1 m × 1 m herb sample was set at each of the four corners and in the center of the plot for a community survey in June of 2018. The species names and averages of all species were recorded in each plot as well as the height, coverage, and abundance grades; Braun-Blanquet (1964) grading standards were selected for abundance grades and Drude’s grading standards were selected for coverage grades. A total of 150 herbal samples were investigated (Fang 2009). GPS and a compass were used to record the latitude and longitude, elevation, slope direction, slope aspect, and the distance between the plot and the forest line; the slope aspect was converted into data between 0-1 in the calcula- tion process. The conversion formula is as follows (trans- formation of aspect, TRASP, Roberts and Cooper 1989):
TRASP = {1–cos [(π/180) (aspect–30)]}/ 2
where TRASP is the slope direction index; and aspect is the slope direction angle. Through conversion, the TRASP nu- merical value varies from 0-1. The larger the value, the hotter
Multi-dimensional diversity patterns of the subalpine meadow
5
a b
Fig. 1 Overview of research area
a: Photo of the subalpine meadow on Heyeping peak, Luya Mountain (photo taken in May 2017). b: Satellite image map of the subalpine meadow on Heyeping peak, Luya Mountain.
Figure 1. Overview of research area. a: Photo of the subalpine meadow on Heyeping peak, Luya Mountain (photo taken in May 2017).
b: Satellite image map of the subalpine meadow on Heyeping peak, Luya Mountain.
196 Bai et al.
the habitat; 0 is for slopes that are north-northeast and 1 is for slopes that are south-southeast.
1.2.2 Species diversity calculation
In this study, the species diversity of the study area was measured from three aspects: species richness, diversity, and evenness. The calculation formulas were as follows (Zhang 2011, Bai et al. 2018, Cui et al. 2016):
Patrick, R=S (1)
Simpson,
∑
= − = s − 1 i( 1 ) ) 1 - ( 1
N N N Ni iλ
(2)Shannon, ( ) N Ni s i
N ln ' N H
1∑
i = − = (3)Alatalo,
E
p= H ' / ln( S )
(4)In these formulae S is the total number of species in each square; N is the sum of the relative coverage of the S species; and Ni is the relative coverage of the ith species. According to the method of setting up field plots, each numerical value here represents the species diversity of one small sample, and five small samples constitute a plot. The average numerical value here is the species diversity of each plot, as shown in Figure 1. 1.2.3 Data acquisition and diversity calculation 1.2.3.1 Data acquisition. According to the actual situation of the study area, a total of 10 indicators were selected from the three types of plant functional traits. These indicators were mainly obtained through field investigations, and some were obtained by consulting Chinese vegetation records and relat- ed studies. The functional traits were assigned to numerical data (Table 1). 1.2.3.2 Functional diversity calculation. In this study, function- al richness index (FRic), functional uniformity index (FEve), and functional dispersion indices (Rao, FDiv, and FDis) were used to measure the functional diversity of the Heyeping subal- pine meadow on Luya Mountain. Calculations of these indices were performed using FDiversity, DCOM 3.1-2B7, and R 13.0 software (Dong et al. 2013). The five functional diversity indi- ces were calculated as described below. FRic is obtained by calculating the volume of the small- est polygon generated in the functional trait space (Mouillot et al. 2005). The formula of FEve (Mouillot et al. 2005) is as follows: (5)
(6)
(7)
In the above formulas, S is the number of species, PEWb is the local weighted average uniformity, EWb is the weight- ed average uniformity, wi is the relative abundance of spe- cies i, wj is the relative abundance of species j, and dij is the Euclidean distance between species i and j. There are a total of S-1 branches in the MST of S species and each of the b branch length is divided by the sum of the abundance of the species linked. Multi-dimensional diversity patterns of the subalpine meadow 7 Fig. 2 Plot layout of the study area. Figure 2. Plot layout of the study area. Multi-dimensional diversity patterns of the subalpine meadow 11 𝐹𝐸𝑣𝑒=∑��������������� ��•���� ������ ���
(5)
𝑃𝐸𝑊� =∑ ����� ��� � ���
(6)
𝐸𝑊� =���� ����
(7)
In the above formulas, S is the number of species, PEW
bis the local weighted average uniformity, EW
bis the weighted average uniformity, w
iis the relative abundance of species i, w
jis the relative abundance of species j, and d
ijis the Euclidean distance between species i and j. The calculation formula for Rao’s Index (Zhang et al. 2011, Dong et al. 2013) is as follows:
𝑅𝑎𝑜=∑ ∑� 𝑑��𝑤�𝑤� � ��� ���(8)
where S is the number of species, d
ijis the Euclidean distance between species i and using the convex polygon volume of the species. The specific formula is as follows (Zhang et al. 2011):
g� =��∑� x�� ���(9)
dG� =�∑����(x��−g�)�
(10)
dG����=��∑� dG� ���
(11)
△d =∑����w�•�dG�−dG�����
(12)
△|d| =∑����w�•�dG��dG�����
(13)
FD��=△|�|���△������������
(14)
The calculation formula for Rao’s Index (Zhang et al.
2011, Dong et al. 2013) is as follows:
(8)
where S is the number of species, dij is the Euclidean distance between species i and species j, wi is the relative abundance of species i, and wj is the relative abundance of species j. FDiv is calculated using the convex polygon volume of the species. The specific formula is as follows (Zhang et al. 2011): (9)
(10)
(11) (12)
(13)
(14)
where S is the number of species, xik is the value of trait k in species i, gk is the center of trait k, T is trait number, D is the average distance between species i and the center of gravity, d is the degree of dispersion with the weight of the degree, and wi is the relative degree of species i. The calculation formula for FDis is (Zhang et al. 2011): (15)
(16)
where c is the weighted center of gravity, wj is the relative abundance of species j, xik is the k value of species i, and zj is the weighted distance between species j and gravity c. 1.2.4 Spectral diversity and taxonomic diversity calculation 1.2.4.1 Pedigree diversity calculation. Pedigree diversity (PD) is the total sum of all branch lengths in the phylogenetic tree of species in the community (Webb et al. 2008, Chen et al. 2009). The community lineage structure of each plot was ana- lyzed by calculating the net relatedness index (NRI) and the nearest species taxon index (NTI)(Webb et al. 2008, Chen et al. 2009): ) ( 1 S randsample randsample sample sample d MPD MPD NRI MPD − × − = (17)
) 1 ( randsample randsample sample sample Sd MNTD MNTD NTI MNTD − × − = (18)
Table 1. The functional traits. Functional traits Types of functional traits Acquisition methods Data type Life history 1. Annual plants; 2. One -or two-year plants; 3. Biennial plants; 4. Perennial plants References acquisition Nominal Pollination mode 1. Wind pollinated; 0. Insect pollinated References acquisition and field survey Nominal Nitrogen-fixing type 1. Nitrogen fixation; 0. Non-nitrogen fixation References acquisition Nominal Root type 1. Taproot; 0. Fibrous References acquisition Nominal Fruit type a. Schizocarp; b. Follicle; c. Pod; d. Nut; e. Berry; f. Achene; g. Capsule; h. Caryopsis References acquisition and field survey Nominal Flowering time Flowering month Field survey Numerical Florescence Flowering period References acquisition and field survey Numerical Bloom time Blossom month Field survey Numerical Fruiting stage Blossom period References acquisition and field survey Numerical Frequency - Field survey Numerical Multi-dimensional diversity patterns of the subalpine meadow 11 𝐹𝐸𝑣𝑒 =∑��������������� ��•���� ������ ���
(5)
𝑃𝐸𝑊� =∑����� ��� � ���
(6)
𝐸𝑊�=���� ����
(7)
In the above formulas, S is the number of species, PEW
bis the local weighted average uniformity, EW
bis the weighted average uniformity, w
iis the relative abundance of species i, w
jis the relative abundance of species j, and d
ijis the Euclidean distance between species i and j. The calculation formula for Rao’s Index (Zhang et al. 2011, Dong et al. 2013) is as follows:
𝑅𝑎𝑜 = ∑����∑����𝑑��𝑤�𝑤�(8)
where S is the number of species, d
ijis the Euclidean distance between species i and using the convex polygon volume of the species. The specific formula is as follows (Zhang et al. 2011):
g� =��∑ x���� ��(9)
dG�= �∑����(x��− g�)�
(10)
dG���� =��∑ dG� � ���
(11)
△ d = ∑ w���� �• �dG�− dG�����
(12)
△ |d| = ∑ w���� �• �dG��dG�����
(13)
FD��=△|�|���△������������
(14)
Multi-dimensional diversity patterns of the subalpine meadow 11 𝐹𝐸𝑣𝑒=∑��������������� ��•���� ������ ���
(5)
𝑃𝐸𝑊�=∑ ����� ��� � ���
(6)
𝐸𝑊� =���� ���� (7)
In the above formulas, S is the number of species, PEW
bis the local weighted average uniformity, EW
bis the weighted average uniformity, w
iis the relative abundance of species i, w
jis the relative abundance of species j, and d
ijis the Euclidean distance between species i and j. The calculation formula for Rao’s Index (Zhang et al. 2011, Dong et al. 2013) is as follows:
𝑅𝑎𝑜=∑ ∑� 𝑑��𝑤�𝑤� � ��� ���(8)
where S is the number of species, d
ijis the Euclidean distance between species i and using the convex polygon volume of the species. The specific formula is as follows (Zhang et al. 2011):
g� =��∑� x�� ���(9)
dG�=�∑����(x��−g�)�
(10)
dG����=��∑� dG� ���
(11)
△d =∑����w�•�dG�−dG�����
(12)
△|d| =∑����w�•�dG��dG�����
(13)
FD��=△|�|���△������������
(14)
Multi-dimensional diversity patterns of the subalpine meadow 12 △d =∑����w�•�dG�−dG����� (12)
△|d| =∑����w�•�dG��dG����� (13)
FD��=△|�|���△������������ (14)
where S is the number of species, xik is the value of trait K in species i, gk is the center of trait K, T is trait number, dG���� is the average distance between species i and the center of gravity, d is the degree of dispersion with the weight of the degree, and wi is the relative degree of the species i. The calculation formula for FDis is (Zhang et al. 2011): c = [c�] =∑ �∑ ����� � (15)
FD��=∑ �∑ ���� � (16)
where c is the weighted center of gravity, wj is the relative abundance of species j, xik is the k value of species i, and zj is the weighted distance between species j and gravity c. 1.2.4 Spectral diversity and taxonomic diversity calculation 1.2.4.1 Pedigree diversity calculation. Pedigree diversity (PD) is the total sum of all branch lengths in the phylogenetic tree of species in the community (Webb et al. 2008, Chen et al. 2009). The community lineage structure of each plot was analyzed by calculating the net relatedness index (NRI) and the nearest species taxon index (NTI)(Webb et al. 2008, Chen et al. 2009). ) ( 1 S randsample randsample sample sample d MPD MPD NRI MPD (17)
198 Bai et al.
In the above formula, NRIs, NTIs, MPDs, and MNTDs rep- resent actual observations in the community; MPDr and MNTDr represent the mean values obtained by 999 random combinations of species on the constructed lineage tree;
and Sd is the standard deviation. The online tree generation tool Phylomatic (http://phylodiversity.net/phylomatic/) and FigTree software (Xiao et al. 2018) were used to obtain the phylogenetic tree based on the angiosperm classification sys- tem III (APGIII) and the community lineage structure index was calculated using the R language Picante package (Xiao et al. 2018, Barak et al. 2017).
1.2.4.2 Taxonomic diversity calculation. Using basic data from the field survey and of the Chinese flora, we system- atically sorted out the species list of the Heyeping subalpine meadow on Luya Mountain. According to the Engler taxon- omy method, plant species were divided into five categories:
class, order, family, genus, and species, and a phylogenetic tree was generated. The two species that were furthest apart in the classification categories were defined as 100 (Clarke et al. 1998, 2001), and then the difference in each level between species was measured in the form of weights (Clarke et al.
1998, 2001).
The formula for the taxonomic diversity measurement is:
(Δ+) =
Multi-dimensional diversity patterns of the subalpine meadow
13
) 1 (
randsample randsample sample
sample Sd MNTD
MNTD
NTI MNTD
(18)
In the above formula, NRIs, NTIs, MPDs, and MNTDs represent actual observations in the community; MPDr and MNTDr represent the mean values obtained by 999 random combinations of species on the constructed lineage tree; and Sd is the standard deviation. The online tree generation tool Phylomatic
(http://phylodiversity.net/phylomatic/) and FigTree software (Xiao et al. 2018) were used to obtain the phylogenetic tree based on the angiosperm classification system III (APGIII) and the community lineage structure index was calculated using the R language Picante package (Xiao et al. 2018, Barak et al. 2017).
1.2.4.2 Taxonomic diversity calculation. Using basic data from the field survey and of the Chinese flora, we systematically sorted out the species list of the Heyeping subalpine meadow on Luya Mountain. According to the Engler taxonomy method, plant species were divided into five categories: class, order, family, genus, and species, and a phylogenetic tree was generated. The two species that were furthest apart in the classification categories were defined as 100 (Clarke et al. 1998, 2001), and then the difference in each level between species was measured in the form of weights (Clarke et al. 1998, 2001).
The formula for the taxonomic diversity measurement is:
(Δ+) = 1 2
i< j ij
ω n n -
( )
( ) (19)
(Λ+) = 1 2
ij + i< j
ω -Δ n n-
( )( ) (20)
In the above formula, n is the number of species present in the plot and wij is the length of the path of the ith and jth species in the phylogenetic tree. PRIMER 6 was used to calculate the taxonomic diversity index (Qin and Li 2015).
(19)
(Λ+) =
Multi-dimensional diversity patterns of the subalpine meadow
13
) 1 (
randsample randsample sample
sample SdMNTD
MNTD
NTI MNTD
(18)
In the above formula, NRIs, NTIs, MPDs, and MNTDs represent actual observations in the community; MPDr and MNTDr represent the mean values obtained by 999 random combinations of species on the constructed lineage tree; and Sd is the standard deviation. The online tree generation tool Phylomatic
(http://phylodiversity.net/phylomatic/) and FigTree software (Xiao et al. 2018) were used to obtain the phylogenetic tree based on the angiosperm classification system III (APGIII) and the community lineage structure index was calculated using the R language Picante package (Xiao et al. 2018, Barak et al. 2017).
1.2.4.2 Taxonomic diversity calculation. Using basic data from the field survey and of the Chinese flora, we systematically sorted out the species list of the Heyeping subalpine meadow on Luya Mountain. According to the Engler taxonomy method, plant species were divided into five categories: class, order, family, genus, and species, and a phylogenetic tree was generated. The two species that were furthest apart in the classification categories were defined as 100 (Clarke et al. 1998, 2001), and then the difference in each level between species was measured in the form of weights (Clarke et al. 1998, 2001).
The formula for the taxonomic diversity measurement is:
(Δ+) = 1 2
i< j ij
ω n n -
( )
( ) (19)
(Λ+) = 1 2
ij + i<j ω -Δ
n n-
( )( ) (20)
In the above formula, n is the number of species present in the plot and wij is the length of the path of the ith and jth species in the phylogenetic tree. PRIMER 6 was used to calculate the taxonomic diversity index (Qin and Li 2015).
(20)
In the above formulae, n is the number of species present in the plot and wij is the length of the path of species i and j in the phylogenetic tree. PRIMER 6 was used to calculate the taxonomic diversity index (Qin and Li 2015).
1.2.5 Statistical analysis
The R language gclus package (Xu et al. 2014) was used to compare the diversity index of each dimension and com- pare the diversity index of four dimensions with elevation, slope, aspect, and distance between plot and forest line, and to calculate the correlation of the results. In order to further explore the trend between the diversity index and the envi- ronmental factors, the regression analysis was performed by curve fitting regression analysis of the environmental factors to the significantly different diversity index, the regression equation was established, and the fitted graph was made.
2. Results
2.1 Multidimensional diversity index
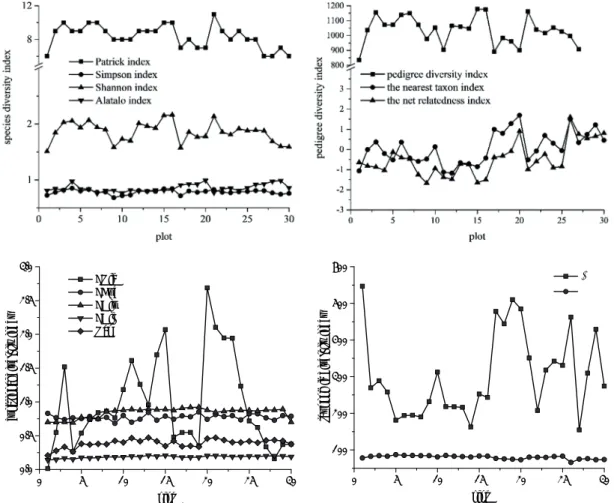
Figure 3 shows the results for the four diversity indi- ces. Species richness and evenness were measured using
the Patrick and Alatalo indices, respectively, and their val- ues were between 6-11 and 0.7-0.9, respectively. Differences among the plots were small. However, the two indices reflect- ing species diversity gave different results. The distribution of species diversity in the study area was relatively uniform.
The pedigree diversity index showed that in plots 6, 20, 26, 27, 28, 29, and 30, the net relatedness index (NRI) and the nearest taxon index (NTI) were greater than 0. This showed that the community lineage structure in these plots had an aggregated pattern. In contrast, in plots 1, 4, 5, 7, 8, 9, 11, 12, 13, 14, 15, 16, 21, 22, and 25, NRI and NTI were less than 0, showing a dispersed pattern of community lineage structure in these plots. In the remaining plots, the NRI and NTI results did not suggest the same pattern, so it was impossible to ac- curately judge whether the community lineage structure was aggregated or dispersed.
Figure 3 shows the range of variation for the average taxonomic difference index (Δ+) and the taxonomic differ- ence variation index (Λ+) from 30 plots. The Λ+ value of plot 1 was the largest, indicating that the species distribution of plot 1 had the lowest homogeneity. The Λ+ value of plot 27 was the smallest, indicating that the species distribution of plot 27 was uniform. The Δ+ value of plot 5 was the largest, indicating that the plot had the largest taxonomic diversity and the highest taxonomic level; plot 20 had the smallest Δ+
value, indicating that the taxonomic diversity of this plot was the smallest and the taxonomic level was the lowest. Plot 1 and plot 20 had the lowest and highest functional richness, respectively. Functional uniformity was highest in plot 9 and lowest in plot 19. The calculation result was inversely pro- portional to dispersion due to the unmodified Rao formula, that is, the larger the value, the smaller the dispersion. This indicated a higher probability for functional dispersion of plot 21, and a lower possibility of low dispersion for plot 1.
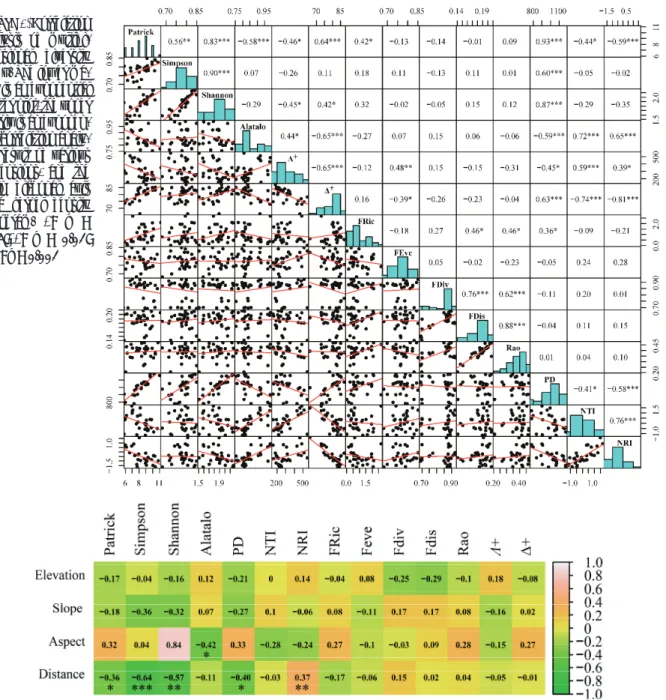
2.2 Correlation between diversity indices
Results of the correlation analysis among the multi- dimensional diversity indices are shown in Figure 4. The pedigree diversity index (PD) was significantly positively correlated with the Patrick index reflecting the species rich- ness and the Simpson and Shannon indices reflecting species diversity, indicating niche conservation in the study area. PD and the Alatalo species uniformity index were significantly negatively correlated. The NRI and NTI indices, which reflect the community pedigree structure, were positively correlated with the species richness index, negatively correlated with the species uniformity index, and had no significant correla- tion with the species diversity index. This indicated that the plant community composition in the study area was mainly affected by habitat filtration, and that the species distributed within the community had a close genetic relationship. Δ+
and Λ+ had a stable correlation and Λ+ had a more significant correlation with species diversity index. The functional rich- ness index FRic was significantly correlated with the Patrick species richness index at a confidence level of 0.05; the func- tional uniformity index and functional dispersion index were not correlated with the species diversity index.
2.3 Spatial distribution pattern of diversity
The correlation between species diversity index and environmental factors is shown in Figure 5. The results of Pearson’s correlation test show that there was no significant correlation between various species diversity indices and al- titude and slope, and only the Alatalo index for measuring species uniformity was negatively correlated with the slope aspect. The species richness index and species diversity in- dices had a stable correlation with the distance to the forest line and a negative correlation change. This phenomenon in- dicates that diversity decreases with increasing distance from the forest line, and the diversity distribution shows an “edge effect”. The pedigree diversity (PD) and the net relatedness index (NRI) have a stable correlation with forest line distance, but they change in opposite directions: PD decreases with in- creasing forest line distance, while NRI increases. Based on the above results, the forest line is the main influencing factor for the distribution pattern of species diversity in Heyeping subalpine meadow on Luya Mountain.
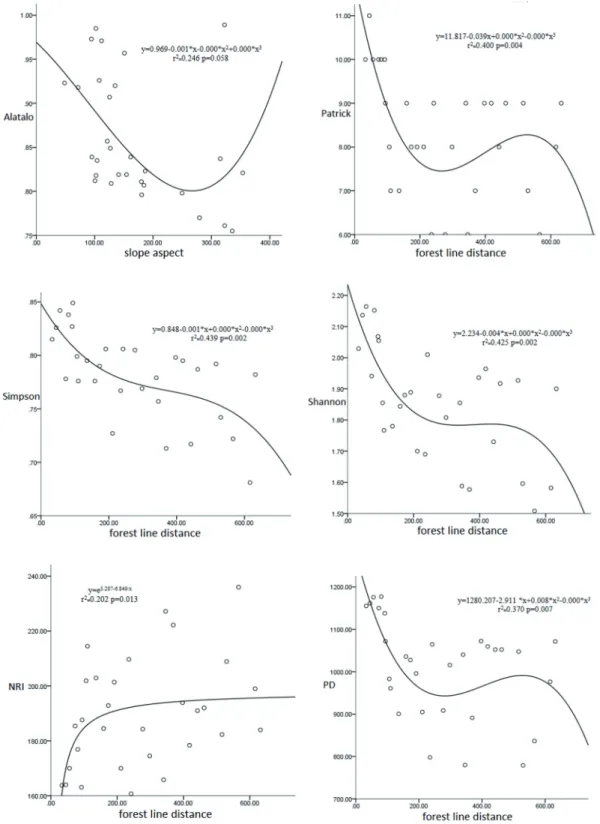
The correlation between diversity index and environmen- tal factors is shown in Figure 6. It can be seen from the fit- ted graph and the regression equation that the Alatalo index decreases first and then increases with the change of the slope
aspect. From the variation trend, the species uniformity of the southern slope is the highest, while the species uniform- ity of the northwest slope is the lowest. The species richness index, diversity index, and evenness index were significantly negatively correlated with the forest line distance, indicating that the diversity index will gradually decrease as the forest line distance increases, but this trend is not monotonous. PD decreased with the increase of forest line distance, indicat- ing that the species relationship in the community gradually became similar with the increase of forest line distance, and the species richness in the community also decreased. As the distance of the forest line increases, the NRI index increases first and then tends to be stable.
3. Discussion
Species diversity is the basis of ecosystem function, and it can reflect the community structure type, developmental stage, tissue level, and habitat heterogeneity of the commu- nity (Chen et al. 2009). In addition, the differences in com- position, function, and succession of different communities and species are closely related to species diversity (Ma et al.
2004). The species diversity index showed that the pattern of species diversity in the study area is uniform. Some previous
15
Fig. 3 Calculation results of different diversity indices. FRic–functional richness, FEve–functional evenness, FDiv–functional divergence, FDis–functional dispersion, Rao–Rao index, Δ
+–average taxonomic distinctness index, Λ
+–variation in taxonomic distinctness index.
0 5 10 15 20 25 30
0.0 0.5 1.0 1.5 2.0 2.5 3.0
functional diversity index
plot FRic
FEve FDiv FDis Rao
0 5 10 15 20 25 30
100 200 300 400 500 600
taxonomic diversity index
plot
Figure 3. Results for four different diversity indices. FRic–functional richness, FEve–functional evenness, FDiv–functional diver- gence, FDis–functional dispersion, Rao–Rao index, Δ+–average taxonomic distinctness index, Λ+–variation in taxonomic distinct- ness index.
200 Bai et al.
studies have shown that the number of dominant species in the community is usually closely related to the natural envi- ronment where it is located (Yuan et al. 2016), inferring that this phenomenon may be related to the climatic conditions in the study area. Plant communities show some differences in the degree of aggregation due to different research scales (Huang et al. 2010, Zhang et al. 2009). Inconsistent commu- nity lineage structure was observed on the small scale in this study. For example, neutral factors, interspecific competi- tion, and habitat filtration all had direct effects on community species aggregation. However, the life cycle of herbaceous plants was shorter than that of woody plants, but their abil- ity to spread was better than for woody plants. Herbaceous plants can occupy and adapt to new habitats in a short period of time meaning that the population has greater volatility and
that there are differences in community lineage structure (Niu et al. 2011, Zhao et al. 2017). The range of variation of the five functional diversity index values selected in this study was small, and differences among the plots were not signifi- cant, indicating that species functional heterogeneity of the Heyeping subalpine meadow on Luya Mountain is relatively low. Previous studies have shown that the higher the func- tional separation index, the weaker the niche overlap effect, and the weaker relative resource competitiveness in the same ecosystem (Clarke et al. 2001, Zhang et al. 2011). Therefore, in this study, the high functional dispersion in plot 21 indi- cates its high resource utilization, which can be used to in- crease the function of the ecosystem.
Correlation analysis showed a positive correlation be- tween the pedigree diversity (PD) and species richness, in- Multi-dimensional diversity patterns of the subalpine meadow
16
Fig. 4 Correlation analysis of multidimensional diversity index. The lower matrix is an exponential scatter plot, the upper matrix is an exponential correlation analysis result of various dimensions, and the main diagonal axis is a kernel density histogram.
*p<0.05;** p<0.01; ***<0.001
Figure 4. Correlation analysis of multidi- mensional diversity index. The lower ma- trix is an exponential scatter plot, the upper matrix is an exponen- tial correlation analy- sis result of various dimensions, and the main diagonal axis is a kernel density histogram. *: p <
0.05;**: p < 0.01;
***: p < 0.001
Multi-dimensional diversity patterns of the subalpine meadow
18
Fig. 5 Correlation between diversity index and environmental factors.
Figure 5. Correlations between diversity indices and environmental factors. Distance is measured from the 30 plots and the forest line.
dicating that the ecological niche of the study area is con- servative, which is consistent with the findings of Li for the community lineage structure in Meili Snow Mountain plants (Li 2015). Traditional measures of species diversity include species richness, species uniformity, and taxonomic relation- ships among species. The average taxonomic difference in- dex (Δ+) and the taxonomic difference variation index (Λ+) are well integrated in the above three aspects, which is con-
sistent with our conclusion of a stable correlation between two types of indices (Qin and Li 2015). Functional richness measures the niche space of the current species in the com- munity. The higher the functional richness, the more species are represented. Therefore, when the number of species in- creases, functional richness increases, functional trait values are larger, and the range of functional space values occupied by the community will increase (Xue et al.2015, Schleuter et Multi-dimensional diversity patterns of the subalpine meadow
19
Fig. 6 Fitting diagram of regression equation of diversity index and environmental factor
Figure 6. Regression analyses between diversity indices and environmental variables.
202 Bai et al.
al. 2010). In this study, a positive correlation between spe- cies richness and functional richness was observed. A similar result was also obtained from the study of Xue (2015) on the functional diversity of woody plants in the forest community of Wulu Mountain, Shanxi (Xue et al. 2015).
Patterns of diversity are restricted by many ecological gradient factors (Wang et al. 2018). Elevation, slope, and aspect are the main topographical factors that vary and thus affect solar radiation, precipitation redistribution, and then affect the diversity pattern (Niu et al. 2017). The correlation between diversity index and elevation, slope, and aspect showed that only the Alatalo species uniformity index had a stable negative correlation with the slope direction. This is mainly related to the topographical features of the study area: differences in altitude were small because the ter- rain is flat and no significant temperature difference and no significant habitat heterogeneity was present, so the topo- graphic factors do not cause obvious habitat fragmentation.
Therefore, the habitats of different communities and the resources necessary for plants are less variable. However, Shao (2014) obtained different conclusions in a study of Yunmengshan National Forest Park: species richness was negatively correlated with slope direction and slope posi- tion. The reason for this difference may be due to differ- ent vegetation types in the two study areas. The subalpine meadow community and species composition have a single structure and poor stability compared with the arbor-based community structure. As an ecological transition zone, the forest line will undergo significant changes in energy flow and material circulation, and the coverage and patterns of nearby vegetation will be affected, resulting in a gradual change in community structure (Liu et al. 2010, Bi et al.
2004). The correlation analysis between the four diversity indices with forest line distance found that the species uni- formity index, richness index, and diversity index were neg- atively correlated with the forest line and showed negative correlations in the fitted graph. This phenomenon indicates that the species uniformity increases with the distance from the forest line. The richness and diversity will decrease to different extents, and the closer to the edge of the forest line, the larger the value, indicating that the study area has an “edge effect”. Previous studies have shown that habitat heterogeneity is higher at the intersection of two habitats, and the diversity of herbaceous plants and pioneer species is more likely to reach the maximum at the edge, which is consistent with the results of this study (Qu et al. 2000). The trend of Simpson index is more obvious (Fig. 6), because the Simpson index is more sensitive to enriched species and the Shannon index is more sensitive to sparse species. These results indicate that the niche dominance in the study area is obvious and mainly distributed at the edge of the forest line, which is consistent with the results of Bi (2004), in the study of the edge effect of Huoshan broad-leaved forest.
The NRI index is more sensitive to detecting inter-species competition. It can be seen from the trend of the fitted graph that as the distance between forest lines increases, the domi- nant role of inter-species competition in the community is
gradually weakened, and is transformed into inter-species competition and habitat filtering.
The diversity indices in this study have different ecologi- cal significance and generate variable results due to the influ- ence of different factors. Therefore, comprehensive analysis of multiple diversity indices can more completely measure the biodiversity of a certain area. Spatial profiles are im- portant for biodiversity conservation. The soil environment is also an important factor affecting the differences in plant community distribution patterns. Many studies have shown that the structure and composition of plant communities are affected by factors such as soil water content, soil organic carbon and total nitrogen content, while grazing also affects subalpine meadow communities and soil environment to var- ying degrees (Wu et al. 2007, Chu et al. 2017). In the future, based on this research, we can further explore the intrinsic mechanism of multi-dimensional diversity index with soil en- vironment and human disturbance. This more comprehensive understanding of the distribution pattern and differentiation mechanism of subalpine meadow biodiversity can provide a reference and further guidance for the protection of subalpine meadow biodiversity.
4. Conclusion
After the measurement and correlation analysis of mul- tidimensional indexes of diversity, the main results were as follows. (1) The species diversity distribution was uniform, the taxonomic level was narrow, functional differences were small, and different pedigree structures were present in each plot. (2) A stable correlation between pedigree diversity index (PD) and species diversity index indicated niche conservativ- ism; the net relatedness index (NRI) of community lineage structure was significantly correlated with the nearest species taxon index (NTI), species richness, and evenness index, in- dicating that plant community composition in the study area is mainly affected by habitat filtration. (3) The taxonomic di- versity index Δ+ and the Λ+ index of species diversity had a stable correlation; only the functional richness index (FRic) and Patrick species richness index were closely related. (4) Among the selected environmental factors, only the forest line had a stable correlation with species diversity index and PD and showed a negative correlation change, indicating an
“edge effect” distribution of species diversity in the study area. In summary, the forest line was the key factor affecting the distribution of species diversity of the study area and the species relationships within the community.
Acknowledgements: We would like to thank my group for helping with the initial experimental design, field investigation, data processing, and final language edit- ing. We would also like to thank the eco313 family: Mr.
Liu Weihua, Mr. Zhao Bingqing, Mr. Song Houjuan, Mr.
Li Shuai, Mr. Zhang Qing, Mr. Tian Yixin, and Ms. Li Xingmei for their help during the field investigation and the completion of this study.
References
Bai, X.H. and J.T. Zhang. 2018. Functional diversity research of for- est communities in the Xiaowutai Mountain National Nature Reserve, Hebei. Acta. Ecol. Sin. 38:67–75.
Barak, R.S., E.W. Williams, A.L. Hipp, M.L. Bowles, G.M. Carr, R.
Sherman and D.J. Larkin. 2017. Restored tallgrass prairies have reduced phylogenetic diversity compared with remnants. J. Appl.
Ecol. 54:1080–1090.
Bi, R.C., H.G. Yang and X.J. Zhu. 2004. Study on edge effect of deciduous broad-leaved forest in warm-temperate zone of Mt.
Huoshan. Acta Bot. Boreali-Occident. Sin. 24:1441–1447.
Chen, Y. 2009. Detecting effect of phylogenetic diversity on seedling mortality in an evergreen broad-leaved forest in china. Chin. J.
Plant Ecol. 33:1084–1089.
Cheng, Z.H., J.T. Zhang, T.L. ShangGuan and F. Zhang. 2002.
Relationship between tourism development and vegetation envi- ronment in Luya Mountain nature reserve I. Quality analysis of vegetation environment. Acta Ecol. Sin. 22:1765–1773.
Chu, X.H., Y. Xie, G.L. Shan, F.J. Yuan, G. Chen and H.Y. Yin. 2017.
Effect of management patterns on community structure and spe- cies diversity of subalpine meadow of the southern margin of Tibetan Plateau. Acta Agrect. Sin. 25:939–945.
Clarke, K.P. and R.M. Warwick. 1998. A taxonomic distinctness in- dex and its statistical properties. J. Appl. Ecol. 35:523–531.
Clarke, K.P. and R.M. Warwick. 2001. A further biodiversity index applicable to species list: variation in taxonomic distinctness.
Mar. Ecol. Prog. Ser. 216:265–278.
Cronquist, A. 1984. The Classification of Flowering Plants. Columbia University Press, New York.
Cui, X.C., J.L. Hu, J.H. Wang, J.S. Yang and X.G. Lin. 2016.
Reclamation negatively influences arbuscular mycorrhizal fun- gal community structure and diversity in coastal saline-alkaline land in Eastern China as revealed by Illumina sequencing. Appl.
Soil Ecol. 98:140–149.
Dong, S.K., L. Tang, X.F. Zhang, S.L. Liu, Q.R. Liu, X.K. Su, Y.
Zhang, X.Y. Wu, Z.Z. Zhao, Y. Li and W. Sha. 2017. Relationship between plant species diversity and functional diversity in alpine grasslands. Acta Ecol. Sin. 37:1472–1483.
Dong, S.K., L. Tang, X.X. Wang, Y.H. Liu, S.L. Liu, Q.R. Liu, Y.
Wu, Y.Y. Li, X.K. Su and C. Zhao. 2013. Minimum plot size for estimating plant biodiversity of the alpine grasslands on the Qinghai-Tibetan Plateau. Biodiv. Sci. 21:651–657.
Fang, J.Y., X.P. Wang, Z.H. Shen, Z.Y. Tang, J.S. He, D. Yu, Y.
Jiang, Z.H. Wang, C.Y. Zheng, J.L. Zhu and Z.D. Guo. 2009.
Methods and protocols for plant community inventory. Biodiv.
Sci. 17:533–548.
Huang, J.X., F.Y. Zheng and X.C. Mi. 2010. Influence of environ- mental factors on phylogenetic structure at multiple spatial scales in an evergreen broad-leaved forest of China. Chin. J.
Plant Ecol. 34:309–315.
Jiang, H., J.H. Huang, L.Z. Chen, C.Y. Yang and X.Q. Yang. 1994.
DCA ordination, quantitative classification and environmental interpretation of plant communities in Dongling Mountain. Acta Bot. Sin. 36:539–551.
Li, B. 1962. The basic types of the zonal vegetation on Inner Mongolia and its ecological geographic rule. J. Inner Mongolia Univ. Nat. Sci. Ed. 4:41–74.
Li, S., J. Zhang, T.L. ShangGuan and D.G. Guo. 2015. Wetland plant taxonomic diversity in the middle reaches of the Yellow River.
Plant Sci. J. 33:775–783.
Li, S.Q., J.T. Zhang and T.L. ShangGuan. 2005. Quantitative clas- sification and ordination of the subalpine meadows in Luyashan Mountain. Acta Bot. Boreali-Occident. Sin. 25:2062–2067.
Li, Z. 2015. Phylogenetic Structure, Numerical Classification and Ordination of Mixed Broadleaf-Conifer Forest Communities along the Elevation Gradient in Meili Snow Mountain. Master’s Thesis, Yunnan University, Kunming, Yunnan.
Liu, Y. 2010. Patterns of Above- and Belowground Biodiversity of Alpine Timberline Ecotone and Forest-Meadow Ecotone in Western Sichuan. PhD Thesis, Sichuan Agricultural University, Chengdu, Sichuan.
Liu, Y.H., W.D. Wei, Y.W. Yang and Y. Zhang. 2018. Redundancy analysis on relationships between grassland vegetation and soil factors on degraded alpine meadow. Acta Agric. Boreali- Occident. Sin. 27:480–490.
Ma, K.P., J.H. Huang, S.L. Yu and L.Z. Chen. 1995. Plant commu- nity diversity in Dongling Mountain, Beijing, China:Ⅱ. spe- cies richness, evenness and species diversities. Acta Ecol. Sin.
15:268–277.
Ma, X.Y., T.L. ShangGuan and J.Z. Pang. 2004. Study on the niche of dominate populations of the forest community in Taiyue Mountains, Shanxi. J. Shanxi Univ. Nat. Sci. Ed. 27:209–212.
Ma, Z.Q., T.L. ShangGuan and C.Q. Teng. 2001. Vegetation in Shanxi. Science and Technology of China Press, Beijing.
Mouillot, D., W. Mason and O. Dumay. 2005. Functional regularity:
a neglected aspect of functional diversity. Oecologia 142:353–
359.
Niu, H.Y., Z.F. Wang, J.Y. Lian, W.H. Ye and H. Shen. 2011. New progress in community assembly: community phylogenetic structure combining evolution and ecology. Biodiv. Sci. 19:275–
283.
Niu, Y.J., J.W. Zhou, S.W. Yang, G.Z. Wang, L. Liu and L.M. Hua.
2017. Quantitative apportionment of slope aspect and altitude to soil moisture and temperature and plant distribution on alpine meadow. Chin. J. Appl. Ecol. 28:1489–1497.
Qin, X.J., G. Dong, Y.L. Deng, K. Mao, X.H. Li and F. Zhang. 2015.
Plant taxonomic diversity in Yellow River Wetland in Pinglu, Shanxi. Acta Ecol. Sin. 35:409–415.
Qu, C.M., X.G. Han and B. Su. 2000. Edge effects in fragmented forests: implications for design and management of natural re- serves. Acta Ecol. Sin. 20:160–167.
Qu, G.P., M.Y. Can, J.X. Zhao, X.P. Chen, T. Zhang and Y.F. Bai.
2015. Quantitative ecology and species diversity of the vegeta- tion in southeast slope of the Nyenchentanglha Mountain. Ecol.
Environ. Sci. 24:1618–1624.
Roberts, D.W. and S.V. Cooper. 1989. Concepts and techniques of vegetation mapping. In: D. Ferguson, P. Morgan and F.D. Johnson (eds), Land Classifications Based on Vegetation: Applications for Resource Management. General Technical Report INF–257. The U.S. Department of Agriculture, Forest Service, Intermountain Research Station, Ogden, Utah. pp. 90–96.
Schleuter, D., M. Daufresne and F. Massol. 2010. A user’s guide to functional diversity indices. Ecol. Monogr. 80:469–484.
ShangGuan, T.L. and F. Zhang. 1989. On synecological features and biomass of Ostryopsis davidiana bush-wood in Yunding Mountain, Shanxi Province. J. Shanxi Univ. Nat. Sci. Ed.
12:347–352.
Shao, D. 2014. Vegetation Diversity in Yunmeng Mountain National Forest Park. Master’s Thesis, Beijing Normal University, Beijing.
204 Bai et al.
Song, A.Y. 2005. Community Character and Eco-hydrological Function of Subalpine Meadow in Wolong Nature Reserve.
Master Thesis, Chinese Academy of Forestry, Beijing.
Wang, F., C.Y. Tu, X.W. Cao, J.Q. Liu, Y.H. Yang, T. Zhang and H.
Qi. 2018. The different altitude gradient change rules of the main shrub community in arid valleys of the Bailongjiang River with different slope. Bull. Bot. Res. 38:26–36.
Webb, C.O., D.D. Ackerly and S.W. Kembel. 2008. Phylocom: soft- ware for the analysis of phylogenetic community structure and trait evolution. Bioinformatics 24:2098–2100.
Wu, J.Z., T.L. ShangGuan, J. Zhang, J.C. Li, T.W. Cao and J.Y. Yue.
2007. Disturbing effects of tourism on plant species diversity of Malun subalpine meadow, Shanxi Province. J. Mt. Sci. 25:534–
540.
Wu, X.G., J.P. Guo, X.P. Tian and X.Y. Yang. 2013. Spatial hetero- geneity of soil organic carbon and total nitrogen at small scale in subalpine meadow and Picea meyeri forest in Luya Mountain.
Acta Ecol. Sin. 33:7756–7764.
Wu, Z.Y. 1980. Vegetation in China. Science Press, Beijing.
Xiao, Y.M., L.C. Yang, X.Q. Nie, C.B. Li, F. Xiong, X.H. Zhao and G.Y. Zhou. 2018. Phylogenetic structure of desert shrub com- munity in Qaidam Basin. Acta Bot. Boreali-Occident. Sin.
38:750–760.
Xu, M.H. and X. Xu. 2013. A research on summer vegetation char- acteristics & short-time responses to experimental warming of alpine meadow in the Qinghai-Tibetan Plateau. Acta Ecol. Sin.
33:2071–2083
Xu, Q., R.C. Bi, Q.D. Zhang, Y.M. Miao, J. Qin and X.N. Liu. 2014.
Dynamic patterns of species diversity in gaps of Larix principis
rupprechtii plantation in Pangquangou in Shanxi Province, China. Chin. J. Ecol. 33:2913–2920.
Xue, Q.N., M. Yan and R.C. Bi. 2015. Functional diversity research of tree and shrub layers in forest communities of the Wulu Mountains Nature Reserve in Shanxi, China. Acta Ecol. Sin.
35:7023–7032.
Yuan, Y., Z.Q. Zhao, Z.K. Bai, H.Q. Wang, Z.G. Xu and S.Y. Niu.
2016. Niche characteristics of dominant herbaceous species under different land reclamation patterns in Antaibao Opencast Coal Mine. Chin. J. Ecol. 35:3215–3222.
Zhang, J., Z.Q. Hao, B. Song, B.H. Li, X.G. Wang and J. Ye. 2009.
Fine-scale species co-occurrence patterns in an old-growth tem- perate forest. Forest Ecol. Manag. 257:2115–2120.
Zhang, J.T. 2005. Two-dimensional pattern analysis for dominant species and community in mountain meadow of Luya Mountain, Shanxi Province, China. Acta Ecol. Sin. 25:1264–1268.
Zhang, J.T. 2011. Quantitative Ecology. 2nd ed. Science and Technology Press, Beijing.
Zhang, J.T. and L.H. Fan. 2011. Development of species functional diversity and its measurement methods. J. Mt. Sci. 29:513–519.
Zhao, M.F., K.X. Xing, Y.H. Wang, G.Y. Wang, F. Xue, W.Y. Zuo and M.Y. Kang. 2017. Patterns and determinants of beta diversity in the understory vegetation layers of montane boreal conifer forest in Luya Mountain. Acta Ecol. Sin. 37:3327–3334.
Received November 11, 2018 Revised December 24, 2018 Accepted June 3, 2019
Appendix Table A1. List of herbaceous species in the study area.
No. Species name No. Species name
1 Plantago asiatica 27 Carum carvi
2 Gentiana macrophylla 28 Alchemilla japonica
3 Sanguisorba officinalis 29 Thalictrum alpinum
4 Stellaria media 30 Pedicularis chinensis
5 Aster alpinus 31 Polygonum viviparum
6 Cleistogenes caespitosa 32 Saussurea purpurascens
7 Leontopodium roseum 33 Pedicularis sfriata
8 Rhodiola rosea 34 Papaver nudicaule
9 Draba eriopoda 35 Primula maximowiczii
10 Commelina diffusa 36 Ranunculus chinensis
11 Oxytropis coerulea 37 Potentilla discolor
12 Gentiana squarrosa 38 Festuca rubra
13 Anaphalis hancockii 39 Agrimonia pilosa
14 Delphinium grandiflorum 40 Rhodiola dumulosa
15 Ranunculus japonicus 41 Silene jenisseensis
16 Carex lancifolia 42 Dracocephalum rupestre
17 Arctium lappa 43 Cardamine tangutorum
18 Taraxacum borealisinense 44 Trigonotis peduncularis
19 Polygonum bistorta 45 Viola orientalis
20 Kobresia myosuroides 46 Cortusa matthioli
21 Potentilla chinensis 47 Androsace umbellata
22 Primula tibetica 48 Acorus tatarinowii
23 Silene himalayensis 49 Ligularia sibirica
24 Androsace gmelinii 50 Echinops przewalskii
25 Potentilla nivea 51 Primula sinensis
26 Lagotis integrifolia