1 The original published PDF available in this website:
1
https://www.sciencedirect.com/science/article/pii/S1470160X19303462?via%3Dihub 2
3
For: Ecological Indicators 4
5 6 7
The effect of urbanization on freshwater macroinvertebrates - Knowledge gaps and future research 8
directions 9
10
Blanka Gál1,*, Ildikó Szivák1,2, Jani Heino3, Dénes Schmera1,2 11
12
1MTA Centre for Ecological Research, Balaton Limnological Institute, Klebelsberg K. u. 3, H- 13
8392 Tihany, Hungary 14
2MTA Centre for Ecological Research, GINOP Sustainable Ecosystem Group, Klebelsberg K. u.
15
3, H-8392 Tihany, Hungary 16
3Finnish Environment Institute, Freshwater Centre, Paavo Havaksen Ti 3, FI-90570 Oulu, 17
Finland.
18
*Correspondence: gal.blanka@okologia.mta.hu 19
20 21
Abstract 22
23
Understanding the effects of urbanization on the diversity of freshwater macroinvertebrates is an 24
important topic of biodiversity research and has direct conservation relevance. The absence of 25
evidence-based systematic overviews on this topic motivated us to perform meta-analyses and to 26
synthetize the present state of knowledge. We observed significant heterogeneity among individual 27
case studies, reporting negative, neutral and positive effects. As expected, urbanization had an 28
overall negative effect on the diversity of freshwater macroinvertebrates. These results are based 29
mainly on the study of lotic (stream and river) ecosystems because there are insufficient data 30
available for lentic (pond and lake) ecosystems. Compared to individual case studies, the present 31
review reports an evidence-based synthesis for the first time. We identified knowledge gaps 32
regarding case studies reporting the effects of urbanization on pond and lake ecosystems, case 33
studies examining the phylogenetic and functional facets of biodiversity, as well case studies 34
investigating the effect of urbanization on the beta diversity component of macroinvertebrate 35
communities. The identification of these knowledge gaps allowed us to make recommendations for 36
future research: (1) report results on specific taxonomic groups and not only the entire 37
macroinvertebrate community, (2) study the impacts of urbanization on macroinvertebrate diversity 38
in different habitat types and understudied continents, (3) focus on the functional and phylogenetic 39
facets of diversity and (4) examine the influence of spatial scale on biodiversity (e.g. beta diversity) in 40
urban freshwater ecosystems. Our results also suggested that the analysis of diversity- environment 41
relationships is crucial for developing macroinvertebrate indicators especially in the increasingly 42
urbanized world.
43 44 45
2 Keywords
46 47
aquatic invertebrates, biodiversity, effect of urbanization, freshwater ecosystems, systematic review 48
49 50
1. Introduction 51
52
Sixty-eight percent of the global population is expected to live in cities by 2050, and the most 53
urbanized regions are North America(with 82% of its population living in urban areas in 2018), Latin 54
America and the Caribbean(81%), and Europe(74%). At the same time, individual cities are also 55
growing in the developing world, resulting in new megacities (UNDESA, 2018). The proliferation of 56
densely-settled areas from the coastal zone to the upstream regions, including mega-cities, means 57
that many rivers are highly threatened over virtually their entire length (Vörösmarty et al., 2010).
58
These freshwater systems have been modified throughout human history to serve humankind, 59
including land cover change, urbanization and industrial purposes. In addition, we have been tireless 60
advocates for expanding the access to the water for many uses and services. Because of the varied 61
economic benefits of the water, it is a challenge to balance between societal and ecological needs 62
(Geist and Hawkins, 2016).
63 64
Urbanization alters the physical and chemical environment of rivers, streams (Allan, 2004), lakes and 65
ponds (Heino et al., 2017). The increased impervious cover changes hydrology with frequent and 66
large flow events, while runoffs increase the concentration of sediments, nutrients and chemical 67
pollutants in lotic ecosystems. Such modifications can alter channel morphology and stability, 68
resulting in an altered sediment supply and flow regime. The combination of these changes creates 69
the “urban stream syndrome”, leading to low biotic diversity and altered community structure 70
(Meyer et al., 2005; Paul and Meyer, 2001; Walsh et al., 2005). Similar responses may be found in 71
urban ponds, which are systems that harbor high-levels of biodiversity, despite being small and 72
scattered in the landscape. Whereas previous works indicated biotic homogenization and an overall 73
decline in biological richness of urban ponds and lakes by reason of nutrient enrichment, habitat 74
modification (Mcgoff et al., 2013) and shoreline development (Brauns et al., 2007), recent findings do 75
not follow the same patterns and provide some contrast with these results in the case of ponds 76
(Hassall and Anderson, 2015; Hill et al., 2016a). Moreover, the effect of the local physical or chemical 77
factors and the degree of connectivity show stronger influence upon lentic systems’ biological 78
diversity than the land use gradients (Hill et al., 2016b; Thornhill et al., 2018). Finally, wetlands might 79
also be severely impacted by urbanization. The knowledge of this effect might guide both local 80
management of wetlands and conservation strategies at the watershed or regional scale to benefit 81
biodiversity of wetlands (Bried et al., 2016; Meyer et al., 2015).
82 83
Understanding biodiversity change associated with anthropogenic impacts is crucial to ecologists, 84
and it will be essential for the future success of conservation decisions. Biodiversity, however, can be 85
expressed in multiple ways. Several diversity studies have used taxonomic approaches based on 86
species occurrence, abundance or biomass. Such taxonomic diversity measures treat taxa as being 87
equally distinct from one other and disregard the fact that communities are composed of species 88
with different evolutionary histories and a diverse array of ecological functions (Cardoso et al., 2014).
89
Phylogenetic diversity provides interpretation of the evolutionary relationships among members of a 90
community based on their evolutionary history (Cadotte et al., 2010). Recently, quantitative diversity 91
measures have been developed that use functional traits because they are likely to provide more 92
information about the biodiversity-ecosystem function relationships (Gagic et al., 2015). Additionally, 93
communities in two regions can differ taxonomically but still be similar functionally; thus, functional 94
3
diversity can be more geographically robust and transferable. Functional traits are measurable 95
characteristics of the organism which define the ecological roles of the species, and functional 96
diversity quantifies the variability or diversity of these functional traits in a community (Schmera et 97
al., 2017). In other words, functional diversity includes those components of biodiversity that 98
influence how an ecosystem operates or functions (Tilman, 1997). Although functional diversity is a 99
promising concept in understanding the functional aspect of biodiversity, functional trait-based 100
approaches are still relatively infrequently applied in comparison to the traditional taxonomic 101
diversity measures (Weigel et al., 2015; Alahuhta et al., in press).This pattern is also the same in the 102
urbanization-related studies. In sum, we can distinguish taxonomic, functional and phylogenetic 103
facets of biodiversity, all of which should be addressed in urban biodiversity studies.
104 105
Many studies investigating biodiversity change have been conducted at relatively small spatial scales, 106
generally considered at the local scale (Thompson et al., 2018). However, the spatial patterns of 107
species diversity observed at the local scale may be different from the regional and landscape scales 108
(Heino, 2011). The important effect of spatial scale on biodiversity variation has long been identified 109
(Beever et al., 2006). Taking this into consideration, we can distinguish diversity that occurs within 110
observation unit (α-diversity), among observation units (β-diversity) and total diversity components 111
(γ-diversity) (Whittaker, 1960). Alpha diversity represents the average amount of diversity among 112
samples, indicating the finest scale of sampling. Gamma diversity is the total species diversity of 113
observation units as the set of samples from a single habitat, landscape or region. Finally, beta 114
diversity can be defined as the variation in assemblage composition among sampling units or the 115
extent of change in assemblage composition along gradients (Anderson et al., 2011) and can be 116
calculated as the difference between the gamma and alpha diversity components (Crist and Veech, 117
2006) (Table 1). Despite the important influence of spatial scale on biodiversity (i.e. alpha, beta, 118
gamma components), it has only recently begun to gain broader interest in ecological studies (Crist et 119
al., 2003; Heino, 2011). Thus, it can also be assumed that urbanization influences both within-site 120
(alpha), regional (gamma) and among-sites (beta) diversity components.
121 122
Macroinvertebrates (i.e. invertebrate animals > 0.25 mm in length; Rosenberg & Resh, 1993) play an 123
important role in freshwater ecosystems by feeding on various food resources (e.g. algae, coarse 124
detritus or fine particulate organic matter), by ecosystem engineering (Mermillod-Blondin, 2011), as 125
well as by providing food for higher trophic levels (Covich et al., 1999; Nery and Schmera, 2016).
126
Therefore, macroinvertebrates contribute to several ecosystem services as herbivores, predators or 127
detritivores. Freshwater macroinvertebrate communities are widely used in biomonitoring and 128
bioassessment because they show predictable responses to water quality (e.g. Alvarez-Mieles et al., 129
2013; Azrina et al., 2006; Gonzalo and Camargo, 2013), hydro-morphological and riparian habitat 130
degradation (e.g. Beavan et al., 2001; Davies et al., 2010; Rios and Bailey, 2006), in terms of the 131
structural and functional parameters of macroinvertebrate communities (Bonada et al., 2006; Li et 132
al., 2019). Many studies have demonstrated that aquatic insects like mayflies (Ephemereoptera), 133
stoneflies (Plecoptera) and caddisflies (Trichoptera) (EPT) are good biological indicators due their 134
high sensitivity to anthropogenic stressors (Hauer and Lamberti, 2007). Some families of beetles 135
(Coleoptera) and true bugs (Hemiptera), especially those using plastrons or bubbles for breathing, 136
are also sensitive to water pollution and habitat degradation, whereas most true flies and midges 137
(Diptera) are opportunists and also colonize polluted water (Tchakonté et al., 2015). In general, 138
narrative reviews and individual case studies suggest that urbanization results in a reduction of 139
richness and abundance of intolerant taxa, and that urban areas are characterized by species-poor 140
assemblages composed of disturbance-tolerant taxa (Allan, 2004; Cuffney et al., 2010; Walsh et al., 141
2005). All of these studies emphasize the importance of the diversity-environment relationship in 142
4
developing macroinvertebrate indicators in the urban realm. However, we did not find any 143
systematic overview on whether urbanization influences the diversity of freshwater 144
macroinvertebrates, and which facets (taxonomic, functional or phylogenetic) and components 145
(alpha or beta) are generally impacted.
146 147
The objective of the present study was to assess the effect of urbanization on freshwater 148
macroinvertebrate diversity. To address this issue, we performed a systematic review along with a 149
meta-analysis. The present review focuses on the following questions: (i) Which taxonomic groups 150
have been examined when studying the effect of urbanization on macroinvertebrate diversity? (ii) 151
How is diversity conceptualized (i.e. which diversity facets and components are the foci in a study) 152
and measured in these studies? (iii) Which habitat types are examined? (iv) Does urbanization 153
influence, in general, the diversity of freshwater macroinvertebrates?
154 155 156
2. Methods 157
158
2.1 Literature search 159
160
On 16th of November 2017, we performed a literature search in ISI Science Citation Index Expanded 161
database from 1975 to 2016 with the following combination of relevant keywords: ("*diversity*" OR 162
"*richness*") AND ("*macroinvertebrate*" OR "*aquatic invertebrate*") AND ("*urbanization*" OR 163
"*urbanisation*"). This search resulted in 197 papers. Each paper was read carefully to search for 164
outcomes on how urbanization influences the diversity of freshwater macroinvertebrate 165
assemblages. We searched for studies (a piece of scientific work for a particular purpose) reporting 166
contrast between the diversity of macroinvertebrates under natural and urban areas (contrast 167
outcomes), and for studies quantifying the direction and strength of association between 168
urbanization and macroinvertebrate diversity (correlative outcomes). We thus distinguished two 169
outcome types: contrast and correlative ones. We considered an outcome as a contrast outcome 170
when the mean value, the variation (expressed as standard error, standard deviation or confidence 171
interval), as well as the sample size were provided (in a form of text, figure, table or appendix). We 172
considered an outcome as a correlative outcome when both the correlation coefficient and the 173
sample size were given. We recorded taxonomic group (e.g. Decapoda, aquatic insects or 174
macroinvertebrates), habitat (e.g. stream, pond or lake), the facet (taxonomic, functional or 175
phylogenetic) and component (alpha or beta) of diversity from the studies. This search resulted in 27 176
publications, 31 studies and 74 outcomes.
177 178
We excluded records when outcomes originated from non-independent observations (i.e. standard 179
error of pairwise beta diversity was quantified based on permutation-based methodology instead of 180
independent observations see Gimenez et al., 2015 ), or when the variation was obviously 181
inadequately assessed (zero standard error for none-zero mean at sample size 3, see Zhang et al., 182
2012). Furthermore, we deleted records on subgroups if outcomes on entire (or an extended) 183
assemblage was also reported. This means that outcomes for EPT richness were not considered if 184
outcomes on the richness of the entire macroinvertebrate assemblages were also reported. In sum, 185
our search resulted in 27 publications (Electronic Supplementary Material 1), 31 studies and 61 186
outcomes. Using this eligibility dataset, we examined the studied taxonomic groups as well as the 187
methodology used for macroinvertebrate diversity assessment.
188 189
5 190
2.2 Data synthesis 191
192
Some studies reported multiple outcomes (e.g. both taxa richness and Shannon diversity were given).
193
In order to ensure the independence of outcomes within the same study, we kept only the most 194
frequently-used measure (if both taxon richness and Shannon diversity was provided then we kept 195
only taxa richness). When multiple seasons were studied then we selected only a single one (with the 196
assumed highest diversity). This resulted in 27 papers, 31 studies and 32 outcomes (a single study 197
reported both alpha and beta diversities, which we considered to be independent, see Chao et al., 198
2012 for more details). Using this final dataset, we examined the influence of urbanization on the 199
diversity of freshwater macroinvertebrates in the meta-analyses.
200 201
We calculated Hedges' g (Hedges, 1981) as a measure of effect size for contrast outcomes, while we 202
used Pearson correlation for correlative outcomes. To get an overall result, Pearson correlations 203
were transformed to Hedges' g following (Borenstein et al., 2009). We found significant 204
heterogeneity among studies (see Results section), and thus we fitted random effect models. Our 205
data set did not allow us to test how habitat (only a single outcome reported on ponds while the rest 206
focused on streams) or diversity component (only a single outcome reported on beta diversity while 207
the rest on alpha diversity) influence the effect of urbanization on freshwater macroinvertebrate 208
diversity. We therefore examined only the effect of output type (contrast vs. correlative outcomes) in 209
three steps. First, we applied a random effect model where all outcomes were considered together.
210
In the second step, contrast and correlative outcomes were examined separately in random effect 211
models. Finally, in the third step, we fitted a random effect model containing a moderator (output 212
type, i.e. contrast outcome or correlative outcome) called as mixed effect model (Batáry et al., 2011;
213
Borenstein et al., 2009).
214 215 216
2.3 Assessing publication bias 217
218
Studies finding significant effect are more likely to be published than studies finding no effect. This 219
issue is generally known as publication bias. Unfortunately, publication bias might influence the 220
outcome of meta-analyses. To consider publication bias we applied two independent approaches: (1) 221
the Rosenthal method, and (2) the trim and fill methods. The Rosenthal method (Rosenthal, 1979) 222
calculates the number of non-significant studies that need to be added to a summary analysis in 223
order to change the results from significant to non-significant (Batáry et al., 2011). The observed 224
patterns are robust if the number of non-significant studies is greater than 5n+10, where n is the 225
original number of studies (Rosenthal, 1991). The trim and fill method (Duval and Tweedie, 2000a, 226
2000b) augments the observed data so that the effect of potentially missing outcomes (provided by 227
the methodology) are incorporated. Then, the method recalculates the summary statistic. If the 228
output agrees with the original conclusion then the inclusion of potentially missing outcomes would 229
not influence our conclusion. All analyses were performed using R (R Core Team, 2017) using the 230
package metafor (Viechtbauer, 2010).
231 232 233
3. Results 234
235
3.1 Methodology of diversity measurement 236
237
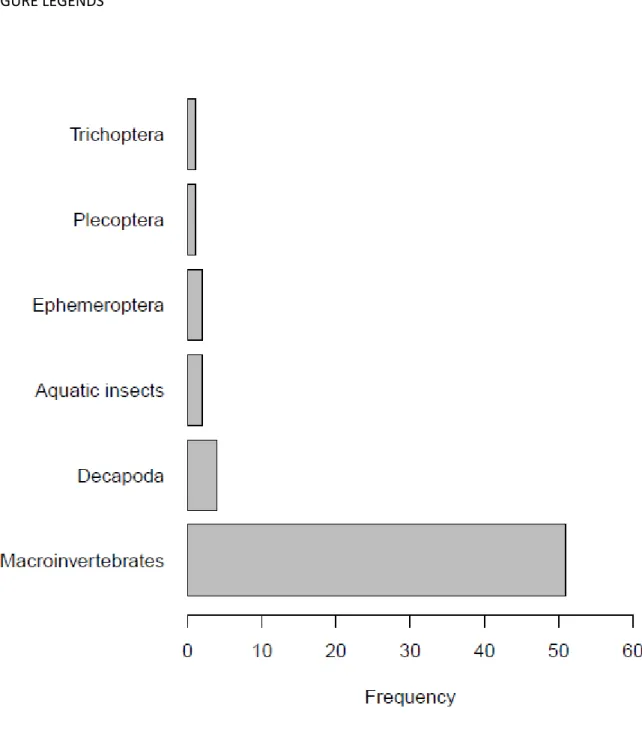
6
Macroinvertebrates were mostly represented as an entire group, while exclusively a subset of them 238
is only sporadically used in our eligibility dataset (Fig. 1). Regarding habitats, most findings were 239
based on studying the diversity of stream communities (55 of 61, 90.2%). The diversity of pond 240
communities was rarely studied (6 of 61, 9.8%) and that of lake communities were completely 241
ignored (0.0%). The selected outcomes focused exclusively (61 of 61) on the taxonomic facet of 242
macroinvertebrate diversity and, thus, functional and phylogenetic aspects were totally ignored.
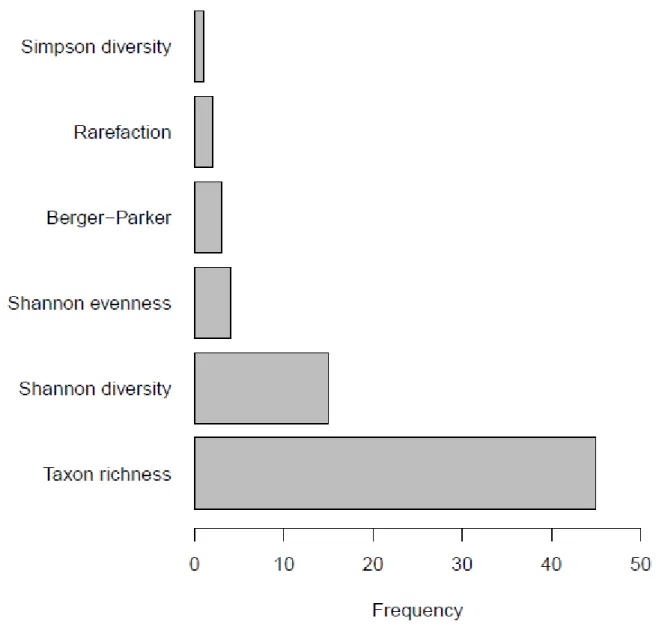
243
Most of the outcomes focused on alpha diversity (95.0%, 58 outcomes) and only a relatively small 244
proportion examined beta diversity (3 outcomes). Taxon diversity was the most frequently used 245
measure of alpha diversity (Fig. 2), while Jaccard dissimilarity was the exclusive measure of beta 246
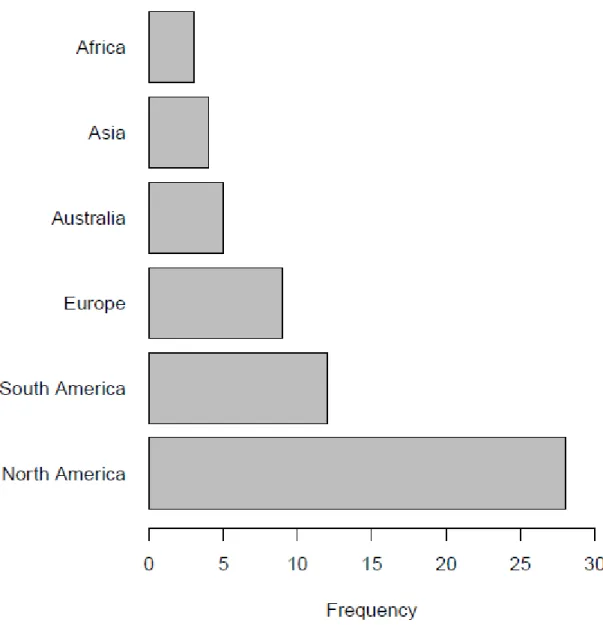
diversity. Finally, we found that most outcomes originate from North America, South America and 247
Europe, while Australia, Asia as well as Africa were less well represented (Fig. 3).
248 249 250
3.2. Effect of urbanization on freshwater macroinvertebrate diversity 251
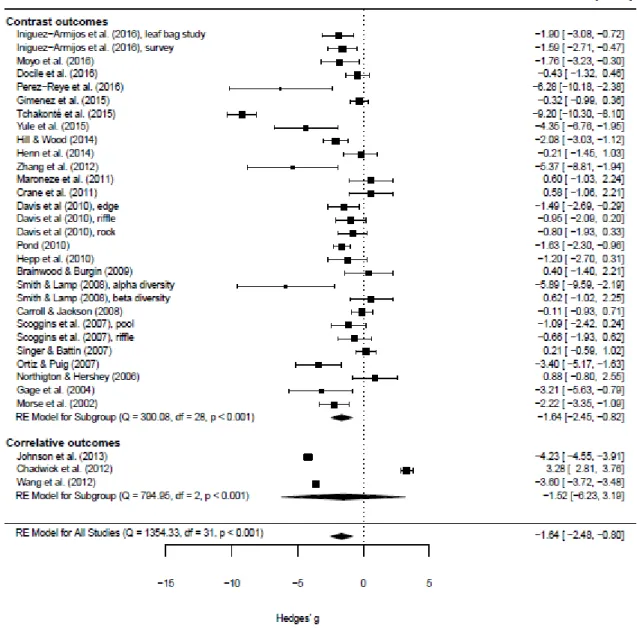
252
We identified 29 contrast and 3 correlative outcomes in our final data set. When all outcomes were 253
considered together, urbanization had a significant negative effect on macroinvertebrate diversity 254
(Hedges' g = -1.643, s.e. = 0.429, z = -3.33, P < 0.001, lower bound of the confidence interval [ci.lb] = - 255
2.483, upper bound of the confidence interval [ci.ub] = -0.803, Fig. 3). When only contrast outcomes 256
were considered, the effect of urbanization was significantly negative (estimate Hedges' g = -1.636, 257
s.e. = 0.416, z = -3.926, P < 0.001, ci.lb = -2.453, ci.ub = -0.819, Fig. 3), and when only correlative 258
outcomes, the effect was negative but not significant (estimate Hedges' g = -1.518, s.e. = 2.403, z = - 259
0.632, P = 0.528, ci.lb = -6.229, ci.ub = 3.192, Fig. 3). This non-significantly negative effect was caused 260
by two outcomes reporting significantly negative, and one outcome reporting significantly positive 261
effect of urbanization (Fig. 3). Finally, when outcome type was considered as a moderator (mixed 262
effect model), then the intercept of the statistical model (that coincides with contrast outcome type) 263
was significantly negative (Hedges' g = -1.661, s.e. = 0.461, z = -3.599, P < 0.001, ci.lb = -2.565, ci.up = 264
-0.756), and there was no significant difference between outcome types (Hedges' g = 0.134, s.e. = 265
1.430, z = 0.094, P = 0.925, ci.lb = -2.668, ci.up = 2.937 for correlative outcome type), suggesting that 266
there was no difference in the effect of urbanization due to outcome type.
267 268 269
3.3 Considering publication bias 270
271
The Rosenthal method indicated that 6758 outcomes should be incorporated into our analyses in 272
order to change our significant results to non-significant. This value is much higher than the 273
threshold value (170) suggesting that the conclusion drawn is robust enough. The trim and fill 274
method showed that even when 3 missing outcomes would be added to our data set, the effect of 275
urbanization on macroinvertebrate diversity would still be significantly negative (Hedges' g = -2.001, 276
s.e. = 0.445, z = -4.509, P < 0.001, ci.lb = -2.877, ci.ub = -1.134; Electronic Supplementary Material 2).
277 278 279
4. Discussion 280
281
Understanding the effects of urbanization on the diversity of freshwater macroinvertebrates is an 282
important topic of biodiversity research that can serve as the basis for developing 283
macroinvertebrate-based indicators and that has considerable conservation relevance. The absence 284
of evidence-based systematic overview on this topic motivated us to perform meta-analyses and to 285
7
synthetize the present state of knowledge. We found that urbanization had an overall negative effect 286
on the diversity of freshwater macroinvertebrates. This finding is in compliance with the “urban 287
stream syndrome” described by Meyer et al., (2005) and is in agreement with the majority of the 288
published case studies. Compared to individual case studies, however, the present paper is the first 289
that reports a statistical-based synthesis on this topic.
290 291
The majority of the case studies in our eligibility data set investigated only entire macroinvertebrate 292
communities, some examined both entire communities and specific taxonomic groups (e.g.
293
Ephemeroptera, Plecoptera and Trichoptera), and finally a limited number of case studies focused 294
only on specific taxonomic groups. The consequence of these differences is that we can synthetize 295
information only on entire macroinvertebrate communities, but our synthetic knowledge on how 296
urbanization influences the diversity of individual taxonomic groups is missing. Such information 297
would obviously be important not only for the specialists of particular taxonomic groups, but also for 298
a deeper understanding of the response of entire macroinvertebrate community. Literature evidence 299
suggests that different taxonomic groups (e.g. Ephemeroptera, Plecoptera, Trichoptera, Coleoptera 300
or Hemiptera) respond differently to the effect of urbanization (Compin and Céréghino, 2007;
301
Sánchez-Fernández et al., 2006; Tchakonté et al., 2015) and thus further studies are clearly required.
302 303
Regarding the habitats studied, most outcomes reported case studies on lotic systems and 304
sporadically on ponds, while lakes were completely ignored. These findings suggest that our general 305
conclusion is heavily based on stream studies, and there is a knowledge gap on how urbanization 306
influences macroinvertebrate diversity in pond and lake habitats. We cannot provide a clear 307
explanation for the overrepresentation of stream studies, but a similar bias was found in functional 308
diversity research (Schmera et al., 2017). A possible explanation might be that the comparison of lake 309
communities under clear natural and urban conditions could be challenging (e.g. because of the lack 310
of adequate sampling sites). Despite the conservation importance of urban ponds (Oertli et al., 311
2005), this habitat type has been mostly ignored by freshwater ecologists (Céréghino et al., 2008) 312
until recently (Heino et al., 2017; Hill et al., 2017). It should also be noted that we did not find any 313
study of wetlands, despite the fact wetlands are ecologically important systems and increasingly 314
threatened by urbanization. Based on our results, well-documented case studies are needed in lake, 315
pond and wetland habitats for the comprehensive interpretation of the effect of urbanization on 316
freshwater macroinvertebrate diversity.
317 318
Regarding the continents, most of the outcomes in our eligibility data set were originated from 319
America (both from North and South America), whereas Africa, Asia and Australia are clearly 320
underrepresented (Fig. 3). This virtual lack of studies might bias our synthesis and should give an 321
incentive to research the effect of urbanization on freshwater macroinvertebrate diversity on the 322
little-studied continents.
323 324
Our systematic review showed that the identified negative effect of urbanization was based 325
exclusively on the taxonomic facet of macroinvertebrate diversity and, thus, functional and 326
phylogenetic aspects were totally ignored. We did not identify any case study which takes functional 327
or phylogenetic diversity into consideration. Obviously, the use of the taxonomic facet alone has 328
considerable limitation for the comprehensive assessment of the response of biodiversity to 329
urbanization (Tanaka and Sato, 2015). This finding highlights a notable deficiency that needs to be 330
addressed urgently in the future, since human impacts are assumed to affect the functional trait 331
composition of macroinvertebrate assemblages (Flynn et al., 2009; Schmera et al., 2017; Vandewalle 332
et al., 2010). Thus, such information might also be essential for conservation practice (Perronne, 333
8
2014), especially due to the possible mismatch of these diversity facets (Devictor et al., 2010; Heino 334
and Tolonen, 2017).
335 336
We found that the detected negative effect of urbanization on macroinvertebrate diversity was 337
based almost exclusively on local (alpha) component, while among-sites (beta) component has been 338
virtually ignored. It is known, however, that human-impacted ecosystems might suffer beta-diversity 339
decline (Passy and Blanchet, 2007), and thus the investigation of the among-site spatial component 340
of diversity would be an urgent task in urban freshwater ecosystems. The examination of 341
urbanization’s influence on beta diversity would be more important in headwater stream systems, 342
where alpha diversity is generally low, although the well-known high beta diversity could generate 343
high gamma diversity (Clarke et al., 2008; Heino et al., 2003). In contrast, in the case of urban ponds, 344
both the alpha and gamma diversities might be relatively high due the already degraded state of the 345
non-urban ponds and the management in the cities which may promote high diversity (Hill et al., 346
2016a). Moreover, urbanization modifies aquatic habitats with different intensity, which increases 347
the heterogeneity of environmental conditions (Barboza et al., 2015), thereby influencing beta 348
diversity (Specziár et al., 2018). Therefore, the assessment of urbanization’s influence on beta 349
diversity is beneficial for determining priority urban conservation areas and potentially degraded 350
sites (Barboza et al., 2015). Our results suggest that there is a need for a further exploration of the 351
urbanization-related mechanisms which might affect the diversity of freshwater macroinvertebrate 352
assemblages.
353 354
Our results clearly indicated some knowledge gaps on how urbanization impacts macroinvertebrate 355
diversity. To deal with these issues, we proposed some recommendations (Table 2). In short, our 356
research field would benefit from the study of the effect of urbanization on the individual taxonomic 357
groups. We identified that the investigation of lentic ecosystems (ponds, lakes) and wetlands are 358
marginal, and that some continents are extremely underrepresented in urban studies. Additionally, 359
our study revealed a serious deficiency on the investigation of functional and phylogenetic diversity 360
facets, as well as the study of among-site (beta) diversity component in urban freshwater 361
ecosystems. All of these findings suggest that information on the effect of urbanization on 362
macroinvertebrate diversity is superficial.
363 364
Our statistical models showed that the overall negative effect of urbanization was associated with a 365
significant heterogeneity (expressed as Q, see also Fig. 4), suggesting that effect sizes (Hedges' g) 366
were more heterogeneous than expected based on sampling error. Therefore, the mixed effect 367
model provided the most adequate synthesis of the examined case studies and heterogeneity should 368
deserve special attention. Interestingly, a single case study indicated a significant positive effect of 369
urbanization on macroinvertebrate diversity (Chadwick et al., 2012). In the study of Chadwick et al.
370
(2012), the examined coastal plain streams as a natural habitat typically have low biodiversity of 371
macroinvertebrates, especially lack of Ephemeroptera, Plecoptera and Trichoptera taxa. Moreover, 372
tidal influence causes lower dissolved oxygen and finer sediment as a natural stressor that masks 373
urbanization effects. Several studies showed that freshwater ecosystems, and especially streams, are 374
dynamic systems with remarkable environmental and biological heterogeneity (Palmer et al., 2010;
375
Vinson and Hawkins, 1998). We found that this heterogeneity can also be observed when the effect 376
of urbanization on macroinvertebrate diversity is estimated.
377 378
A meta-analysis can yield a mathematically accurate synthesis of the case studies included in the 379
analysis. However, if these studies are a biased sample of all relevant studies, then the mean effect 380
computed by the meta-analysis will reflect this bias (Borenstein et al., 2009). We considered 381
9
publication bias using two independent approaches and found that our conclusions are robust 382
enough. However, our systematic review identified knowledge gaps regarding the studied habitat 383
types (lentic systems), the reported facets (functional and phylogenetic) and components (beta) of 384
diversity.
385 386
To conclude, the present paper reports the first evidence-based synthesis on how urbanization 387
influences the diversity of freshwater macroinvertebrates. We found that urbanization had an overall 388
negative effect on macroinvertebrate diversity. Our systematic review also showed that the 389
knowledge on how urbanization impacts the diversity of freshwater macroinvertebrates is rather 390
deficient, and thus further studies are needed for a more comprehensive understanding of the topic.
391
As a contribution from our study, we made recommendations for the future research topics (Table 392
2).
393 394 395
Acknowledgements 396
397
This work was supported by the GINOP 2.3.3-15-2016-00019 and OTKA K128496 grants.
398 399 400
References 401
Alahuhta, J., Erős, T., Kärnä, O.-M., Soininen, J., Wang, J. & Heino, J., 2019. Understanding 402
environmental change through the lens of trait-based, functional and phylogenetic biodiversity 403
in freshwater ecosystems. Environmental Reviews, in press.
404
Allan, J.D., 2004. Landscapes and Riverscapes : The Influence of Land Use on Stream Ecosystems.
405
Annu. Rev. Ecol. Evol. Syst. 35, 257–284.
406
https://doi.org/https://doi.org/10.1146/annurev.ecolsys.35.120202.110122 407
Alvarez-Mieles, G., Irvine, K., Griensven, A. V., Arias-Hidalgo, M., Torres, A., Mynett, A.E., 2013.
408
Relationships between aquatic biotic communities and water quality in a tropical river-wetland 409
system (Ecuador). Environ. Sci. Policy 34, 115–127.
410
https://doi.org/10.1016/j.envsci.2013.01.011 411
Anderson, M.J., Crist, T.O., Chase, J.M., Vellend, M., Inouye, B.D., Freestone, A.L., Sanders, N.J., 412
Cornell, H. V., Comita, L.S., Davies, K.F., Harrison, S.P., Kraft, N.J.B., Stegen, J.C., Swenson, N.G., 413
2011. Navigating the multiple meanings of β diversity: A roadmap for the practicing ecologist.
414
Ecol. Lett. 14, 19–28. https://doi.org/10.1111/j.1461-0248.2010.01552.x 415
Azrina, M.Z., Yap, C.K., Rahim Ismail, A., Ismail, A., Tan, S.G., 2006. Anthropogenic impacts on the 416
distribution and biodiversity of benthic macroinvertebrates and water quality of the Langat 417
River, Peninsular Malaysia. Ecotoxicol. Environ. Saf. 64, 337–347.
418
https://doi.org/10.1016/j.ecoenv.2005.04.003 419
Barboza, L.G.A., Mormul, R.P., Higuti, J., 2015. Beta diversity as a tool for determining priority 420
streams for management actions. Water Sci. Technol. 71, 1429–1435.
421
https://doi.org/10.2166/wst.2015.112 422
Batáry, P., Báldi, A., Kleijn, D., Tscharntke, T., 2011. Landscape-moderated biodiversity effects of agri- 423
environmental management: A meta-analysis. Proc. R. Soc. B Biol. Sci. 278, 1894–1902.
424
https://doi.org/10.1098/rspb.2010.1923 425
Beavan, L., Sadler, J., Pinder, C., 2001. The invertebrate fauna of a physically modfied urban river.
426
Hydrobiologia 445, 97–108. https://doi.org/https://doi.org/10.1023/A:1017584105641 427
Beever, E.A., Swihart, R.K., Bestelmeyer, B.T., 2006. Linking the concept of scale to studies of 428
biological diversity: Evolving approaches and tools. Divers. Distrib. 12, 229–235.
429
https://doi.org/10.1111/j.1366-9516.2006.00260.x 430
Bonada, N., Prat, N., Resh, V.H., Statzner, B., 2006. DEVELOPMENTS IN AQUATIC INSECT 431
10
BIOMONITORING: A Comparative Analysis of Recent Approaches. Annu. Rev. Entomol. 51, 495–
432
523. https://doi.org/10.1146/annurev.ento.51.110104.151124 433
Borenstein, M., Hedges, L. V., Higgins, J.P.T., Rothstein, H.R., 2009. Introduction to Meta-Analysis.
434
Psychother. Res. J. Soc. Psychother. Res. 421. https://doi.org/10.1002/9780470743386 435
Brauns, M., Garcia, X., Walz, N., Pusch, M.T., 2007. Effects of human shoreline development on 436
littoral macroinvertebrates in lowland lakes. J. Appl. Ecol. 44, 1138–1144.
437
https://doi.org/10.1111/j.1365-2664.2007.01376.x 438
Bried, J.T., Siepielski, A.M., Dvorett, D., Jog, S.K., Patten, M.A., Feng, X., Davis, C.A., 2016. Species 439
residency status affects model selection and hypothesis testing in freshwater community 440
ecology. Freshw. Biol. 61, 1568–1579. https://doi.org/10.1111/fwb.12800 441
Cadotte, M.W., Jonathan Davies, T., Regetz, J., Kembel, S.W., Cleland, E., Oakley, T.H., 2010.
442
Phylogenetic diversity metrics for ecological communities: Integrating species richness, 443
abundance and evolutionary history. Ecol. Lett. 13, 96–105. https://doi.org/10.1111/j.1461- 444
0248.2009.01405.x 445
Cardoso, P., Rigal, F., Carvalho, J.C., Fortelius, M., Borges, P.A. V, Podani, J., Schmera, D., 2014.
446
Partitioning taxon, phylogenetic and functional beta diversity into replacement and richness 447
difference components. J. Biogeogr. 41, 749–761. https://doi.org/10.1111/jbi.12239 448
Céréghino, R., Ruggiero, A., Marty, P., Angélibert, S., 2008. Biodiversity and distribution patterns of 449
freshwater invertebrates in farm ponds of a south-western French agricultural landscape.
450
Hydrobiologia 597, 43–51. https://doi.org/10.1007/s10750-007-9219-6 451
Chadwick, M.A., Thiele, J.E., Huryn, A.D., Benke, A.C., Dobberfuhl, D.R., 2012. Effects of urbanization 452
on macroinvertebrates in tributaries of the St. Johns River, Florida, USA. Urban Ecosyst. 15, 453
347–365. https://doi.org/10.1007/s11252-011-0217-0 454
Chao, A., Chiu, C.H., Hsieh, T.C., Inouye, B.D., 2012. Proposing a resolution to debates on diversity 455
partitioning. Ecology 93, 2037–2051. https://doi.org/10.1890/11-1817.1 456
Clarke, A., Mac Nally, R., Bond, N., Lake, P.S., 2008. Macroinvertebrate diversity in headwater 457
streams: A review. Freshw. Biol. 53, 1707–1721. https://doi.org/10.1111/j.1365- 458
2427.2008.02041.x 459
Compin, A., Céréghino, R., 2007. Spatial patterns of macroinvertebrate functional feeding groups in 460
streams in relation to physical variables and land-cover in Southwestern France. Landsc. Ecol.
461
22, 1215–1225. https://doi.org/10.1007/s10980-007-9101-y 462
Covich, A., Palmer, M., Crowl, T., 1999. The Role of Benthic Invertebrate Species in Freshwater 463
Ecosystems - Zoobenthic Species Influence Energy Flows and Nutrient Cycling. Bioscience 49, 464
119–127. https://doi.org/10.2307/1313537 465
Crist, T.O., Veech, J.A., 2006. Additive partitioning of rarefaction curves and species-area 466
relationships: Unifying α-, β- and γ-diversity with sample size and habitat area. Ecol. Lett. 9, 467
923–932. https://doi.org/10.1111/j.1461-0248.2006.00941.x 468
Crist, T.O., Veech, J.A., Gering, J.C., Summerville, K.S., 2003. Partitioning Species Diversity across 469
Landscapes and Regions: A Hierarchical Analysis of α, β, and γ Diversity. Am. Nat. 162, 734–743.
470
https://doi.org/https://doi.org/10.1086/378901 471
Cuffney, T.F., Mcmahon, G., Kashuba, R., May, J.T., Waite, I.R., 2010. Responses of Benthic 472
Macroinvertebrates to Urbanization in Nine Metropolitan Areas. Ecol. Appl. 20, 1384–1401.
473
https://doi.org/10.1.1.387.5340 474
Davies, P.J., Wright, I.A., Findlay, S.J., Jonasson, O.J., Burgin, S., 2010. Impact of urban development 475
on aquatic macroinvertebrates in south eastern Australia: Degradation of in-stream habitats 476
and comparison with non-urban streams. Aquat. Ecol. 44, 685–700.
477
https://doi.org/10.1007/s10452-009-9307-y 478
Devictor, V., Mouillot, D., Meynard, C., Jiguet, F., Thuiller, W., Mouquet, N., 2010. Spatial mismatch 479
and congruence between taxonomic, phylogenetic and functional diversity: The need for 480
integrative conservation strategies in a changing world. Ecol. Lett. 13, 1030–140.
481
https://doi.org/10.1111/j.1461-0248.2010.01493.x 482
Duval, S., Tweedie, R., 2000a. Trim and Fill: A Simple Funnel‐Plot–Based Method of Testing and 483
11
Adjusting for Publication Bias in Meta‐Analysis. Biometrics 56, 455–463.
484
https://doi.org/https://doi.org/10.1111/j.0006-341X.2000.00455.x 485
Duval, S., Tweedie, R., 2000b. A Nonparametric “Trim and Fill” Method of Accounting for Publication 486
Bias in Meta-Analysis. J. Am. Stat. Assoc. 95, 89–98.
487
https://doi.org/10.1080/01621459.2000.10473905 488
Flynn, D.F.B., Gogol-Prokurat, M., Nogeire, T., Molinari, N., Richers, B.T., Lin, B.B., Simpson, N., 489
Mayfield, M.M., DeClerck, F., 2009. Loss of functional diversity under land use intensification 490
across multiple taxa. Ecol. Lett. 12, 22–33. https://doi.org/10.1111/j.1461-0248.2008.01255.x 491
Gagic, V., Bartomeus, I., Jonsson, T., Taylor, A., Winqvist, C., Fischer, C., Slade, E.M., Steffan- 492
Dewenter, I., Emmerson, M., Potts, S.G., Tscharntke, T., Weisser, W., Bommarco, R., 2015.
493
Functional identity and diversity of animals predict ecosystem functioning better than species- 494
based indices. Proc. R. Soc. B Biol. Sci. 282. https://doi.org/10.1098/rspb.2014.2620 495
Geist, J., Hawkins, S.J., 2016. Habitat recovery and restoration in aquatic ecosystems: current 496
progress and future challenges. Aquat. Conserv. Mar. Freshw. Ecosyst. 26, 942–962.
497
https://doi.org/10.1002/aqc.2702 498
Gimenez, B.C.G., Lansac-Tôha, F.A., Higuti, J., 2015. Effect of land use on the composition, diversity 499
and abundance of insects drifting in neotropical streams. Brazilian J. Biol. 75, 52–59.
500
https://doi.org/10.1590/1519-6984.03914 501
Gonzalo, C., Camargo, J.A., 2013. The impact of an industrial effluent on the water quality, 502
submersed macrophytes and benthic macroinvertebrates in a dammed river of central spain.
503
Chemosphere 93, 1117–1124. https://doi.org/10.1016/j.chemosphere.2013.06.032 504
Hassall, C., Anderson, S., 2015. Stormwater ponds can contain comparable biodiversity to 505
unmanaged wetlands in urban areas. Hydrobiologia 745, 137–149.
506
https://doi.org/10.1007/s10750-014-2100-5 507
Hauer, F.R., Lamberti, G.A., 2007. Methods in Stream Ecology, Academic Press.
508
https://doi.org/10.1016/B978-0-12-332908-0.X5001-3 509
Hedges, L. V, 1981. Distribution Theory for Glass ’s Estimator of Effect Size and Related Estimators. J.
510
Educ. Stat. 6, 107–128. https://doi.org/https://doi.org/10.2307/1164588 511
Heino, J., 2011. A macroecological perspective of diversity patterns in the freshwater realm. Freshw.
512
Biol. 56, 1703–1722. https://doi.org/10.1111/j.1365-2427.2011.02610.x 513
Heino, J., Bini, L.M., Andersson, J., Bergsten, J., Bjelke, U., Johansson, F., 2017. Unravelling the 514
correlates of species richness and ecological uniqueness in a metacommunity of urban pond 515
insects. Ecol. Indic. 73, 422–431. https://doi.org/10.1016/j.ecolind.2016.10.006 516
Heino, J., Muotka, T., Paavola, R., 2003. Determinants of macroinvertebrate in headwater diversity 517
streams : regional and local influences. J. Anim. Ecol. 72, 425–434.
518
https://doi.org/10.1046/j.1365-2656.2003.00711.x 519
Heino, J., Tolonen, K.T., 2017. Ecological drivers of multiple facets of beta diversity in a lentic 520
macroinvertebrate metacommunity. Limnol. Oceanogr. https://doi.org/10.1002/lno.10577 521
Hill, M.J., Biggs, J., Thornhill, I., Briers, R.A., Gledhill, D.G., White, J.C., Wood, P.J., Hassall, C., 2016.
522
Urban ponds as an aquatic biodiversity resource in modified landscapes. Glob. Chang. Biol. 23, 523
986–999. https://doi.org/10.1111/gcb.13401 524
Hill, M.J., Heino, J., Thornhill, I., Ryves, D.B., Wood, P.J., 2017. Effects of dispersal mode on the 525
environmental and spatial correlates of nestedness and species turnover in pond communitiHill, 526
M.J., Heino, J., Thornhill, I., Ryves, D.B., Wood, P.J., 2017. Effects of dispersal mode on the 527
environmental and spatial corre. Oikos 126, 1575–1585. https://doi.org/10.1111/oik.04266 528
Hill, M.J., Ryves, D.B., White, J.C., Wood, P.J., 2016. Macroinvertebrate diversity in urban and rural 529
ponds: Implications for freshwater biodiversity conservation. Biol. Conserv. 201, 50–59.
530
https://doi.org/10.1016/j.biocon.2016.06.027 531
Li, Z., Wang, J., Liu, Z., Meng, X., Heino, J., Jiang, X., Xiong, X., Jiang, X., Xie, Z., 2019. Different 532
responses of taxonomic and functional structures of stream macroinvertebrate communities to 533
local stressors and regional factors in a subtropical biodiversity hotspot. Sci. Total Environ. 655, 534
1288–1300. https://doi.org/10.1016/j.scitotenv.2018.11.222 535
12
Mcgoff, E., Solimini, A.G., Pusch, M.T., Jurca, T., Sandin, L., 2013. Does lake habitat alteration and 536
land-use pressure homogenize European littoral macroinvertebrate communities? J. Appl. Ecol.
537
50, 1010–1018. https://doi.org/10.1111/1365-2664.12106 538
Mermillod-Blondin, F., 2011. The functional significance of bioturbation and biodeposition on 539
biogeochemical processes at the water–sediment interface in freshwater and marine 540
ecosystems. J. North Am. Benthol. Soc. 30, 770–778. https://doi.org/10.1899/10-121.1 541
Meyer, J.L., Paul, M.J., Taulbee, W.K., 2005. Stream ecosystem function in urbanizing landscapes. J.
542
North Am. Benthol. Soc. 24, 602–612. https://doi.org/10.1899/04-021.1 543
Meyer, M.D., Davis, C.A., Dvorett, D., 2015. Response of Wetland Invertebrate Communities to Local 544
and Landscape Factors in North Central Oklahoma. Wetlands 35, 533–546.
545
https://doi.org/10.1007/s13157-015-0642-6 546
Nery, T., Schmera, D., 2016. The effects of top-down and bottom-up controls on macroinvertebrate 547
assemblages in headwater streams. Hydrobiologia 763, 173–181.
548
https://doi.org/10.1007/s10750-015-2371-5 549
Palmer, M.A., Menninger, H.L., Bernhardt, E., 2010. River restoration, habitat heterogeneity and 550
biodiversity: A failure of theory or practice? Freshw. Biol. 55, 205–222.
551
https://doi.org/10.1111/j.1365-2427.2009.02372.x 552
Passy, S.I., Blanchet, F.G., 2007. Algal communities in human-impacted stream ecosystems suffer 553
beta-diversity decline. Divers. Distrib. 13, 670–679. https://doi.org/10.1111/j.1472- 554
4642.2007.00361.x 555
Paul, M.J., Meyer, J.L., 2001. Streams in the Urban Landscape. Annu. Rev. Ecol. Syst. 32, 333–365.
556
https://doi.org/https://doi.org/10.1146/annurev.ecolsys.32.081501.114040 557
Perronne, R., 2014. Contrasted taxonomic, phylogenetic and functional diversity patterns in semi- 558
natural permanent grasslands along an altitudinal gradient. Plant Ecol. Evol. 147, 165–175.
559
https://doi.org/10.5091/plecevo.2014.885 560
R Core Team, 2016. R: A language and environment for statistical computing. Version: 3.2.5. Vienna, 561
Austria.
562
Rios, S.L., Bailey, R.C., 2006. Relationship between riparian vegetation and stream benthic 563
communities at three spatial scales. Hydrobiologia 553, 153–160.
564
https://doi.org/10.1007/s10750-005-0868-z 565
Rosenberg, D., Resh, V.H., 1993. Freshwater biomonitoring and benthic macroinvertebrates, 566
Freshwater biomonitoring and benthic macroinvertebrates. Chapman & Hall, New York.
567
https://doi.org/10.1002/aqc.3270040110 568
Rosenthal, R., 1991. Meta-analytic procedures for social research. Sage Publ. Newbury Park. CA.
569
https://doi.org/10.1016/0148-2963(94)90020-5 570
Rosenthal, R., 1979. The file drawer problem and tolerance for null results. Psychol. Bull. 86, 638–
571
641. https://doi.org/10.1037/0033-2909.86.3.638 572
Sánchez-Fernández, D., Abellán, P., Mellado, A., Velasco, J., Millán, A., 2006. Are water beetles good 573
indicators of biodiversity in Mediterranean aquatic ecosystems? The case of the Segura river 574
basin (SE Spain). Biodivers. Conserv. 15, 4507–4520. https://doi.org/10.1007/s10531-005-5101- 575
x 576
Schmera, D., Heino, J., Podani, J., Erős, T., Dolédec, S., 2017. Functional diversity: a review of 577
methodology and current knowledge in freshwater macroinvertebrate research. Hydrobiologia 578
787, 27–44. https://doi.org/10.1007/s10750-016-2974-5 579
Specziár, A., Árva, D., Tóth, M., Móra, A., Schmera, D., Várbíró, G., Erős, T., 2018. Environmental and 580
spatial drivers of beta diversity components of chironomid metacommunities in contrasting 581
freshwater systems. Hydrobiologia 819, 123–143. https://doi.org/10.1007/s10750-018-3632-x 582
Tanaka, T., Sato, T., 2015. Taxonomic, phylogenetic and functional diversities of ferns and lycophytes 583
along an elevational gradient depend on taxonomic scales. Plant Ecol. 216, 1597–1609.
584
https://doi.org/10.1007/s11258-015-0543-z 585
Tchakonté, S., Ajeagah, G.A., Camara, A.I., Diomandé, D., Nyamsi Tchatcho, N.L., Ngassam, P., 2015.
586
Impact of urbanization on aquatic insect assemblages in the coastal zone of Cameroon: the use 587
13
of biotraits and indicator taxa to assess environmental pollution. Hydrobiologia 755, 123–144.
588
https://doi.org/10.1007/s10750-015-2221-5 589
Thompson, P.L., Isbell, F., Loreau, M., O’Connor, M.I., Gonzalez, A., 2018. The strength of the 590
biodiversity–ecosystem function relationship depends on spatial scale. Proc. R. Soc. B Biol. Sci.
591
285. https://doi.org/10.1098/rspb.2018.0038 592
Thornhill, I.A., Biggs, J., Hill, M.J., Briers, R., Gledhill, D., Wood, P.J., Gee, J.H.R., Ledger, M., Hassall, 593
C., 2018. The functional response and resilience in small waterbodies along land-use and 594
environmental gradients. Glob. Chang. Biol. 24, 3079–3092. https://doi.org/10.1111/gcb.14149 595
Tilman, D., 1997. The Influence of Functional Diversity and Composition on Ecosystem Processes.
596
Science (80-. ). 277, 1300–1302. https://doi.org/10.1126/science.277.5330.1300 597
UNDESA, 2018. World Urbanization Prospects: The 2018 Revision.
598
https://doi.org/(ST/ESA/SER.A/366) 599
Vandewalle, M., de Bello, F., Berg, M.P., Bolger, T., Dolédec, S., Dubs, F., Feld, C.K., Harrington, R., 600
Harrison, P.A., Lavorel, S., da Silva, P.M., Moretti, M., Niemelä, J., Santos, P., Sattler, T., Sousa, 601
J.P., Sykes, M.T., Vanbergen, A.J., Woodcock, B.A., 2010. Functional traits as indicators of 602
biodiversity response to land use changes across ecosystems and organisms. Biodivers. Conserv.
603
19, 2921–2947. https://doi.org/10.1007/s10531-010-9798-9 604
Viechtbauer, W., 2010. Conducting Meta-Analyses in R with the metafor Package. J. Stat. Softw. 36, 605
1–48. https://doi.org/10.1103/PhysRevB.91.121108 606
Vinson, M.R., Hawkins, C.P., 1998. Biodiversity of Stream Insects: Variation at Local, Basin, and 607
Regional Scales. Annu. Rev. Entomol. 43, 271–293.
608
https://doi.org/10.1146/annurev.ento.43.1.271 609
Vörösmarty, C.J., McIntyre, P.B., Gessner, M.O., Dudgeon, D., Prusevich, A., Green, P., Glidden, S., 610
Bunn, S.E., Sullivan, C.A., Liermann, C.R., Davies, P.M., 2010. Global threats to human water 611
security and river biodiversity. Nature 467, 555–561. https://doi.org/10.1038/nature09440 612
Walsh, C.J., Roy, A.H., Feminella, J.W., Cottingham, P.D., Groffman, P.M., Morgan, R.P., 2005. The 613
urban stream syndrome: current knowledge and the search for a cure. J. North Am. Benthol.
614
Soc. 24, 706–723. https://doi.org/10.1899/04-028.1 615
Weigel, B., Blenckner, T., Bonsdorff, E., 2015. Maintained functional diversity in benthic communities 616
in spite of diverging functional identities. Oikos 125, 1421–1433.
617
https://doi.org/10.1111/oik.02894 618
Whittaker, R.H., 1960. Vegetation of the Siskiyou Mountains, Orgeon and California. Ecol. Monogr.
619
30, 279–338. https://doi.org/10.2307/1943563 620
Zhang, Y., Wang, B., Han, M., Wang, L., 2012. Relationships between the Seasonal Variations of 621
Macroinvertebrates, and Land Uses for Biomonitoring in the Xitiaoxi River Watershed, China.
622
Int. Rev. Hydrobiol. 97, 184–199. https://doi.org/10.1002/iroh.201111487 623
624
Table 1: Different components of biodiversity and their interpretation.
625
Alpha diversity Local diversity of a sample, a habitat or a site
Beta diversity Variation in community composition among habitats or the extent of change in assemblage composition along gradients
Gamma diversity Total species diversity of across single habitat, landscape or region 626
627
Table 2: Recommendation for the future research.
628
ID Recommendation
1. Report results on specific taxonomic group for a deeper understanding of the entire macroinvertebrate community
2 Study the impacts of urbanization on macroinvertebrate diversity in understudied continents and different habitat types (especially wetlands, ponds and lakes)
3 Complement taxonomic diversity measures by measures focusing on functional and
14 phylogenetic facets of the diversity
4 Study the influence of spatial scale on biodiversity, e.g., beta diversity 629
FIGURE LEGENDS 630
631 632 633
634 635
Fig. 1: Frequency distribution of taxonomic groups used to study the effect of urbanization on 636
macroinvertebrate diversity 637
15 638
Fig. 2: Frequency distribution of measures used to study the effect of urbanization on 639
macroinvertebrate diversity 640
641
16 642
Fig. 3: Frequency distribution of the outcomes in different continents 643
644
17 645
646
Fig. 4: Forest plot of effect sizes (Hedges' g) measuring the effect of urbanization on 647
macroinvertebrate diversity 648