UNIVERSITY OF WEST-HUNGARY
Faculty of Agricultural and Food Sciences, Mosonmagyaróvár
Institute of Agricultural, Food and Environmental Engineering
DOCTORAL (PhD) THESIS
Summary
Development of measurement technique for GPS-aided plant production
PÉTER ÁKOS MESTERHÁZI
Mosonmagyaróvár 2003
TABLE OF CONTENT
1. INTRODUCTION
2.2. MATERIALS AND METHODS
3.2.1. Soil sampling 4.
2.2. Yield monitoring 4.
2.3. Site-specific nutrient replenishment system 4.
2.4. Measurement of soil physical parameters 4.
2.5. Investigations with optical device based system 5.
2.6. Data transfer among precision farming systems 5.
2.7. Investigations in connection with machine guidance 6.
3. RESULTS
7.3.1. Soil sampling 7.
3.2. Yield monitoring 7.
3.3. Site-specific nutrient replenishment 8.
3.4. Measurement of soil physical parameters 9.
3.5. Investigations with optical device based system 11.
3.6. Data transfer among precision farming systems 12.
3.7. Investigations in connection with machine guidance 13.
4. NEW SCIENTIFIC RESULTS (THESIS)
14.
5. LIST OF PUBLICATIONS
16.1. INTRODUCTION
Precision farming is coming into general use all over the world and in Hungary as well due to its undoubted advantages. The greatest benefit of this technology is the possibility of making both economic and ecological trends meet.
Using this farming system the infield variability can be mapped and treated according to local conditions. In this way, the optimal amount of inputs (pesticides, fertilisers or even seeds) can be applied in each section of a field.
While given parts of the technology become available for agricultural practice, further research is required in many aspects.
In the frame of the presented research activity a field level site-specific trial was established involving yield monitoring, soil sampling and nutrient replenishment in order to model the actual practical circumstances and to test the capability and accuracy of the applied system under these conditions. The applied fertiliser advisory system was also examined in context with the variable rate technology. The analysis of the recorded databases was also carried out.
The field trial provided possibilities for further examinations. In connection with soil sampling and the mapping of physical soil properties the comparison of point and continuous measurement and the effect of different sampling density on the resulted maps were investigated.
In addition to the field trial, our aim was to develop the basis of a machine vision based weed-monitoring system avoiding the typical limiting factors and thus facilitating the practical application of this technology. The possibility of applying the system for pest management was also studied. Based on these measurements the fundamental system requirements (e.g. sensor sensitivity) were determined.
The design, the evaluation and the practical application of an on-line soil draft monitoring system, and the connection of the measured values with other data are reported as well.
The co-application of the RDS and Agrocom ACT precision farming systems was problematic due to the incompatibility of data files, nonetheless it may be an evident practical demand. The (manual) file transformation method worked out is presented together with the advantages deriving from its application.
The accuracy of the RDS Marker Guide DGPS-based navigation tool was also tested because of the experienced displacing of the guidelines during the VRA (Variable Rate Application) of solid fertilizer. Another goal, at the same time, was to find out whether the applied guidance tool fulfils its purpose and the practical requirements. The question arose as well if such system is on the market can it be used as a basis for autonomous guidance system.
During our research activity emphasis was laid on practicability under real field conditions.
2. MATERIALS AND METHODS
The field trial was carried out in the 15.3 ha field No. 80/1 belonging to the study farm of the University of West-Hungary, Faculty of Agricultural and Food Sciences. The 1 ha experimental plot of the Institute of Agricultural, Food and Environmental Engineering served as the research site for fundamental measurements with the soil draft and the weed monitoring systems. Both research fields are situated in the area of Mosonmagyaróvár, in the North-Western part of Hungary. The cultivated plants in field 80/1 were maize in 2001 and 2002, and spring barley in 2003, while the 1 ha area was a fallow.
2.1. Soil sampling
Site-specific soil sampling was carried out on a 50 x 50 m grid, dividing the 15.3 ha field into 63 management units with an average size of 0.25 ha.
According to the local conditions the grid shows irregularity in given sections.
The sampling took place by means of a hand probe and DGPS navigation in November 2001.
2.2. Yield monitoring
Yield monitoring was conducted yearly from 2001 after some test runs in other fields. The harvested plants were maize in 2001 and 2002 and spring barley in 2003. The employed system was the Agrocom ACT installed on a Deutz Fahr M 35.80 combine harvester.
2.3. Site-specific nutrient replenishment system
On the basis of the soil analysis results the required amounts of fertilisers were determined for each treatment unit using the Fertiliser Advisory Model developed by the Research Institute for Soil Science and Agricultural Chemistry and the Research Institute for Agronomy of the Hungarian Academy of Sciences (RISSAC HAS and RIA HAS). Fertilizers were spread with the Agrocom ACT system jointly with the Amazone ZA-M Max Tronic disc spreader. In 2001 homogeneous fertilizer application took place to obtain information on the fertility potential of the field.
2.4. Measurement of soil physical parameters
Cone (manual) vertical penetrometer (3T) measurement was carried out with DGPS navigation provided by the Agrocom ACT. The sampling took place on a regular 20 x 20 m grid in three replications to a maximum depth of 0.4 m.
Soil draft was simultaneously measured by means of a self-developed continuous
tool. The soil draft monitoring system records and joins the electric signal of the load cells built in the electro hydraulic system of the applied Steyer 9078/A tractor with the actual position provided by the DGPS receiver of the RDS or Agrocom ACT systems. Using the equation defined by validation the electric signal can be transformed into force value. In this way, the dynamic forces acting on the surface of the cultivator tool can be recorded. The applied tillage tools were: a cultivator with eight tools (1 ha field) and a single loosener (field No.
80/1). The results of cone penetrometer and on-line measurements were compared with each other and with other data originating from the field trial.
2.5. Investigations with optical device based system
An optical weed/plant monitoring system was established. It consists of a Hitachi KP-C550 CCD camera, a “Hauppauge WinTV Go” PCI capture card installed into a KP5212TS field computer and image processing software using a predetermined algorithm for weed and soil discrimination. The position information is supplied by one of the above-mentioned DGPS receivers. The system was later supplemented with a FLIR ThermaCAM PM 675 infrared camera with a thermal sensitivity of 0.1°C, and a so-called Humanoid Machine Vision System (HMVS) providing a horizontal view angle of 360° was installed on the CCD camera. The informatics and computational background involving the transformation of the HMVS image and the soil draft-monitoring task was elaborated by Stephan Maniak. The effect of plant diseases and pests on the temperature of plants was also studied by using the infrared camera and in cooperation with Prof. Dr. Géza Kuroli DSc and the Department of Plant Protection of the University of West-Hungary.
2.6. Data transfer among precision farming systems
After analysing the file structures of the RDS and Agrocom ACT yield monitoring systems a manual file transformation method was worked out. By extracting and editing the data from the proper columns of the RDS yield file a tab delimited text file can be built. A header consisting of the title of each column should be included.
2.7. Investigations in connection with machine guidance
Guidance tests were carried out in the 1 ha practice field during which a predetermined pathway was followed in 3-5 repetitions. The test runs were repeated at different times of subsequent days in January 2003. The pathway was planned in Agromap Basic as point sampling order. Navigation provided by the ACT was used for marking out the guideline for the RDS Marker Guide. The actual position was recorded with a frequency of 2 s by the Agroline program running on the ACT. The working width was set for 18 m.
3. RESULTS
3.1. Soil sampling
On the basis of soil sample analyses, soil supply maps were compiled.
According to the statistical analysis KA showed significant correlation with hu%, Na and Mg content on a level of P = 0.1%. A similar significance was presented by hu% with Na, Mg and Cu contents (in addition to KA); and with total N% on P
= 1% level. Further definite connection (P=0.1%) was found between CaCO3 and Mg; P2O5 and Zn; Na and Mg; Zn and Mn; Zn and Fe; Cu and Fe and Mn and Fe contents. Additionally, a P = 5% correlation was present between pHKCl and P2O5; hu% and total N%; total N% and Na content as well as between Cu and Mn contents. pHKCl showed correlation on a level of P=5% with pHH20,P2O5 and Zn
contents. A similar connection manifested between pHKCl and Zn content; salt%
and Cu content; total N% and Cu content; K2O and Zn; K2O and Fe furthermore between Mg and Cu and Zn and Cu contents.
3.2. Yield monitoring
The yearly compiled yield and grain moisture content maps indicated significant infield heterogeneity. The patterns of the yield maps show: the low yielding area in mid-field appears in all three years, however it slightly dissolves in 2003. According to this analysis the following statistically justifiable regressions were found:
− Yield variance in 2001 was mainly affected by KA (R= 0.5927) P = 0.1%.
Na and Mg contents also proved to be significant factors on a probability level of 99% (R = 0.34 and 0.35, respectively).
− The same factors influenced yield in 2002 slightly more decidedly; the statistical correlation is justifiable on a probability level of 99.9%. Besides, the effect of humus and Cu contents turned out to be significant (P = 1% and 5%, respectively) too.
− In 2003 a significant correlation on a probability level of 99.9% was found only with the Cu content (R = 0.48). The effect of Mg was like that in 2001.
Salt and total N contents also proved determinative on a 95% level, the humus content, however, showed significance only on a 90 % level, similarly to KA.
− The variability in grain moisture content in 2001 was mainly affected by two factors: Mn and Zn contents (P = 0.1%). The influence of Fe content and pHKCl is justifiable on a probability level of 99%. In case of the NO3
content a significance of P = 95% was found.
− No significant correlation was found between the soil characteristics and grain moisture content.
3.3. Site-specific nutrient replenishment
The amount of applied fertiliser was recorded and mapped as a sensor is mounted in the quantity regulator of the disc spreader. In this way, the planned and applied nutrient replenishments are comparable. These comparisons proved that the applied fertilizer distributor system has the potential of accurate site- specific application (Fig. 3.3.1.). At the same time, some inaccuracies and deviations in the regulated fertilizer amounts occurred. As, in most cases, the causative factors (inappropriate fertilizing practice, dusty fertilizer) could be detected, the accuracy increased significantly by 2003 (Fig. 3.3.2.).
0 10 20 30 40 50 60 70 80 90
1 4 7 10 13 16 19 22 25 28 31 34 37 40 43 46 49 52 55 58 61
treatement units
kg/ha
planned distributed
Figure 3.3.1. Comparison of the planned and applied P2O5 agent in the treatment units in 2003
Besides, the deviation of yield also decreased: the CV% decreased from 31.79 (2001) to 27.26 (2002) (P = 5%). The more harmonic nutrient supply was thought to be responsible for this equalization.
y = 0.9051x + 2.6719 R2 = 0.9834 0
10 20 30 40 50 60 70 80
0 10 20 30 40 50 60 70 80 90
planned[kg/ha]
distributed [kg/ha]
Figure 3.3.2. Correlation between the amounts of planned and applied P2O5 agent in the treatment units in 2003
3.4. Measurement of soil physical parameters
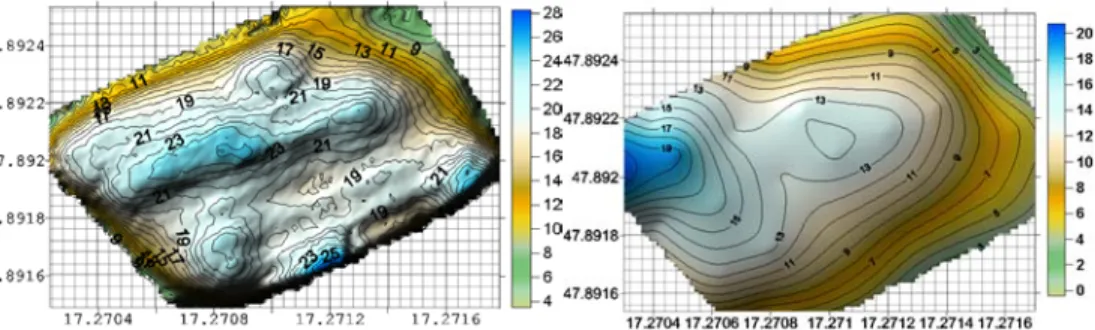
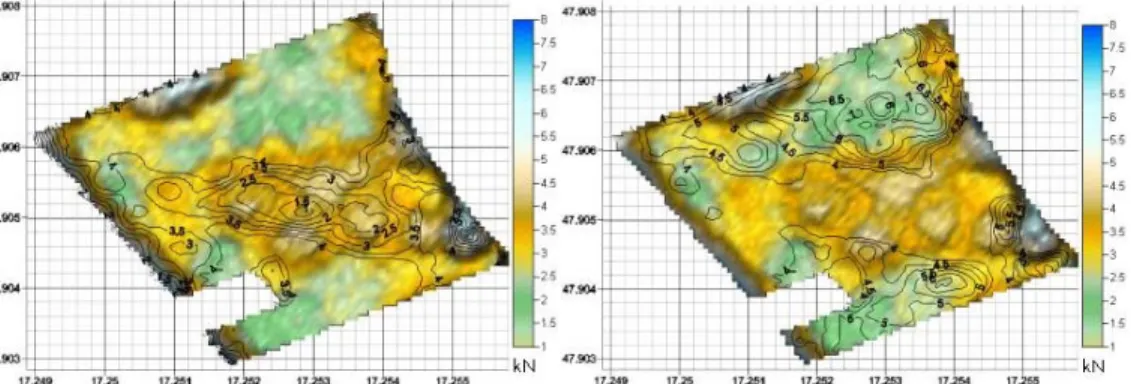
Based on the penetrometer and on-line soil draft monitoring system the compaction and soil draft maps of both fields were generated. In case of the 1 ha field the situation of the soil layer with a compaction of 3 MPa or more was modelled and the penetrometer and on-line measurement data were compared with those of field No. 80/1. No significant statistical correlation was found. The different nature or the different resolution (number of measurement points) of the two measurements were the possible reasons of this phenomenon. For examining the effect of sampling intensity on accuracy, the map of on-line soil draft of the 1 ha field was compiled, taking into account only the values belonging to the penetrometer measurement points (Fig. 3.4.1.).
Figure 3.4.1. The map of on-line soil draft from the whole data set and on the penetrometer measurement points (kN)
Based on Fig. 3.4.1. it can be said that continuous measurement provides more reliable information on the soil compaction status due to the large number of sample points. Contrasted with it, the map based on the 20 m x 20 m grid measurement masks the existing heterogeneity and shows invalid image in some cases, which is undoubtedly due to the effect of interpolation among the measured points. It should be mentioned at the same time that the 20 m x 20 m grid is still much denser than practically would be realisable.
The soil draft data of field No. 80/1 was compared with the measured yields of three years. Although no statistically justifiable correlation was found, the visualisation presented in Fig. 3.4.2. shows a clear connection between the examined parameters. A higher level of compaction is present on the lower yielding area, while the higher yields are typically measured on the areas with lower compaction. The fitting was very similar in case of maize in 2002 but the demarcation was observed around 5 t/ha. This increase indicates that the direct and indirect effect of soil compaction on yield was less explicit after site-specific nutrient application, the reason of which is the more reasonable nutrient supply.
The same trend was observed in case of spring barley in 2003.
Figure 3.4.2. The on-line soil draft map with the contours of yield below (left) and above (right) 4 t/ha, respectively (maize, 2001).
3.5. Investigations with optical device based system
The on-line weed monitoring system proved to be an effective tool for soil and plant discrimination. The average error between automatically analyzed and manually measured weed density was 13 or 1 percent in case of the CCD and infrared camera, respectively.
The application of the Humanoid Machine Vision System significantly enlarged the view angle of the CCD camera. An area of 1 ha can be covered with a single image taken from a height of 1.5 m.
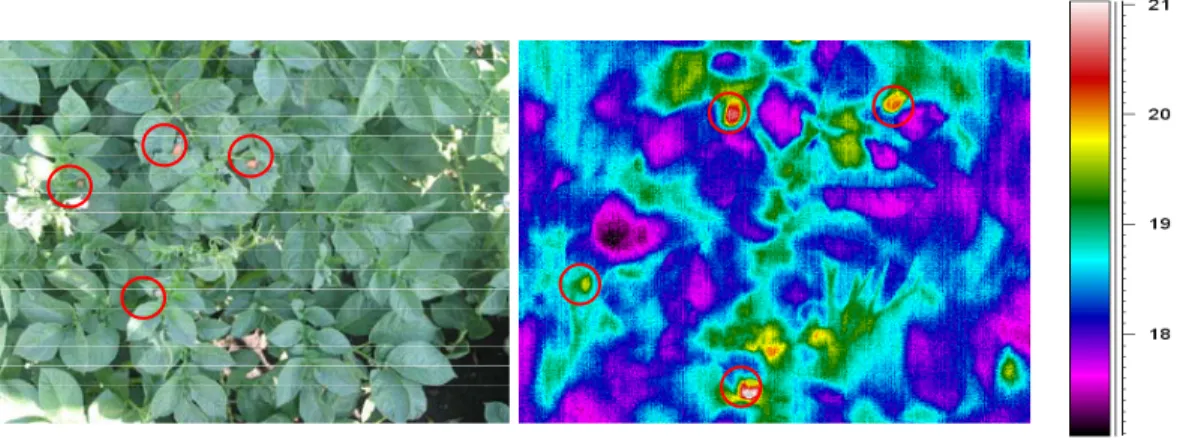
The infrared technique proved to be an efficient tool in case of pest monitoring as well. The 0.1 °C sensitivity of the camera turned out to be sufficient. Both the imagoes and the grubs of Colorado beetle (Leptinotarsa decemlineata Say) are sharply differentiated from the surrounding canopy. The temperature difference reaches 1-1.5 °C (Fig. 3.5.1.). Measurable temperature increase was observed as a consequence of harm caused by insects (champed plant parts) and virus infection as well. The degree of this increase reached 1.5-2.5
°C in the first and 2-2.5 °C in the latter case. The assumed reason for the temperature distinction is the altered transpiration of the infected or harmed
plants, which is caused by the changed metabolism or directly by the reduced transpiration surface.
Figure 3.5.1. Imagoes and grubs of Colorado beetle on potato
3.6. Data transfer among precision farming systems
The transform file – created as “txt file” – can be chosen in the AgroMap Basic’s import menu and the custom import procedure can be applied. After that, it can be handled as the AgroMap Basic’s own row data. The advantages of the worked out data transfer are as follows:
− Height and grain moisture content maps can be created from the RDS data base.
− It is possible to dissociate and evaluate separately any part of a given RDS yield map in Agromap Basic.
− The Agrocom ACT system involves the ArcView-based Agromap Professional software, which allows the import of Agromap Basic objects into an ArcView type GIS. By means of the returned transformation it is available for the RDS data as well. These functions were not available in the RDS’ own software.
− Using this kind of data transfer, other geo-coded information can be imported as well.
3.7. Investigations in connection with machine guidance
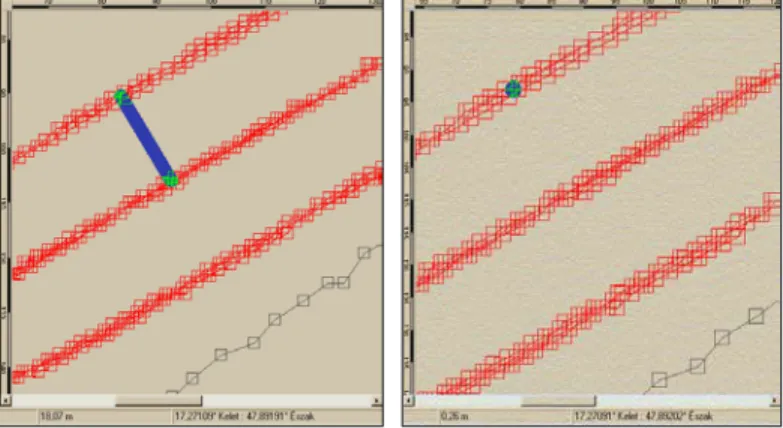
According to the results of the trial carried out in the 1 ha experimental plot the measured average distance between two pathways (red) was 18.07 m and an overall deviation of 0.26 m was found among the subsequent runs (Fig. 3.7.1.).
(Based on our experiments it can be stated that this deviation was caused mainly by the so-called human factor – the error of the driver – that happens under practical conditions as well.) Nevertheless, even when the runs were repeated with significant time gaps the consequent displacing of the guidelines occurred again.
The degree of this shift exceeded 3 m between extreme values (Fig. 3.7.1.). (The blue line is the measurement tool of the software.). As a consequence, it was stated that the examined guidance system fulfils its purpose in case of variable rate applications, but is not suitable for the basis of any autonomous guidance system. The experienced phenomenon is caused by the inaccuracy of the GPS system itself.
Figure 3.7.1. The analysis of the recorded DGPS data (Agromap Basic)
4. NEW SCIENTIFIC RESULTS (THESIS)
1. On the basis of my measurements I state that although the number of sample points required to achieve the objective image of in-field heterogeneity can be defined, this sampling intensity is practically unachievable. Therefore, continuous (on-line) measurement of the mentioned properties is necessary.
(The continuous soil draft monitoring method was developed for this purpose.)
2. The pattern of the compaction map generated from the on-line data set shows correspondence to the yield maps of three years, under the given circumstances.
3. Based on my measurements I declare that the vertical cone penetrometer resistance and the complex forces measured on the surface of the cultivator tools differ significantly. The (vertical) penetrometer measurement provides insufficient information about the energy demand of the tillage, especially in case of the sample density that can be achieved under practical circumstances.
4. Statistically justifiable equalization of the yield took place within the field after the applied site-specific nutrient spreading. Based on my investigations I declare that the effect of aridity on yield can be decreased by using the RISSAC-HAS - RIA-HAS (Research Institute for Soil Science and Agricultural Chemistry and Research Institute for Agronomy of the Hungarian Academy of Sciences) fertiliser advisory system, which can be successfully applied combined with VRA systems.
5. Based on the conducted examinations I express that the information provided by the established weed monitoring system is adequate for weed monitoring between plant rows or as stubble analysis.
6. The presence of insects as well as the harm caused by virus or insects are measurable by the temperature difference. Based on my investigations I
pronounce that the degree of this temperature difference makes sensing possible with less sensitive (thus significantly cheaper) sensors as compared to the 0.1°C of the applied infrared camera.
7. The elaborated data transformation method ensures the data transfer between the Agrocom ACT and the RDS yield monitoring systems. Consequently, the joint application of the two systems and an advanced level of data analysis are ensured.
5. LIST OF PUBLICATIONS
ARTICLES
HungarianMesterházi P. - Pecze Zs. - Neményi M. (2001): A precíziós növényvédelmi eljárások műszaki -térinformatikai feltételrendszere. (The engineering and GIS background of precision plant protection methods.) Növényvédelem (Plant production) 37 (6), 2001.
Neményi M. – Pecze Zs. – Mesterházi P. Á. – Németh T. (2001): A precíziós- helyspecifikus növénytermesztés műszaki és térinformatikai feltételrendszere.
(The engineering and GIS background of precision plant production.) Növénytermelés 50, 4, p.419-429.
Pecze Zs. - Neményi M. - Mesterházi P. Á. (2001): A helyspecifikus tápanyagvisszapótlás műszaki háttere. (Engineering background of site-specific nutrient replacement.) Mezőgazdasági Technika.(Agricultural Technique) 42,02 : 5-6
English
Neményi M. – Pecze Zs. – Mesterházi P. Á. – Kiss, E. (2002): Engineering Environment of the precision crop production. Hungarian Agricultural Engineering, No. 15, p89-91
Neményi M. - Mesterházi P.Á. - Pecze Zs. - Stépán Zs. (2002): The role of GIS and GPS in precision farming. Computers and Electronics in Agriculture. 40 (1- 3): 45-55.
Neményi M. – Mesterházi P.Á. (2003): Site-specific Yield- and Soil resistance mapping and nutrient replacement. Pollution and water resources, Columbian University seminar proceedings, Studies of environmental protection in the Carpatian basin. Vol. 33/34, 1999/2003, Edited by George J. Halasi-Kun. P.
230/242.
Mesterházi P.Á. – Neményi M. (2004): Development of the technical environment of precision plant production. Hungarian Agricultural Research. In print.
Mesterházi P. Á. - Neményi M. – S. Maniak (2004): Development of the technical foundation of precision plant production – environmental aspects.
Columbian University seminar proceedings, In print.
PROCEEDINGS
HungarianMesterházi P. Á. (2000): A helyspecifikus (precíziós) növénytermesztési technológiák műszaki háttere. (The engineering background of site-specific plant production technology.) Scientific forum of the doctoral candidates of the VEAB region. A VEAB régió doktorandusainak tudományos fóruma, Sopron, 2000, p.118-120.
Neményi M. – Mesterházi P. Á. – Gyulai I. (2001): A kemikáliák helyspecifikus kijuttatásának műszaki feltételrendszere az agrárgazdaságban, különös tekintettel a környezetvédelemre. (Engineering background of site-specific application of chemicals with special regard to environment protection.) II. Környezettudományi Tanácskozás Előadásai (Presentations of the 2nd Conference on Environment Protection), 2001, (szerk./ edit. Dr. Nagy Géza) p. 85-94.
Pecze Zs. - Neményi M. - Mesterházi P.Á. - Stépán Zs., - Kiss E. (2001):
Termés- és talajadatokra alapozott helyspecifikus műtrágya-kijuttatás. Magyar Tudományos Akadémia Agrár-Műszaki Bizottság 25. Kutatási és Fejlesztési Tanácskozás, Gödöllő. Proceedings. (Yield and soil data based site-specific nutrient application. Agro-Engineering Board of the Hungarian Academy of Sciences, XXV. Research and development Symposium, Gödöllő) III. p. 65-69.
Mesterházi P.Á. – Neményi M. – Kacz K. – Stépán Zs. (2002): Precíziós növénytermesztési kísérletek a mosonmagyaróvári Agrárműszaki Intézetben. EU konform mezőgazdaság és élelmiszerbiztonság. (Precision plant production experiments at the Insitute of Agricultural, Food and Environmental Engineering in Mosonmagyaróvár. EU Conform Agriculture and Food Safety.) Szerk./Edit.
Nagy János, Debrecen 2002., p57-70.
Mesterházi P. Á. – Neményi M. – Pecze Zs. (2002): GPS szoftverek átjárhatósága. MTA Agrár-Műszaki Bizottság, 26. Kutatási és Fejlesztési
Tanácskozás. (Compatibility of GPS software. Agro-Engineering Board of the Hungarian Academy of Sciences, XXVI. Research and development Symposium, Gödöllő) I. 52-56.p.
Neményi M. – Mesterházi P. Á. (2002): GPS rendszerek alkalmazása a mezőgazdasági gépüzemeltetésben. „Hatékonyan, szakszerűen - kihívások a III.
évezred elején” Tápanyag-visszapótlási szimpózium. (Application of GPS systems in agricultural machinery operation. Symposium on Fertilizer Replacement.)Bábolna; p. 34-37.
Gyulai I. - Neményi M. - Mesterházi P. Á. (2002): GIS alkalmazások.
Agrártermelés – Életminőség. XXIX. Óvári Tudományos Napok. 2002. október 3- 4. Mosonmagyaróvár. Előadások és poszterek összefoglaló anyaga. 235. p. Teljes anyag megjelent CD lemezen. (GIS applications. Agricultural production – life quality. XXIX. Óvári Scientific Days. Proceedings p. 235; full paper on CD)
Neményi M. – Mesterházi P. (2002): Hozam- és talajellenállás térképezés és helyspecifikus tápanyag-visszapótlás a precíziós növénytermesztésben. (Yield and soil draft monitoring and site-specific nutrient replacement.) Agrárinformatika 2002 (Agroinformatics 2002), 2002.09.27-28, Debreceni Egyetem, CD ROM, ISBN: 963 204 869 5.
Neményi M. – Mesterházi P. Á. – Kacz K. – Stépán ZS. – Pecze Zs. (2002): A GPS-re alapozott növénytermesztési technológiák műszaki háttere – lehetőségek és korlátok. (Engineering background of GPS based plant production technologies – possibilities and limitations. MTA Növénytermesztési Bizottság, II.
Növénytermesztési Tudományos Nap (Plant Production Board of the Hungarian Academy of Sciences, II. Scientific Day on Plant Production), proceedings.
Budapest. Szerk./Edit. Prof. Dr. Pepó Péter; 118-125.p.
Mesterházi P. Á. – Neményi M. – Maniak, S. – Kacz K. – Kovács A. – Stépán Zs. (2003): A legújabb fejlesztések a precíziós növénytermesztés műszaki feltételrenszerével kapcsolatban. (The latest development in connection with the engineering background of site-specific farming) Magyar Tudományos Akadémia Agrár-Műszaki Bizottság 27. Kutatási és Fejlesztési Tanácskozás (Agricultural Engineering Board of the Hungarian Academy of Science, XXVII. Researche and Development Symposium) Gödöllő, 2003. 01.21-22., proceedings, szerk. Dr. Tóth László; p.84-88.
English
Pecze Zs. – Neményi M. – Mesterházi P. Á. – Stépán Zs. (2001): The function of the geographic information system (GIS) in precision farming. IFAC/CIGR Fourth International Workshop on Artificial Intelligence in Agriculture (Preprints edited by Prof. I. Farkas) June 6-8, 2001. Budapest, p. 15-18.
Mesterházi P. Á - Neményi M. – Kacz K. – Stépán Zs. (2002): Compatibility of precision farming systems. International Conference on Agriculture Engineering, 2001. 06.30- 07.04, Budapest. „AgEng Full papers, posters and abstracts” CD, (02-PA-012). Edited by the Scientific Society of Mechanical Engineering (GTE) No. ISBN963 9058 15 7.
Mesterházi P. Á - Neményi M. – Kacz K. – Stépán Zs. (2002): Data transfer among precision farming systems. ASAE Annual International Meeting/CIGR World Congress, 2002. 07.28-31, Chicago, Illionis, USA; Paper N# 021047; CD- ROM Published by the American Society of Agricultural Engineers St. Joseph.
Michigan.
Mesterházi P. Á. – M., Neményi – S. Maniak (2003): Weed monitoring by infrared camera and panoramic annular lens. Programme Book of the joint conference of ECPA – ECPLF (Berlin, Germany, 2003. 06. 15-19.), p 493-494, edited by A. Werner and A. Jarfe.
Mesterházi P.Á. – S. Maniak – Neményi M. – Stépán Zs. (2003): Site-specific soil draft measurement and weed monitoring. Conference paper for the ISTRO Conference 2003, Brisbane, Australia, 13-18th July 2003. p743-748, ISBN 0-646- 42496-3.
Mesterházi P. Á - Neményi M. – Kovács A. - Kacz K. – Stépán Zs. (2003):
Development of the site-specific nutrient replacement. 14th International Symposium of Fertilizers (CIEC), Fertilizers in context with resource management in agriculture. Proceedings, Volume 1, p288-295.