Impact of urbanization on abundance and phenology of caterpillars and consequences for breeding in an insectivorous bird
GABOR SERESS,1,6TAMAS HAMMER,1VERONIKABOKONY ,2ERNO}VINCZE,3BALINT PREISZNER,4IVETTPIPOLY,1 CSENGESINKOVICS,3KARLL. EVANS,5ANDANDRAS LIKER1,3
1Department of Limnology, University of Pannonia, Veszprem, Hungary
2Lend€ulet Evolutionary Ecology Research Group, Plant Protection Institute, Centre for Agricultural Research, Hungarian Academy of Sciences, Budapest, Hungary
3MTA-PE Evolutionary Ecology Research Group, University of Pannonia, Veszprem, Hungary
4Balaton Limnological Institute, Centre for Ecological Research, Hungarian Academy of Sciences, Tihany, Hungary
5Department of Animal and Plant Sciences, University of Sheffield, Sheffield S10 2TN, United Kingdom
Abstract. Urbanization can have marked effects on plant and animal populations’ phenology, population size, predator–prey, interactions and reproductive success. These aspects are rarely studied simultaneously in a single system, and some are rarely investigated, e.g., how insect phenology responds to urban development. Here, we study a tri-trophic system of trees, phytophagous insects (caterpillars), and insectivorous birds (Great Tits) to assess how urbanization influences (1) the phe- nology of each component of this system, (2) insect abundance, and (3) avian reproductive success. We use data from two urban and two forest sites in Hungary, central Europe, collected over four consecu- tive years. Despite a trend of earlier leaf emergence in urban sites, there is no evidence for an earlier peak in caterpillar abundance. Thus, contrary to the frequently stated prediction in the literature, the earlier breeding of urban bird populations is not associated with an earlier peak in caterpillar availabil- ity. Despite this the seasonal dynamics of caterpillar biomass exhibited striking differences between habitat types with a single clear peak in forests, and several much smaller peaks in urban sites. Cater- pillar biomass was higher in forests than urban areas across the entire sampling period, and between 8.5 and 24 times higher during the first brood’s chick-rearing period. This higher biomass was not associated with taller trees in forest sites, or with tree species identity, and occurred despite most of our focal trees being native to the study area. Urban Great Tits laid smaller clutches, experienced more frequent nestling mortality from starvation, reared fewer offspring to fledging age, and their fledglings had lower body mass. Our study strongly indicates that food limitation is responsible for lower avian reproductive success in cities, which is driven by reduced availability of the preferred nestling diet, i.e., caterpillars, rather than phenological shifts in the timing of peak food availability.
Key words: arthropod; breeding phenology; caterpillar biomass; food limitation hypothesis; frass; nestling food;
nestling mortality; trophic mismatch; urban birds.
INTRODUCTION
Urban animal populations often differ from populations living in natural habitats in their life history, demography, and reproductive success (Sepp et al. 2017). Several bird species lay earlier in urban areas, and it is hypothesized that in species that primarily feed their offspring with phy- tophagous insects earlier breeding is an adaptation to the earlier seasonal peaks in food availability in response to urban heat island effects (Vaugoyeau et al. 2016). Although birds’ reproductive success may be either increased, decreased, or not affected by urban development, this depends on the species’characteristics (Marzluff et al. 2016, Tomasevic and Marzluff 2017, Kettel et al. 2018), with urban populations of insectivorous birds tending to have smaller clutches, and to produce fewer fledglings that have lower body mass compared to rural populations (Chamber- lain et al. 2009, Seress et al. 2012). These differences in reproductive success may be driven by changes in a range of
environmental conditions, including temperature, food avail- ability, nest predation, air pollution, and light pollution, but the precise nature of the mechanisms involved remain unclear (Gil and Brumm 2014). The decreased quantity and quality of green space in cities may reduce the abundance of phytophagous arthropods (New 2015), which are the pri- mary source of nestling and adult food in many bird species, and this may consequently lead to decreased avian reproduc- tive success in urban environments as proposed by the food- limitation hypothesis. Reduced availability of these preferred food items may result in smaller clutch sizes due to food lim- itation of egg-laying females, and also reduce nestling growth and survival (Chamberlain et al. 2009, Seress and Liker 2015). For cavity-nesting birds, natural food availabil- ity is likely to be a particularly important determinant of breeding success because they experience relatively low nest predation rates in natural (Martin 1995) and also in urban- ized areas (Tomasevic and Marzluff 2017, Vincze et al.
2017), hence are less sensitive to variation in nest predation risk along the urban-rural gradient than species with more open nests.
So far, few studies have simultaneously investigated natu- ral food availability (i.e., abundance of specific prey items) and breeding success of urban insectivorous birds, and in Manuscript received 24 July 2017; accepted 10 April 2018. Corre-
sponding Editor: John M. Marzluff.
K.L. Evans and A. Liker are joint last authors of this study.
6E-mail: seressg@almos.uni-pannon.hu
1143
©
general, their results suggest a link between the scarcity of arthropods and decreased breeding success in birds. For example, the availability of arthropod prey for Florida Scrub-jaysAphelocoma coerulescenswas 50% lower in sub- urbs than in natural scrub habitats, with a higher rate of brood reduction in suburbs (Shawkey et al. 2004), and simi- larly, suburban House Sparrows had lower breeding success and provided fewer large arthropod prey items to their nest- lings compared to rural conspecifics (Seress et al. 2012).
Great Tits (Parus major) and Blue Tits (Cyanistes caeruleus) primarily feed their nestlings caterpillars (lepidopteran lar- vae, mainly moths) collected in tree canopies (Perrins 1991), and have been well studied in urban sites, where they often have reduced reproductive success (Solonen 2001, Marciniak et al. 2007, Glazdalski et al. 2015, Wawrzyniak et al. 2015, Bailly et al. 2016). Some of these studies also investigated caterpillar availability but reported lower, higher or similar caterpillar abundance in urban habitats relative to natural breeding sites (see Table S1 for details). The population sizes of other arthropod taxa also exhibit heterogeneous responses to urbanization (McIntyre 2000, Raupp et al.
2010, Jones and Leather 2012, New 2015, Leong et al.
2016). There is thus insufficient understanding of how urbanization influences the availability of natural prey for insectivorous birds.
Phenology is a key factor influencing the availability of lepidopteran larvae for nestlings (Perrins 1991, Verboven et al. 2001), and this seasonality may also be influenced by urbanization. The urban heat island effect can significantly advance vegetation phenology (Neil and Wu 2006) and the onset of reproductive cycles in many arthropods including phytophagous species (Forrest 2016). In contrast, the appearance of 28 European butterfly species in human set- tlements is 9–10 d later than in forests and agricultural areas (Altermatt 2012), and urbanization is associated with phe- nological delays in first and peak appearance dates of sev- eral North American butterfly species (Diamond et al.
2014). The dates of arboreal caterpillar biomass peaks, how- ever, did not differ consistently between an urban parkland area and a woodland habitat in central Poland (Wawrzyniak et al. 2015; see Appendix S1: Table S1). Thus, understand- ing how and to what extent urbanization influences arthro- pod prey phenology and abundance is far from sufficient, even though such changes could have severe impacts on urban birds’ breeding success. To maximize reproductive success, birds often time their breeding to synchronize nest- lings’ maximal food demand with the maximal food avail- ability (Van Noordwijk et al. 1995, Hegyi et al. 2013). Thus, if the timing of the peak abundance of nestling food is chan- ged in urban environments, this may lead to a mismatch between the nestling period and the peak of arthropod food if the birds are not able to adjust their timing of breeding as well. Therefore, changes in the seasonal pattern of arthro- pod abundances will influence the timing of peak food avail- ability and may thus influence the optimal timing and success of avian breeding attempts.
In this study, our primary objective is to integrate data on leaf emergence, caterpillar biomass and phenology, and avian breeding success into a single comprehensive study assessing how urbanization influences the phenology of a multi-trophic system, caterpillar abundance and the
resultant consequences for avian breeding success. To do so, we intensively and regularly sampled caterpillar abundance during the avian breeding cycle and replicated our study over four years, with contrasting meteorological conditions, using two urban and two forest study sites. This provides a robust comparison of caterpillar biomass and its seasonal dynamics between urbanized and natural habitat types, based on spatially and temporally more extensive sampling than most of the earlier studies (Appendix S1: Table S1).
Based on the findings of earlier studies discussed above, we test four hypotheses: (1) trees’ leaf emergence date is advanced in urban areas; (2) urban and forest caterpillar populations exhibit divergent phenological patterns; (3) urban Great Tits breed earlier than their forest conspecifics;
and (4) the food limitation hypothesis, i.e., that reduced caterpillar biomass in urban areas compared to forests con- tributes to lower avian reproductive success. In meeting these core objectives, we also assess if tree height and tree species identity contribute to differences in caterpillar bio- mass between urban and forest habitats.
METHODS
Study sites and years
We conducted our study from 2013 to 2016 in Hungary, in two forest and two urban sites (Appendix S1: Fig. S1).
Forest sites represented a mixed beech Fagus sylvaticaand hornbeam Carpinus betulus forest (Szentgal) and a mixed downy oak Quercus cerris and South European flowering ashFraxinus ornusforest (Vilma-puszta); these are two com- mon types of forests in Hungary (Borhidi 2003). The two forest sites are mature woodlands located 2–3 km away from the nearest human habitation. Urban sites (Veszprem and Balatonf€ured) are within typical Hungarian towns and included public parks, a cemetery, a bus station, and univer- sity campuses within a landscape dominated by buildings and impervious surfaces.
Weather conditions differed markedly between years. In 2013, the pre-breeding season was colder than usual with snow cover in early April (Appendix S1: Fig. S2). Con- versely, the pre-breeding season was unusually warm in 2014 but, in 2015 and 2016, was more typical for the study area (Appendix S1: Fig. S2). From April to June, the mean monthly temperatures were similar in the four study years, and close to recent long-term means (Appendix S1: Fig. S2).
Selected tree species
We identified the most common tree species at each study site (by field survey conducted in 2013) and used these spe- cies for phenological monitoring of leaf emergence and caterpillar biomass. By sampling common tree species within each of the four study sites (Appendix S1: Table S2), we assessed differences in caterpillar abundance and phenol- ogy between urban and rural habitats as experienced by the birds. There was little similarity in the composition of tree assemblages across the four sites (indeed the composition of urban and rural tree communities is typically highly diver- gent, e.g., Dunn and Heneghan 2011) and the selected tree species therefore varied across sites. We used the two most Vol. 28, No. 5
common tree species at each of our forest sites (except the first study year, 2013, in which we used only the single most common species in Vilma-puszta). Urban areas contained more tree species so we selected the three commonest species at our two urban sites. All the selected tree species are native to Hungary except horse chestnutAesculus hippocastanum, which was introduced several hundred years ago. All species, including horse chestnut, are frequently used by foraging tits during the breeding season (our personal observations;
Grabenweger et al. 2005).
Tree phenology
We monitored leaf emergence phenology between Febru- ary and April in 2014, 2015, and 2016 using 10 trees per spe- cies at each site. One of us (T. Hammer) visited them regularly with 2–7 d intervals, with shorter intervals closer to the timing of leaf emergence. For each tree we calculated the leaf emergence date as the date when>50% of buds had emerged such that the leaves’shape was clearly recognizable but they were not yet fully grown (for a similar approach see Vitasse 2013).
Frass sample collection and processing
We followed the common approach of using frass (insect droppings) biomass as an index of caterpillar biomass (Tinbergen and Dietz 1994). We collected frass from 6 to 10 (2013) or 6 (2014–2016) mature individuals per tree species in each study site (Appendix S1: Table S2); all trees used for frass collection were used to monitor leaf emer- gence. We monitored the same individual trees throughout the study except that we changed one maple Acer pla- tanoidestree in Veszprem due to logistical reasons. One of us (T. Hammer) estimated canopy height of trees from which frass was collected to the nearest 1 m by eye (after initial training and with the aid of a 3-m measuring stick placed against the tree trunk as a reference). Note that the estimated tree heights in our study had a wide range (8–25 m, interquartile range: 12–18 m), and canopy height is typically highly correlated with canopy volume (Troxel et al. 2013).
We conducted frass sampling between March and June, i.e., covering the Great Tits’ entire breeding season at each site, following standard protocols (Tinbergen and Dietz 1994, Glazdalski et al. 2015). To collect frass, we used frass- fall traps (cheese cloth net attached to a 0.590.5 m woo- den frame) suspended under the sampled trees’ canopy (always below the lowest branch of the canopy in a position to avoid overlapping canopies of adjacent trees). Conse- quently, the amount of vegetation above the frass traps is determined by tree height. We used one frass trap per tree and emptied traps once every 3–5 d (mean SD:
3.69 1.72). We stored frass samples at room temperature, separated frass from non-frass particles, measured frass mass, and converted it to hourly caterpillar biomass (mg/h) following Tinbergen and Dietz (1994). We collected and measured a total of 1,084, 1,271, 1,246, and 1,204 frass sam- ples in 2013, 2014, 2015, and 2016, respectively. For more details on frass sample collection and processing and calcu- lation of caterpillar biomass, see Appendix S2.
Breeding phenology and success of Great Tits We monitored Great Tits breeding in nest boxes at least once every 3–4 d (twice per week) from 1 March until the end of June, when birds finished breeding at each study site.
We recorded the laying date of the first egg and the number of eggs and chicks at each nest check. When we found more than one egg during a nest check, we back-calculated the first egg date by assuming that one egg was laid per day. The smallest observed clutch size was four, ensuring that we could calculate first egg dates to within one day of accuracy.
We ringed and weighed nestlings just prior to fledging, i.e., when they were 14–16 d old (taking the day of hatching as day 1; mean SE; urban sites, 15.15 0.02 d; forest sites, 15.090.02 d). We captured and individually marked par- ents during brood rearing using one metal and three plastic color rings (Seress et al. 2017). We only analyzed data from first clutches, to provide results comparable to other studies of reproductive phenology and success of urban Great Tits (Solonen 2001, Wawrzyniak et al. 2015, Bailly et al. 2016).
We regarded a clutch as the first breeding attempt of a pair if it was initiated before the date of the first egg laid in the earliest second clutch at that site by an individually identifi- able (i.e., color-ringed) female that successfully raised her first clutch (i.e., fledged at least one young) in that year.
Replacement clutches (i.e., clutches laid after failure of the first breeding attempt) were rare and excluded from the analyses. In this study, first breeding attempts produced the majority of fledglings in both habitat types in all years (2013, 82% and 66%; 2014, 75% and 77%; 2015, 92% and 96%; 2016, 71% and 77% in urban and forest habitats, respectively). We monitored a total of 63 (36 urban, 27 for- est), 120 (51 urban, 69 forest), 122 (60 urban, 62 forest), and 112 (63 urban, 49 forest) first clutches in the four study sites in 2013, 2014, 2015, and 2016, respectively (see Appendix S1: Table S3 for more details).
Statistical analyses
We analysed the data from each study year separately (un- less stated otherwise), and we report means with standard errors. We checked the validity of statistical assumptions for each linear model by inspecting residual plots for linearity, normality, and homoscedasticity (Zuur et al. 2009), and by calculating the variance inflation factor (VIF) where rele- vant (i.e., in models with more than one continuous explana- tory variable) to assess multi-collinearity. Following Whittingham et al. (2006), we report the results of full mod- els throughout (i.e., without model selection), except in two specific analyses. We define the statistical significance level at 0.05 and refer to results where 0.05 <P<0.1 as“margin- ally non-significant.” All analyses were conducted in R v3.3.1 (R Core Team 2016).
Tree phenology.—To test for habitat differences in tree phe- nology, we used a linear mixed model (LME, package nlme) in which leaf emergence date of individual trees (expressed as the number of days elapsed from 1 January) was the response variable, habitat type was the predictor (urban vs.
forest), and tree species was included as random factor. We do not report the results from models that include study site
as an additional random factor because preliminary analy- ses demonstrated that doing so did not improve the models’ fit (as assessed by likelihood ratio tests).
Caterpillar phenology.—We used three approaches to describe seasonal changes in caterpillar biomass (mg/h), transformed as log10(x +0.0001) before the analyses. First, we fitted LME models separately for each site and year because seasonal changes in caterpillar biomass varied across the four years, and in some years also differed between study sites of the same habitat type. In these mod- els, we used caterpillar biomass as the response variable, including data from all trees in each site, and treated each sample as a data point. Sampling date (number of days since 1 January) was included as a predictor, and tree species and individual tree identity (i.e., tree ID) were included as nested random factors. To model non-linear seasonal changes (i.e., to allow for a peak), we compared this linear model to a model that also included the quadratic term of date, and to a model that also included the quadratic and cubic terms of date. For each site in each year, we selected the best model based on the results of likelihood ratio tests; i.e., we chose the model that had significantly better fit than the rest if the test showed significant difference in model fit, while we selected the simplest model if the fits of models were not sig- nificantly different (Zuur et al. 2009). Second, we fitted models for each site and year using the cardidate R package (Rolinski et al. 2015). This package fits curves to environ- mental time series using Weibull-functions, and compared to the linear model approach has the advantage of being able to identify seasonal trends with multiple peaks (see Rolinski et al. [2007] for details of the method). We used the peak- window function (with default settings) that applies a heuristic peak detection algorithm to identify separate peaks within a single season. In this analysis, the response variable was the mean caterpillar biomass across all trees for each sampling date (separately for each site). Finally, we com- pared peak caterpillar biomass dates of individual trees (i.e., the date when the estimated caterpillar biomass was maxi- mal for a given tree) between habitats using LME models in which peak date (using a single data point from each indi- vidual tree) was the response variable and included habitat type as a predictor and site and tree species as nested ran- dom factors. Since variance in peak dates differed strongly between habitats (see Results) we used LME models that allow heterogeneous variances (varIdent function of the nlme package).
Caterpillar biomass.—To compare the quantity of caterpillar biomass between habitats, we built LME models of caterpil- lar biomass (mg/h), with habitat type as a predictor; random factors were tree species nested in study site and, when mul- tiple samples from the same trees were analysed, the ID of individual trees nested within tree species. First, we used this model structure to test for habitat differences in caterpillar biomass estimated during the whole sampling period (March–June), treating the biomass estimate from each frass sample as an individual data point (hence tree ID was included as random factor in the model). Second, we tested the habitat difference in caterpillar biomass measured dur- ing the brood-rearing period of the first broods. This
analysis was similar to the preceding one except that we used only the frass samples collected during the brood-rearing period (defined for each site and year as from the hatching date of the first brood until the date at which the last of the first broods was 14 d old). Finally, we tested for habitat dif- ferences in the maximum caterpillar biomass of individual trees (thus tree ID was not included as random factor).
Effects of tree characteristics on caterpillar biomass.—Addi- tionally, we tested whether caterpillar biomass (mg/h) was related to two characteristics of the sampled trees: tree species and canopy height. We used LME models in which caterpillar biomass was the response variable (using all data, i.e., each sample of each individual tree), the species and canopy height of sampled trees were the predictors, and site and tree ID were included as nested random factors. Pairwise compar- isons between tree species were conducted by Tukey post-hoc tests (using glht function of the multcomp R package).
Finally, we also compared canopy height of our focal trees between habitats by using LME models that contained canopy height (m) as the response variable, habitat type as predictor, and study site and tree species as nested random factors; one model was run for the 58 trees used in 2013 and one model for the 60 trees that were used in 2014–2016 (Appendix S1: Table S2).
Breeding phenology and breeding success of Great Tits.—The timing of breeding (laying date of the first egg), clutch size, number of fledglings and fledgling body mass were analysed using LME models with study site as a random factor in each model. For the laying date analysis, the response vari- able was date (i.e., the number of days elapsed from 1st of January until the laying of the first egg for each clutch), and the model contained habitat type as a predictor. In the clutch size analysis, the response variable was the maximum number of eggs recorded for each clutch, predictors were habitat type and laying date, and we excluded nests that were deserted during egg laying (n=11 clutches).
To investigate breeding success, first we compared the proportion of successful and failed nests (defined respec- tively as fledging at least one young and producing no fledg- lings) between urban and forest habitats using av2test. In this analysis, we included all nests with at least one laid egg and excluded cases when complete clutch or brood loss may have occurred due to the monitoring process (n=7; e.g., when a nest box fell or when chick mortality occurred soon after capturing a parent on the nest). Second, we compared the number of fledglings between habitats by LME models in which the response variable was the number of chicks alive when the brood was ringed (i.e., a few days before fledging), and predictors were habitat type and laying date.
In this analysis we used only hatched nests, i.e., those in which at least one nestling hatched and we excluded nests in which nestling mortality may have occurred due to the mon- itoring process (n=5 broods). Finally, we analysed fledgling body mass (at ringing age) as the response variable; the pre- dictors were habitat type, hatching date, number of fledg- lings at ringing, fledgling age at ringing, and brood ID nested within site (as random factors).
To model potential differences in seasonal effects on breeding success in urban and forest populations, we added Vol. 28, No. 5
a habitat9laying date interaction to the above models of clutch size, number of fledglings, and fledgling body mass.
When the interaction term was not significant, the majority of cases, we only present the results of models that exclude the interaction term to aid interpretation of the main effects.
The food limitation hypothesis predicts greater frequency of nestling starvation in urban areas. We thus carefully examined all cases of nestling mortality in our dataset and identified broods in which chicks probably died from starva- tion as those in which brood size decreased during the brood rearing period, and there was no evidence of (1) nest preda- tion (evidenced by predator marks on chicks or damage to the nest box or nest structure), (2) nest desertion (death, but not the disappearance, of the entire brood between two con- secutive nest checks), or (3) direct mortality effect of the monitoring procedure or adverse weather effects (e.g., the nest box fell from the tree or the nest was waterlogged); 32 broods experienced these conditions. Thus, we had 360 broods and 3,316 nestlings, from which only a very small number of broods (5.5%) and nestlings (1.7%) exhibited signs of disease (e.g., pox lesions, diarrhea) or had heavy ectoparasite loads. These parasitized or diseased nestlings were not more likely to occur in broods in which we recorded starvation-related mortality (7 out of 96 broods) than in broods that did not experience starvation-related mortality (13 out of 264 broods; v2 test, v21=0.752, P=0.386). For this reason, and also because disease and parasites could interact with starvation by strengthening the effect of each other, we did not exclude these broods from the starvation-related mortality analyses.
Starvation-related nestling mortality was a rare event (96 out of 360 broods), so its robust analysis using a binary logistic framework would have required the use of penalized likelihood estimates or similar methods; such models cannot accommodate the random effects structure of our data. Fur- thermore, logistic models of our mortality data would suffer from over-dispersion and poor fit. Thus, we categorized broods into two groups, with and without starvation-related mortality, and compared the frequency of nests in which starvation-related mortality occurred between urban and forest habitats using Fisher’s exact test. To assess the valid- ity of our assumption that mortality was indeed related to starvation in these broods, we performed two additional analyses to confirm that mortality attributed to starvation was associated with smaller body size. First, using LME models we tested whether broods’mean body mass at ring- ing was lower in broods that experienced mortality before ringing compared to nests that did not; predictors were habi- tat type, laying date, fledgling age at ringing, and year and we applied site as random factor. Second, in some cases, we found chicks that died in the nest after ringing (n=87 chicks; predation events excluded), and we compared their body mass (measured at ringing) to those that successfully fledged from the nest; predictors were habitat type, laying date, and year and we applied brood ID nested in site as a random factor. Both of these analyses supported our classi- fication of starvation-related mortality. First, at the brood level, mean nestling body mass at ringing was lower in broods in which mortality attributed to starvation occurred before ringing (Appendix S1: Table S4a). Second, nestlings that died between ringing and fledging (i.e., were found dead
in the nest after ringing and their deaths could not be attrib- uted to predation or other causes unrelated to starvation) also had lower body mass at ringing than their siblings that successfully fledged, suggesting that starvation at the indi- vidual level predicted mortality (Appendix S1: Table S4b).
RESULTS
Tree phenology
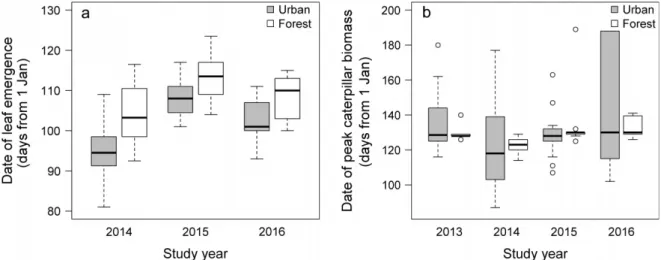
Urban trees had earlier leaf emergence than forest trees (mean differences SE; 2014, 8.9 3.4 d; 2015, 5.5 2.7 d; 2016, 5.73.3 d; Fig. 1a). These differences were statistically significant in 2014 (LME,F1,8=6.73,P = 0.032), marginally non-significant in 2015 (F1,8=3.99, P=0.081), and not significant in 2016 (F1,8=3.02, P=0.121).
Caterpillar phenology
Quadratic or cubic models of caterpillar biomass provided a better fit to the data than models that only included a lin- ear term for all sites and years (Appendix S1: Table S5), indicating that caterpillar biomass changes nonlinearly dur- ing the birds’ reproductive season. Fitted models (Fig. 2) indicated that forest sites typically exhibited more marked seasonal variation in caterpillar abundance, with the greatest difference in caterpillar biomass between forests and urban sites occurring during the seasonal peak in biomass. This pattern was less clear in 2013, i.e., the year with a cold early spring.
Models fitted by Weibull functions suggested similar habi- tat differences in the seasonal dynamics of caterpillar bio- mass (Appendix S1: Fig. S3). This method almost invariably detected a single large seasonal peak in caterpillar biomass for the two forest sites vs. three to five small peaks dispersed over the sampling periods for the urban sites. In 2016, two sites departed from this pattern. Only a single peak was detected at one of our urban sites (Balatonf€ured), which may be related to the consistently very low caterpillar bio- mass over the whole sampling period at this site in this year (Appendix S1: Fig. S3h). In the same year, two consecutive peaks were detected for one of the forest study sites (Szentgal, Appendix S1: Fig. S3j); the dip in biomass between these peaks occurred in a period with frequent and particularly heavy rainfalls that interrupted sample collec- tion and may also have temporarily washed caterpillars from the focal trees, reducing the effectiveness of our sampling method.
The date of peak caterpillar biomass did not differ consis- tently between urban and forest habitats. First, we deter- mined a single date of peak caterpillar biomass for each site and year combination as the date with the highest mean caterpillar biomass (Table 1). Although the low number of these site-level peak date estimates does not permit statisti- cal comparison, Table 1 shows that one of our urban sites (Balatonf€ured) was earlier, whereas the other (Veszprem) was later than at least one of the forest sites in three out of four years. In addition, the date of peak caterpillar biomass of individual trees did not differ between habitats (LME;
2013,F1,2=4.52,P=0.167; 2014,F1,2=0.256,P=0.663;
2015, F1,2=0.69, P=0.492; 2016, F1,2=0.11, P=0.772;
Fig. 1b). The variance in peak dates of individual trees was significantly higher in urban habitats than in forests in 2013, 2014, and 2016 (Levene’s test; 2013,F1,55=9.96,P=0.002;
2014, F1,58=21.62, P<0.001; 2016, F1,58=21.64, P<0.001), but there was no difference in 2015 (F1,58=1.13,P=0.292; Fig. 1b).
Caterpillar biomass
Caterpillar biomass during the whole sampling period was significantly higher in forests than in urban habitats in all four years (Table 2a): the difference was ~12.5-fold in 2013, 2.6-fold in 2014, 9.5-fold in 2015, and 11-fold in 2016 (Fig. 3a). We detected similar or even higher habitat differ- ences in caterpillar biomass in each year when the compar- ison was restricted to the brood-rearing period of first broods (2013, 10.5-fold; 2014, 8.5-fold; 2015, 11-fold; 2016, 24-fold; Table 2b, Fig 3b) and when we compared the maxi- mum caterpillar biomasses of individual trees (Table 2c, Appendix S1: Fig. S4).
Effects of tree characteristics on caterpillar biomass We found that caterpillar biomass differed significantly between tree species in all years (Appendix S1: Fig. S5;
LME; 2013, F8,40=12.94, P<0.001; 2014, F9,46=5.40, P<0.001; 2015, F9,46=12.63, P<0.001; 2016, F9,46=19.83, P<0.001). Pairwise post-hoc comparisons showed that urban tree species had significantly lower cater- pillar biomass than forest species in 17 out of 18 compar- isons in 2013, in 9 out of 24 comparisons in 2014, in 22 out of 24 comparisons in 2015, and in all of the 24 comparisons in 2016, whereas only five out of 77 comparisons between tree species within the same habitat type were significant (Appendix S1: Fig. S5, Table S6). This means that the higher urban caterpillar biomass was not restricted to specific tree species pairs (e.g., in 2016 all four forest tree species had higher caterpillar biomass than all six urban tree species).
Moreover, the comparisons of two oak (Quercus) species between urban and forest habitats showed higher caterpillar biomass at forest sites in all except one year (Appendix S1:
Fig. S5, Table S6).
Canopy height had a significant positive effect on cater- pillar biomass in 2013 (LME,F1,40=8.90,P=0.005) and 2016 (F1,46=5.71,P=0.021), but not in 2014 (F1,46=1.69, P=0.199) and 2015 (F1,46=1.04, P=0.313). Canopy height of the sampled tree individuals did not differ signifi- cantly between urban and forest habitats (LME; 2013, F1,2<0.01, P=0.995; 2014–2016,F1,2=0.01, P=0.931).
As all frass traps were placed below the canopy of each tree, this result suggests that differences in the amount of frass collected in urban and forest sites are not simply a function of sampling taller trees, which have more foliage, at forest sites.
Breeding phenology and breeding success of Great Tits Great Tits started to lay on average 6–7 d earlier in urban sites than in forests. This difference was significant in 2013 and 2016, non-significant in 2015, and was only 2 d and also statistically non-significant in the unusually warm spring of 2014 (Table 3a, Fig. 4a; Appendix S1: Table S3). Urban pairs had significantly smaller clutches than forest pairs in all years (Table 3b, Fig. 4b, Appendix S1: Table S3; 2013, by 3 eggs; 2014, by 1.2 eggs; 2015, by 3.4 eggs; 2016, by 3.6 eggs). In 2014, 2015, and 2016, there was a seasonal decline in clutch size of first broods in both habitat types, while we detected no such effect in 2013 (Table 3b; Appendix S1:
Table S3).
Complete nest failure was rare (n=37 out of the 398 nests in the four years) but was significantly more frequent in urban (n=26 out of the 196 nests, 13.3%) than in forest (n=11 out of the 202 nests, 5.4%) habitats (v21=7.214, P<0.007). Among pairs that hatched at least one chick, urban pairs fledged significantly fewer offspring per breed- ing attempt than forest pairs in 2013, 2015, and 2016 (mean difference of 4.8, 5.4, and 5.0 fledglings, respectively), while FIG. 1. (a) Differences in leaf emergence dates (measured as the date when>50% of the sampled leaves were fully unfolded on a tree) and (b) variation in the date of maximum caterpillar biomass between urban (gray) and forest (white) trees in the study years. Medians and interquartile ranges are indicated by thick middle lines and boxes, respectively, while the whiskers represent maximum and minimum values and the open circles refer to the outliers.
Vol. 28, No. 5
in 2014 the difference between urban and forest habitats was much smaller (1.4 fledglings) and marginally non-significant (Table 3c, Fig. 4c; Appendix S1: Table S3). Earlier broods produced more fledglings than later broods in 2015 but not in other years (Table 3c).
Fledglings’ body mass was significantly lower in urban broods than in forests in 2013, 2015, and 2016 (by 3.2, 3.4, and 3.3 g per chick, respectively), whereas the habitat differ- ence was smaller (1.6 g) and marginally non-significant in 2014 (Table 3d, Fig. 4d; Appendix S1: Table S3). Fledgling mass in later broods, compared to earlier ones, was signifi- cantly higher in 2013, but significantly lower in 2014 and 2015, whereas the effect of laying date was non-significant in 2016 (Table 3d).
The habitat9laying date interaction was non-significant in all but one of the above models: in 2014, the body mass of fledglings decreased more steeply over the season in urban sites than in forests (F1,100=8.98,P=0.003).
The proportion of broods that experienced starvation- related nestling mortality was significantly higher in urban than forest habitats (v21=71.381, P<0.001; for the four years separately see Appendix S1: Table S7).
DISCUSSION
Globally, urbanization is one of the most rapidly increas- ing causes of habitat loss (Seto et al. 2012) and is a leading cause of species’ population declines and increased extinc- tion risk (Mcdonald et al. 2008). These impacts are often the result of large-scale alterations in habitat types, but more subtle effects can also arise through urban development altering biotic interactions including those between plants, phytophagous consumers, and their predators (Kozlov et al.
2017). Numerous environmental factors associated with towns and cities, including urban heat island effects that can be similar to those of climate change (McCarthy et al.
2010), could alter the phenology of each component of the system (Forrest 2016, Li et al. 2016) and have consequences for demography and population dynamics. In this study, we used data from multiple sites and years to assess if urbaniza- tion alters (1) the phenology of a tri-trophic plant–caterpil- lar–insectivorous-bird system, (2) caterpillar abundance, and (3) has resultant impacts on avian reproductive success.
Despite a consistent tendency for urban trees to leaf ear- lier than forest trees, site-level and individual tree-level peak dates of caterpillar biomass did not show a consistent differ- ence between habitat types. Nevertheless, we found strong differences in the seasonality of caterpillar biomass between urban and forest sites. The dates of peak caterpillar biomass for individual trees were spread over a much longer period in cities than in forests, and while forest sites were typically characterized by a single large peak in caterpillar biomass, urban sites had several much smaller peaks throughout the season. These divergent seasonal dynamics contributed to the substantially lower caterpillar biomass in urban sites than forests. The food limitation hypothesis (Chamberlain et al. 2009, Bailly et al. 2016) predicts that this reduced availability of invertebrate prey items will adversely influence breeding success in insectivorous birds. Indeed, we found that Great Tits in urban environments, despite breeding ear- lier than their forest-dwelling conspecifics laid smaller FIG. 2. Seasonal changes in caterpillar biomass (mg/h) over the
whole sampling period in the urban sites (Veszprem and Bala- tonf€ured) and forest sites (Szentgal and Vilma-puszta) in the four years. Dots and whiskers show the meanSE of daily caterpillar biomasses for illustrative purpose only, because the models were fit- ted using all samples (seeStatistical analyses: Caterpillar phenology and Appendix S1: Table S5 for details). The best fitting models are indicated by the curves fitted on the data. The horizontal lines at the bottom of the panels show the Great Tit brood-rearing period (for first broods) for each study site
TABLE1. Peak dates of caterpillar biomass in urban and forest habitats in the four study years
Site
Date of maximum daily mean biomass
2013 2014 2015 2016
Veszprem (urban) 117 140 132 188
Balatonf€ured (urban) 128 118 128 115
Szentgal (forest) 128 120 132 130
Vilma-puszta (forest) 129 126 130 138
Notes:Within each site, peak date was estimated as the date with the highest mean caterpillar biomass (calculated across all trees).
Dates are given as number of days since 1 January.
clutches, fledged fewer offspring, produced fledglings with lower body mass, and had a greater frequency of starvation- related nestling mortality.
The significantly higher caterpillar biomass we found in forests vs. cities provides a robust demonstration of reduced availability of an important food source for urban birds dur- ing the nesting season. Our results are based on extensive sampling of two sites per habitat type over the whole breed- ing period and were consistent across four study years and three measurements of caterpillar availability (whole sam- pling period, brood-rearing period, and maximal biomass per tree). The effect of urbanization on caterpillar availabil- ity was marked, for example during the brood-rearing per- iod (which is probably the most sensitive period of Great Tits’ reproduction to food availability) caterpillar biomass was 8.5 to 24 times higher in forests compared to urban sites. These effect sizes are greater than those previously reported by other studies with less intensive sampling (Isaks- son and Andersson 2007, Marciniak et al. 2007, Glazdalski et al. 2015). We have evidence, albeit temporally limited, that the reduced caterpillar abundance in urban environ- ments strongly influences Great Tit nestling diet, with cater- pillars comprising 93% of food items delivered to Great Tit nestlings at one of our forest sites but just 58% at one of our urban sites (Appendix S1: Fig. S6, Sinkovics 2014). We did not measure chick provisioning rates or total biomass of food delivered to nests, so it is possible that adults attempt to compensate for reduced availability of caterpillars by pro- viding alternative prey items. While further studies that assess this would be useful, we found that urban nestlings were smaller and suffered from increased rates of starvation- induced mortality unrelated to predation, nest desertion, extreme weather, ectoparasites, or disease. The majority of the mortality events were partial brood losses, for which the role of starvation is also corroborated by two lines of addi- tional evidence: first, nestlings’ body mass was reduced in broods that experienced mortality not attributable to other causes of death, and second, nestlings that appeared to have
died from starvation shortly after ringing already had decreased body mass at ringing. These results strongly sug- gest that any compensation to mitigate the adverse effects of reduced caterpillar abundance in cities is unable to prevent higher rates of starvation-induced mortality in urban areas.
This could be because alternative non-caterpillar prey items may also occur at lower abundances in urban areas (Marci- niak et al. 2007) or because alternative prey items provide less protein or important nutrients (such as carotenoids, essential fatty acids, or vitamin E) than the preferred cater- pillar prey (Graveland and Van Gijzen 1989, Eeva et al.
2010, Razeng and Watson 2015).
Other studies have hypothesized that urban and non- urban birds experience differences in food availability because of an earlier seasonal peak in caterpillar abundance in urban environments that, due to other constraints on tim- ing of breeding, urban birds cannot exploit (Deviche and Davies 2013, Vaugoyeau et al. 2016). We found no evidence to support this hypothesis, as dates of peak caterpillar abun- dance were not earlier at urban sites in our study, similarly to the finding of Wawrzyniak et al. (2015), and there were substantial differences in peak caterpillar abundance between urban and forest sites. Our findings thus strongly indicate that reduced prey availability for urban insectivo- rous birds is driven primarily by a generally lower abun- dance of caterpillars rather than changes in invertebrate phenology induced by urbanization.
Urban environments may provide less favorable feeding conditions for phytophagous insects due to the higher occur- rence of nonnative tree species that provide low quality food sources for arthropods and usually support fewer lepi- dopteran species than native plants (Clem and Held 2015, New 2015). In our study system, however, the urban tree assemblage is dominated by native species, and a common tree at one of our forest sites, beech is widely considered to have a limited ability to support phytophagous insects (Csoka 2004). Forest trees also usually had larger caterpillar biomass than urban trees, regardless of species. Therefore, TABLE2. Differences in caterpillar biomass (mg/h) between urban and forest habitats
Model parameters
2013 2014 2015 2016
bSE t P bSE t P bSE t P bSE t P
a) Biomass over the whole sampling period† Intercept
(urban mean)
0.170.06 3.10 0.002 0.280.06 4.57 <0.001 0.240.14 1.74 0.081 0.150.05 3.05 0.002 Habitat 1.100.09 11.35 0.008 0.420.10 4.33 0.049 0.980.20 4.69 0.042 1.050.08 13.56 0.005 b) Biomass over the brood-rearing period‡
Intercept (urban mean)
0.440.07 6.52 <0.001 0.440.10 4.23 <0.001 0.530.23 2.35 0.019 0.070.10 0.68 0.498 Habitat 1.020.12 8.63 0.013 0.930.17 5.66 0.029 1.040.33 3.18 0.086 1.380.16 8.86 0.013 c) Maximum biomass of individual trees§
Intercept (urban mean)
1.200.10 12.20 <0.001 1.000.10 9.56 <0.001 1.060.17 6.13 <0.001 0.650.11 6.13 <0.001 Habitat 0.880.17 5.22 0.035 0.900.16 5.46 0.032 1.140.27 4.16 0.053 1.270.17 7.63 0.017 Notes:Biomass was measured as mg/h; values were log-transformed. The“habitat”parameter shows the forest–urban biomass difference on a log10scale, so positive estimates mean higher values in forest sites and a parameter estimate of 1.0 corresponds to a 10-fold difference.
Results are from linear mixed models. Statistically significant (P<0.05) habitat differences are highlighted in boldface type and marginally non-significant habitat effects (0.05< P<0.10) are shown in italic type.
†Number of frass samples, total/urban/forest: 2013: 1,084/750/334; 2014: 1,271/776/495; 2015: 1,246/876/370; 2016: 1,204/794/410.
‡Number of frass samples, total/urban/forest: 2013: 546/375/171; 2014: 527/366/161; 2015: 624/410/214; 2016: 469/325/144.
§Number of frass samples, total/urban/forest: 2013: 57/36/21; 2014: 60/36/24; 2015: 60/36/24; 2016: 60/36/24
Vol. 28, No. 5
while we cannot rule out the possibility that some of our focal urban tree species provide low quality resources for caterpillars, it seems unlikely that this is a major cause of reduced lepidopteran abundance in urban sites and suggests that other factors are probably driving this pattern (see Management implications).
While peak caterpillar availability was not earlier in urban environments than forests, we still found strong evidence that urbanization influences seasonal patterns in caterpillar biomass. The single strong peak in caterpillar abundance that we found in forests is well documented (Zandt 1994, Verboven et al. 2001, Marciniak et al. 2007). Studies on urban caterpillar phenology are rare, and while Marciniak et al. (2007) provide some evidence for the lack of a marked, single peak in caterpillar abundance in an urban parkland, this was not confirmed by statistical analysis. Our result that urban sites have multiple smaller caterpillar peaks over the season is thus a novel finding, and this pattern was consis- tent across the two urban sites and four years in our study.
The occurrence of multiple urban peaks that reduce
synchrony in the timing of peak caterpillar biomass is fur- ther supported by our finding that urban trees had signifi- cantly greater variance in their individual peak dates of caterpillar biomass than forest trees. One potential explana- tion for the different seasonal patterns is that the optimal plant food for caterpillars, i.e., young leaves, might be avail- able for a longer period in urban compared to forest habi- tats, perhaps because of the greater diversity of urban tree species with each species leafing at different time periods.
However, our data do not support this as variance in the time of leaf emergence was similar in the two habitats and a single caterpillar peak is observed at forest sites despite sam- pling more than one tree species at each site. A second potential explanation for the multiple peaks in urban cater- pillar biomass is that these arise from a more diverse lepi- dopteran community, with different species peaking in abundance at distinctive times. This seems unlikely as urban moth communities are typically less diverse than rural ones, although it is plausible that the urban moth assemblage is dominated by generalist species that have multiple genera- tions per year (Lizee et al. 2015, New 2015). Third, the urban heat island effect that promotes a longer and warmer growing season can also enable insect populations to increase the number of generations completed within a year (Forrest 2016). Finally, greater environmental heterogeneity (e.g., in artificial lighting) and the urban heat island effect can also disrupt diapause development (Bale and Hayward 2010) leading to reduced synchrony within a population in the timing at which individuals emerge in spring (Forrest 2016). All these mechanisms may contribute to the pattern of multiple peaks in urban caterpillar biomass.
Our study demonstrated earlier laying (by between two and seven days) in urban Great Tits compared to their forest conspecifics. Our data suggest that urban Great Tit popula- tions do not shift timing of breeding in order to exploit an earlier mass availability of caterpillars. Instead, it thus seems highly likely that the mechanisms driving earlier breeding in urban bird populations are related to the influence of urban development on the environmental cues used by birds to time their onset of reproduction, such as temperature (influ- enced by the urban heat island effect), day length (influ- enced by urban light pollution), or anthropogenic food supplies (influenced by increased supplementary feeding in urban areas). It is notable that the difference in laying date of urban and forest populations was only two days in 2014, the year with an unusually warm spring, contrasting with six to seven days in other years. These results suggest that the urban heat island effect may be a primary driver of pheno- logical divergence between urban and rural bird popula- tions, as such annual variation in the differences between these populations would not be expected if earlier breeding was driven mainly by other factors such as urban light pollu- tion or anthropogenic food supplies.
Urban Great Tits had a significantly greater risk of starva- tion-related nestling mortality, that made an additional con- tribution to the smaller number of fledglings produced per successful pair beyond the effects of smaller clutch sizes.
Chicks that fledged from urban nests also did so at a lower body mass compared to chicks from nests in forests. These patterns largely concur with other recent studies on urban populations of Tits and other birds (Chamberlain et al.
FIG. 3. Differences in caterpillar biomass (mg/h) during (a) the whole sampling period and (b) during the brood-rearing period between urban (gray) and forest (white) habitats, in the four years.
Medians and interquartile ranges are respectively indicated by the thick middle lines and the boxes (see Table 2 for the results of statis- tical analysis), while the whiskers represent maximum and minimum values and the open circles refer to the outliers.
TABLE3.HabitatdifferencesinGreatTits’breedingphenologyandbreedingsuccess Modelparameters
2013201420152016 bSEtPbSEtPbSEtPbSEtP a)Layingdate† Intercept106.240.51207.50<0.00184.461.6850.36<0.001101.891.6960.36<0.00193.631.1084.80<0.001 Habitat5.680.767.450.0182.212.340.940.4466.042.412.500.1297.271.584.600.044 b)Clutchsize‡ Intercept18.576.183.010.00417.192.138.07<0.00115.912.047.79<0.00119.023.335.69<0.001 Habitat3.400.477.200.0191.180.264.480.0463.350.674.980.0383.550.596.050.026 Layingdate0.090.061.550.1270.070.032.870.0050.070.023.78<0.0010.110.043.150.002 c)Numberoffledglings§ Intercept17.239.141.890.06512.283.753.28<0.00126.983.467.79<0.00116.537.992.070.042 Habitat4.861.034.730.0421.470.473.150.0875.350.5310.190.0015.030.855.930.027 Layingdate0.100.091.150.2560.040.043.150.4260.200.036.06<0.0010.120.091.380.170 d)Fledglings’bodymass¶ Intercept0.956.210.150.87925.083.367.46<0.00121.254.284.97<0.00112.953.343.87<0.001 Habitat3.250.654.980.0381.600.473.380.0783.030.496.230.0253.340.506.610.022 Hatchingdate0.100.033.65<0.0010.060.023.150.0020.070.032.840.0060.010.020.410.684 Numberoffledglings0.110.110.990.3220.050.060.840.4030.090.071.310.1920.040.070.620.535 Fledglings’age0.220.310.710.4810.100.160.640.5230.120.150.800.4230.130.140.920.359 Notes:The“habitat”parametershowsthedifferencebetweenforestandurbansites(positivevaluesindicatehighervalues,e.g.,laterlayingdate,largerclutchsize,etc.,inforestsites).Resultsare fromlinearmixedmodels.Statisticallysignificant(P<0.05)differencesarehighlightedinboldfacetypeandmarginallynon-significanteffects(0.05<P<0.10)areinitalictype. Samplesizes(total/urban/forest): †Numberofclutches:2013:60/33/27;2014:120/51/69;2015:122/60/62;2016:112/63/49. ‡Numberofclutches:2013:63/36/27;2014:114/45/69;2015:118/59/59;2016:112/61/51. §Numberofbroods:2013:61/34/27;2014:109/44/65;2015:109/53/56;2016:95/47/48. ¶Numberofbroods(numberoffledglings):2013:61/35/26(528/237/291);2014:108/43/65(1121/407/714);2015:102/50/52(877/335/542);2016:98/50/48(797/307/490).
Vol. 28, No. 5
2009, Wawrzyniak et al. 2015, Bailly et al. 2016), although differences in starvation-related chick mortality between urban and rural populations have rarely been documented.
Notably, our results repeatedly document all these patterns in multiple years and multiple populations. Moreover, we simultaneously document substantially reduced abundance of caterpillars in urban environments (between 8.5 and 24 times lower than forest environments) during the Great Tit brood rearing period and reduced incorporation of caterpil- lars into nestling diets (from 93% to 58%; Appendix S1:
Fig. S6).
The smaller clutches in urban areas may be advantageous because large clutches may be counter-selected in
environments with low availability of nestling food and high incidence of nestling mortality due to starving. It is unclear, however, if smaller clutches in urban areas arise primarily from directional selection or from phenotypic plasticity with clutch size being reduced in lower quality environments.
Despite the smaller clutch sizes of urban pairs, they still experience more frequent brood reduction during chick rearing related to starvation, suggesting that additional ben- efits may arise from further reductions in clutch size, although a bet-hedging strategy may allow urban birds to take advantage of occasional small increases in caterpillar availability. In addition, due in part to the reduced availabil- ity of caterpillars, urban females may be constrained from laying large clutches because of their limited access to nutri- ents like protein and calcium prior to laying (Seress and Liker 2015). Further studies are needed to better understand the effects of urbanization on parent birds’condition and its role in their decreased productivity.
The reduced fecundity and higher nestling mortality of urban Great Tits has implications for population size and viability in this species and presumably also in other birds suffering from similar negative effects of urbanization. We found no evidence that urban populations have a higher pro- portion of fledglings produced from second broods, which could compensate for the lower success of first broods, sug- gesting that urban populations are prone to decrease unless increased post-fledging survival negates the effect of reduced productivity. Therefore, our findings are compatible with, although do not provide explicit support for, the hypothesis that urban populations are sinks. Establishing this will require additional information on recruitment rates and adult survival of urban-breeding and forest-dwelling Great Tits (Horak and Lebreton 1998). While, in several species, adult survival is higher in urban than rural populations (Sepp et al.
2017), other species show the opposite or no effect of urban- ization (Evans et al. 2015, Marzluff et al. 2016).
Management implications
Our findings imply that urbanization will reduce the reproductive success of bird species for which caterpillars are key components of the nestling diet. Such bird species often occur at lower densities in towns and cities than in more natural habitats (Lim and Sodhi 2004, Chace and Walsh 2006, Kark et al. 2007, Chen and Wang 2017; but see Evans et al. 2011) suggesting that insufficient natural food supply during the breeding season may be one factor regu- lating urban population sizes of these species. It is thus important to devise urban planning and management strate- gies to improve foraging conditions for those urban bird species whose nestlings rely on caterpillars or, more gener- ally, on phytophagous insects. Our results indicate that food limitation occurs during the birds’ breeding season, and while bird feeding is an increasingly popular practice in our region, it is less common than in Western Europe and typi- cally limited to winter. While the evidence that typically pro- vided supplementary foods for garden birds benefits avian population size and breeding success is equivocal (Robb et al. 2008, Plummer et al. 2013, Bonnington et al. 2014), providing invertebrates or other protein-rich bird foods dur- ing the breeding season may enhance reproductive success FIG. 4. Differences in breeding phenology and breeding success
of urban (gray) and forest (white) Great Tits in 2013–2016: (a) lay- ing date of the first egg per clutch, (b) clutch size, (c) number of fledglings, and (d) body mass of fledglings (c and d were measured at 14–16 d of chick age). Medians and interquartile ranges are respectively indicated by the thick middle lines and boxes, while the whiskers represent maximum and minimum values and the open cir- cles refer to the outliers.