DETERMINATION OF GTN PARAMETERS OF SENT SPECIMEN DURING DUCTILE FRACTURE
Chahboub Yassine1, Dr. Szavai Szabolcs,2, Zoltan Bezi2
1PhD student, 2 Assistant professor, 3Reseach follow
1, 2 University of Miskolc, the Machine and Product Design Department, 3515 Miskolc, Miskolc-Egyetemváros
2, 3 Bay Zoltán Nonprofit Ltd. for Applied Research Department of Structural Integrity
ABSTRACT
The Gurson–Tvergaard–Needleman (GTN) model, is widely used to predict the failure of materials based on lab specimens, The direct identification of the GTN parameters is not easy and its time and money consuming.
The Gurson model is based on micro-mechanical behavior of ductile fracture, containing void nucleation, growth and coalescence
The most used method to determine the GTN parameters is the combination between the experimental and FEM results
In this paper we are going to determine the GTN parameters for the SENT specimen based on the fracture toughness test of CT specimen.
The reason behind choosing the SENT specimen is because it can be very good representative of the pipe for both uniaxial and biaxial loading conditions. [1]
The Results show that the GTN parameters concluded from CT simulations, predict very well the crack initiation and propagation of SENT specimen which confirm the validity of this model, as already proved in the literature.
Introduction
Ensuring the Nuclear Safety of the Nuclear power plant, that’s mean keep all the parts working properly and with high performance, therefore the pipeline is one this parts, the leakage problem in the pipes are very critical issue that’s might lead to catastrophes if we didn’t detect it from the beginning.
In order to predict the crack initiation and propagation in the pipe we need to determine the GTN parameters which is not easy for large scale materials, that why we use the SENT specimen because its presents a very good transferability with regards to the pipe.
MultiScience - XXXIII. microCAD International Multidisciplinary Scientific Conference University of Miskolc, 23-24 May, 2019, ISBN 978-963-358-177-3
DOI: 10.26649/musci.2019.012
GURSON MODEL
Gurson Tvergaard Needleman (GTN) model (Gurson, 1977; Tvergaard, 1981; Tvergaard and Needleman, 1984), it’s very known damage model that’s widely used in engineering application to predict the failure of materials such as steel cast iron, copper, and aluminum and there is some studies which prove the usability of the model in the case of polymer also [2] Gurson, Tvergaard and Needleman’s damage model (GTN model) [3] is an analytical model that predicts ductile fracture on the basis of nucleation, growth and coalescence of voids in materials. The model is defined as:
22 2 1 cosh
1 12 2
2
e
M M
q f tr q f
(1)
In which q1 is the material constant, trσ is the sum of principal stresses, σM is the equivalent flow stress and f* is the ratio of voids effective volume to the material volume ratio defined as follows:
f
f fc If f fc (2)
c
1/ 1
c
c
f c
q f
f f f f f
f f
if f fc (3) Where f is the voids’ volume ratio, fc is the voids’ volume ratio at the beginning of nucleation and ff is the voids’ volume ratio when fracture occurs.
σM is the equivalent flow stress and its is obtained from the following work hardening relation:
M
Mpl y Mpl 1 n y
(4)
In which n is the strain-hardening exponent and
pl
M is the equivalent plastic strain.
The voids’ growth rate is the sum of existing voids growth
.
fg
and the new voids’
nucleation
.
fn
. . .
n g
f f f (5)
Where the components are further formulated as follows:
f.g
1 f tr
.pl (6). . pl
n M
f A (7)
exp 1/ 2 2
pl
n M N
n N
A f S S
(8)
In which tr.pl
xyz
is the volume plastic strain rate, SN is the voids’ nucleation mean quantity, fn is volume ratio of the second phase particles (responsible for the voids’nucleation) and εN is mean strain at the time of voids’ nucleation.
So, GTN model involves eight parameters which can be defined in a vector form by [3]:
q q1, 2,f0,fc,ff,fn, N,SN
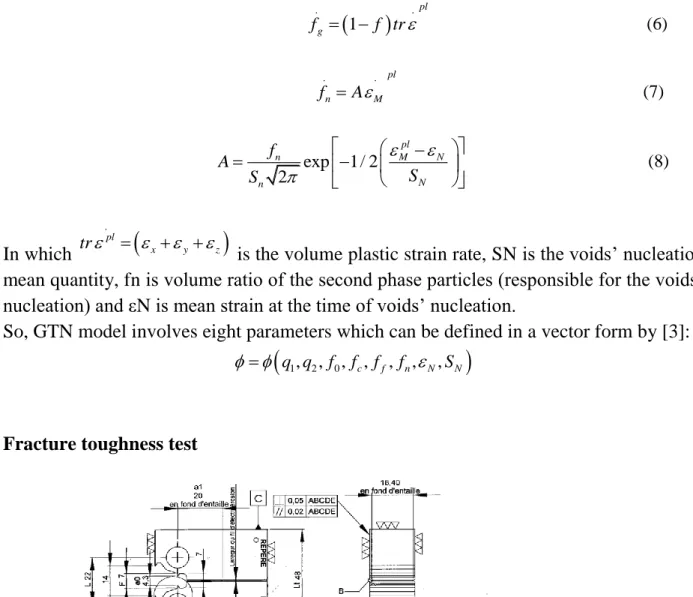
Fracture toughness test
Figure 1 CT specimen
In order to determine the GTN parameters for the SENT specimen we use the fracture toughness test data. These tests were performed on compact tension (CT) specimens, as shown in figure 1; its dimensions are also shown in the same figure.
According to the literature (Bauvineau et al. 1996; Decamp et al. 1997; Siegmund et al.
1998; Schmitt et al. 1997; Skallerud and Zhang 1997; Benseddiq and Imad 2008), we were able to have initial values of GTN parameters as listed in Table 1[4] for steels.
Table 1 Gurson parameters according to litterature
We took advantage of the symmetry and we make the 3D FEM model just for the half of the CT specimen as shown in the figure 2 the FEM model contains total of 58,103 nodes and 51,512 elements. We shall proceed to the mesh refining near the crack tip because in this zone the gradient of strain and stress is intense, unlike the upper part of the specimen, which saves a little more of computing time the mesh size in the front of the pre-crack tip is 0.125 mm × 0.0625 mm, and the mesh is composed of quadratic axisymmetric elements with 8 nodes. The contour plot of the void volume fraction of the deformed specimen is shown in Fig. 3, in which the crack has propagated into the specimen.
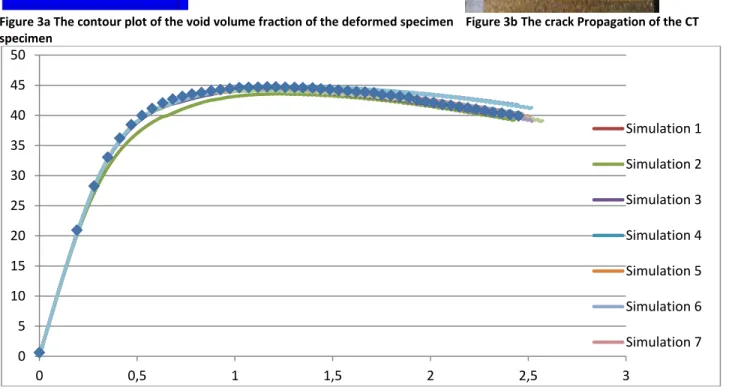
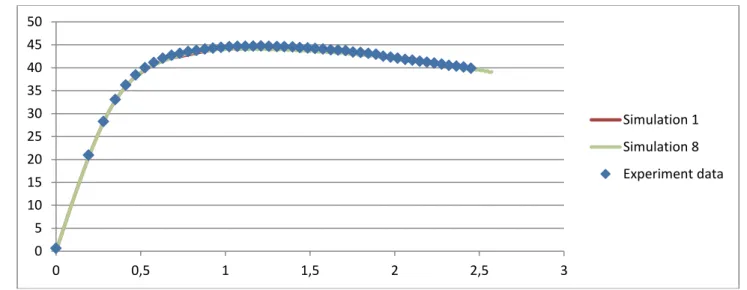
The observed force (kN) versus crack opening displacement (mm) measurement is plotted in Fig. 4, along with the FEM simulations. In the simulations, the initial crack of a0/W = 0.61 was used. Therefore, COD measurement was made on the knife-edge features in the mouth of the CT specimens. The simulations were done with different sets of GTN parameters. It can be seen that almost all of the simulated force-COD curves are in reasonable agreement with the experimental data up to the peak load except for the simulation 2. As we can notice from the curves that the best match in the post-peak stage is observed in the simulation 1 and simulation 8 see figure 5.
In addition to this and as we can see in the figure 3b, the GTN model predict well the crack initiation and propagation for the CT specimen.
Figure 2 FEM of CT specimen
Figure 3a The contour plot of the void volume fraction of the deformed specimen Figure 3b The crack Propagation of the CT specimen
Figure 4 force-COD curves of 10 simulations 0
5 10 15 20 25 30 35 40 45 50
0 0,5 1 1,5 2 2,5 3
Simulation 1 Simulation 2 Simulation 3 Simulation 4 Simulation 5 Simulation 6 Simulation 7
Figure 5 force-COD curves of the simulations 1 and 8
We summarized in the Table 2 all the GTN parameters used during the simulations.
According to the literature [4] the values of q1 and q2 are fixed, q1=1.5 and q2=1.
Table 2 Table of GTN parameters for different Simulations.
Initial Void Volume Fraction
Critical Void Volume Fraction
Failure Void Volume Fraction
Mean Strain for
Nucleation
Standard Deviation
Volume Fraction
for Void
Nucleation
Simulation 1 0.003 0.07 0.35 0.65 0.005 0.3
Simulation 2 0.003 0.2 0.3 0.3 0.05 0.06
Simulation 3 0.0032 0.22 0.35 0.3 0.05 0.05
Simulation 4 0.0015 0.12 0.35 0.3 0.05 0.08
Simulation 5 0.001 0.15 0.3 0.22 0.05 0.05
Simulation 6 0.001 0.17 0.32 0.25 0.05 0.05
Simulation 7 0.001 0.1 0.33 0.17 0.05 0.024
Simulation 8 0 0.045 0.27 0.2 0. 45 0.05
Simulation 9 0.001 0.1 0.33 0.165 0.05 0.025
Simulation 10 0.001 0.1 0.33 0.2 0.05 0.025
0 5 10 15 20 25 30 35 40 45 50
0 0,5 1 1,5 2 2,5 3
Simulation 1 Simulation 8 Experiment data
By comparing the experimental crack propagation to the simulation we can notice that they are quite the same which can lead us to confirm that with GTN parameters used in the simulation 1 and 8 we can predict the crack propagation.
According to the previous simulations and references, the most sensitive parameters are fn volume fraction for the void nucleation, and fc critical void volume fraction.
If we compare the GTN parameters used in the simulations 1 and 8 we can see that the closest parameters to the literature data Table 1 are the parameters used in the simulation 8.
Prediction of Crack propagation for SENT SPECIMEN.
In order to check the validity of the GTN parameters that we found from CT Simulations, We are going to deal with the SENT specimen.
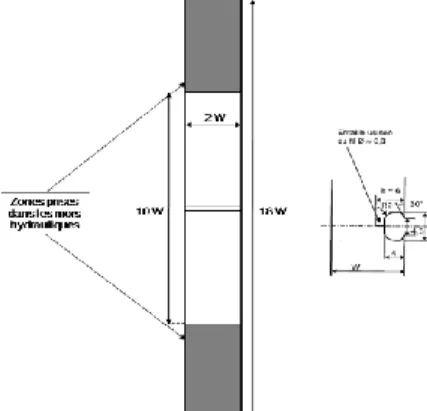
The dimensions of the SENT specimen are shown in the figure 6.
As we did for the CT simulation, we are going to use the axisymmetri, and make the 3D model just for the ¼ of the specimen, the FEM model contains total of 75,461 nodes and 68,160 elements. The mesh size in the front of the pre-crack tip (figure 7) is the same as the CT specimen in order to avoid the effect of the sensibility of the mesh on the results (0.125 mm × 0.0625 mm) and the mesh is composed of quadratic axisymmetric elements with 8 nodes. The contour plot of the void volume fraction of the deformed specimen is shown in Fig. 8a, in which the crack has propagated into the specimen.
We run the FEM simulation based on the GTN parameters that we got from simulation 8, the results shows that the simulation curve fits the experimental curve and they are in a good agreement Fig. 9.
In addition to this and as we can see in the figure 8b, the GTN model predict well the crack initiation and propagation which prove again the validity of this model.
Figure 6 dimension of SENT specimen
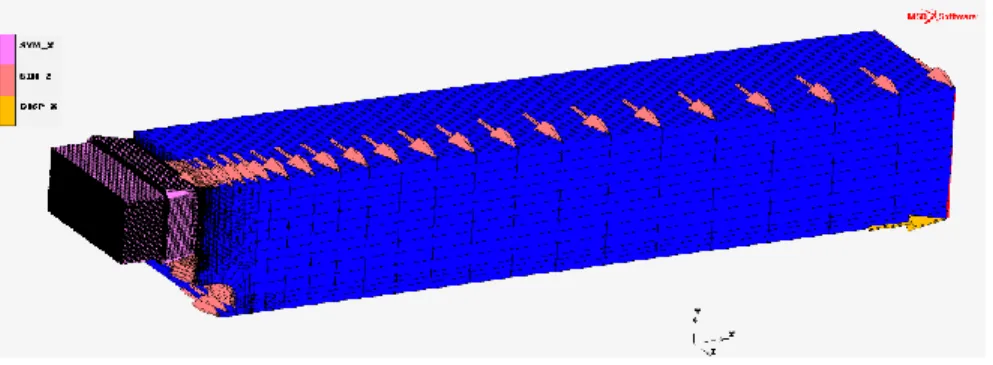
Figure 7 The 3D FEM of SENT specimen
Figure 8a the contour plot of the void volume fraction of the deformed specimen Figure 8b The crack propagation in the SENT specimen
Figure 9 force-COD curve 0
20 40 60 80 100 120 140 160
0 0,5 1 1,5 2
Force [kN]
CMOD [mm]
Experiemtal data Simulation Results
Conclusion
As a conclusion of this work, we have performed 3D FEM analysis to study ductile fracture of the SENT specimen because he is good representative of the PIPELINE.
To describe the crack propagation we did use the GTN model because it’s a powerful and applicable tool comparing to the other models.
The GTN model parameters are determined using the CT specimen test data of steel extracted from the same plate of material used for the SENT specimen.
The GTN parameters found during the CT simulation predict well ductile fracture in SENT specimen.
Perspectives
Our main goal is to determine the GTN parameters for pipeline, which will be our future work.
However the simulation its time and consuming which lead us to start thinking about using other methods to determine the GTN parameters in our future work, which is the Artificial Neural Network and different optimization methods
Acknowledgments
This work was carried out as part of the Advanced Structural Integrity Assessment Tools for Safe Long Term Operation project. The realization of this project is supported by the European Union.
I would like thank my colleague Mr.Zoltan BEZI from BAY ZOLTAN institute who provided great help and support regarding the FEM.
References
[1]- Clement Soret, Yazid Madi, Jacques Besson, Vincent Gaffard. Use of the sent specimen in pipeline design. 20th JTM - EPRG European pipeline research group, May 2015, Paris, France. 34 p., 2015.
[2]- Alpay Oral, Gunay Anlas and John Lambros Determination of Gurson−Tvergaard−Needleman Model Parameters for Failure of a Polymeric Material International Journal of Damage Mechanics 2012.
[3]- Gurson, A.L. Plastic Flow and Fracture Behavior of Ductile Materials Incorporating Void Nucleation, Growth and Interaction. Ph.D. Thesis, Brown University, Providence, RI, USA, 1975
[4]- Zhong Zhou, Sagar Bhamare, Dong Qian Ductile fracture in thin sheet metals: a FEM study of the Sandia fracture challenge problem based on the Gurson–
Tvergaard–Needleman fracture model International Journal of Fracture March 2014, Volume 186, Issue 1–2, pp 185–200
[5]- Haykel Marouani Hamdi Aguir Identification of material parameters of the Gurson–Tvergaard–Needleman damage law by combined experimental, numerical sheet metal blanking techniques and artificial neural networks approach International Journal of Material Forming 5(2) · June 2011
[6]- Foad Rahimidehgolan G. H. Majzoobi Farhad Alinejad Farhad Alinejad Determination of the Constants of GTN Damage Model Using Experiment, Polynomial Regression and Kriging Methods Applied Sciences 7(11) · November 2017