ScienceDirect
Available online at www.sciencedirect.com
Procedia Structural Integrity 16 (2019) 81–88
2452-3216 2019 The Authors. Published by Elsevier B.V.
Peer-review under responsibility of the 6th International Conference “Fracture Mechanics of Materials and Structural Integrity” organizers.
10.1016/j.prostr.2019.07.025
10.1016/j.prostr.2019.07.025 2452-3216
© 2019 The Authors. Published by Elsevier B.V.
Peer-review under responsibility of the 6th International Conference “Fracture Mechanics of Materials and Structural Integrity” organizers.
ScienceDirect
Structural Integrity Procedia 00 (2019) 000–000
www.elsevier.com/locate/procedia
2452-3216 © 2019 The Author(s). Published by Elsevier B.V.
Peer-review under responsibility of the 6th International Conference “Fracture Mechanics of Materials and Structural Integrity”
organizers
6th International Conference “Fracture Mechanics of Materials and Structural Integrity”
Determination of GTN parameters for SENT specimen during ductile fracture
Yassine Chahboub
a*, Szabolcs Szavai
ba University of Miskolc, Miskolc-Egyetemváros, Miskolc, H-3515, Hungary
b Bay Zoltan nonprofit ltd. for Applied Research, Kondorfa utca 1, Budapest, H-1116, Hungary
Abstract
The Gurson–Tvergaard–Needleman (GTN) model is widely used to predict the failure of materials based on lab specimens. The direct identification of the GTN parameters is not easy and it is time-consuming. The Gurson model is based on micro- mechanical behaviour of ductile fracture, containing void nucleation, growth and coalescence. The most used method to determine the GTN parameters is the combination between the experimental and FEM results but its time consuming as we have to repeat the simulations for many times until the simulation data fits the experimental data in the specimen level (axisymmetric tensile bar and CT specimens), but there are also other methods used to determine the GTN parameters, the aim of these methods is to determine the parameters in a short time as Artificial Neural Network, Hybrid Particle Swarm Optimization, Metallographic Method. In this paper, we determine the GTN parameters for the SENT specimen based on the fracture toughness test of CT specimen. The reason behind choosing the SENT specimen is because it can be a very good representative of the pipe for both uniaxial and biaxial loading conditions. The Results show that the GTN parameters concluded from CT simulations, predict very well the crack initiation and propagation of SENT specimen which confirms the validity of this model.
© 2019 The Author(s). Published by Elsevier B.V.
Peer-review under responsibility of the 6th International Conference “Fracture Mechanics of Materials and Structural Integrity”
organizers
Keywords: Gurson model; SENT specimen; ductile fracture.
* Corresponding author.
E-mail address: chahboubyassine@gmail.com
Available online at www.sciencedirect.com
ScienceDirect
Structural Integrity Procedia 00 (2019) 000–000 www.elsevier.com/locate/procedia
2452-3216 © 2019 The Author(s). Published by Elsevier B.V.
Peer-review under responsibility of the 6th International Conference “Fracture Mechanics of Materials and Structural Integrity”
organizers
6th International Conference “Fracture Mechanics of Materials and Structural Integrity”
Determination of GTN parameters for SENT specimen during ductile fracture
Yassine Chahboub
a*, Szabolcs Szavai
ba University of Miskolc, Miskolc-Egyetemváros, Miskolc, H-3515, Hungary
b Bay Zoltan nonprofit ltd. for Applied Research, Kondorfa utca 1, Budapest, H-1116, Hungary
Abstract
The Gurson–Tvergaard–Needleman (GTN) model is widely used to predict the failure of materials based on lab specimens. The direct identification of the GTN parameters is not easy and it is time-consuming. The Gurson model is based on micro- mechanical behaviour of ductile fracture, containing void nucleation, growth and coalescence. The most used method to determine the GTN parameters is the combination between the experimental and FEM results but its time consuming as we have to repeat the simulations for many times until the simulation data fits the experimental data in the specimen level (axisymmetric tensile bar and CT specimens), but there are also other methods used to determine the GTN parameters, the aim of these methods is to determine the parameters in a short time as Artificial Neural Network, Hybrid Particle Swarm Optimization, Metallographic Method. In this paper, we determine the GTN parameters for the SENT specimen based on the fracture toughness test of CT specimen. The reason behind choosing the SENT specimen is because it can be a very good representative of the pipe for both uniaxial and biaxial loading conditions. The Results show that the GTN parameters concluded from CT simulations, predict very well the crack initiation and propagation of SENT specimen which confirms the validity of this model.
© 2019 The Author(s). Published by Elsevier B.V.
Peer-review under responsibility of the 6th International Conference “Fracture Mechanics of Materials and Structural Integrity”
organizers
Keywords: Gurson model; SENT specimen; ductile fracture.
* Corresponding author.
E-mail address: chahboubyassine@gmail.com
1.Introduction
Ensuring the Nuclear Safety of the Nuclear power plants, that’s mean keep all the parts working properly and with high performance, therefore the pipeline is one this parts, the leakage problem in the pipelines is very critical issue that’s might affect the performance of the Nuclear Power Plant if we didn’t detect it from the beginning.
Ductile fracture is the main mode of fracture in the case of pipelines, the physical process in ductile fracture involves the nucleation, growth and coalescence of microvoids.
Comparing the GTN model to other damage models like Rice and Tracey Model, Johnson–Cook, Damage Model, the GTN model is a powerful tool that’s used in the industry and in the research area, to predict the initiation and propagation of the crack, in addition to this the GTN model is implemented in FEM software products as MSC Marc Mentat.
In order to predict the ductile failure and to prevent crack growth in the pipe, we need to determine the GTN parameters which are not easy for large scale materials, that why we use the SENT specimen because of its presence a very good transferability with regards to the pipe.
1.1. Gurson model
Gurson Tvergaard Needleman (GTN) model, it’s very know damage model that’s widely used in engineering application to predict the failure of materials such as steel cast iron, copper, and aluminum and there is some studies which prove the usability of the model in the case of polymer also Oral et al. (2012) Gurson, Tvergaard and Needleman’s damage model (GTN model) Gurson (1975) is an analytical model that predicts ductile fracture on the basis of nucleation, growth and coalescence of voids in materials.
The model is defined as:
2 * 2 *2
1 1
2
σ 2 cosh σ 1
2σ σ
e
M M
q f tr q f
, (1)
in which q1 is the material constant, trσ is the sum of principal stresses, σM is the equivalent flow stress and f * is the ratio of voids effective volume to the material volume ratio defined as follows:
* c
f f f if f fc (2)
1
* 1
c c c
f c
q f
f f f f f
f f if f fc, (3)
where f is the voids’ volume ratio, fc is the voids’ volume ratio at the beginning of nucleation and ff is the voids’
volume ratio when fracture occurs.
σM is the equivalent flow stress and its is obtained from the following work hardening relation:
εσ ε σ 1
ε
pl n
pl M
M M y
y
if f fc, (4)
in which n is the strain-hardening exponent and εMpl is the equivalent plastic strain.
The voids’ growth rate is the sum of existing voids growth fg and the new voids’ nucleation fn
n g
f f f , (5)
where the components are further formulated as follows:
1
εplfg f tr , (6)
εpl
n M
f A , (7)
ε ε
exp 1/ 2 2π
n Mpl N
n N
A f
S S , (8)
in which trεpl is the volume plastic strain rate, SN is the voids’ nucleation mean quantity, fn is volume ratio of the second phase particles (responsible for the voids’ nucleation) and εN is mean strain at the time of voids’ nucleation.
So, GTN model involves eight parameters which can be defined in a vector form by:
1 2 0
( , , , , , , , )
q q f f f fc n f N SN
. (9)
2. Methodology and Results
In order to predict the ductile failure of the SENT specimen we need to determine the GTN parameters, which will be done by following these steps:
Perform the small scale tests (CT, SENT) In order to provide the Experimental data
Make the Finite Element Simulations 3D investigation
Determination of the GTN parameters by the combination between the experimental and FEM result 2.1. Fracture toughness test modelling
In order to determine the GTN parameters for the SENT specimen, we use the fracture toughness test data. These tests were performed on compact tension (CT) specimens, as shown in Fig. 1; its dimensions are also shown in the same figure.
Fig 1. CT specimen.
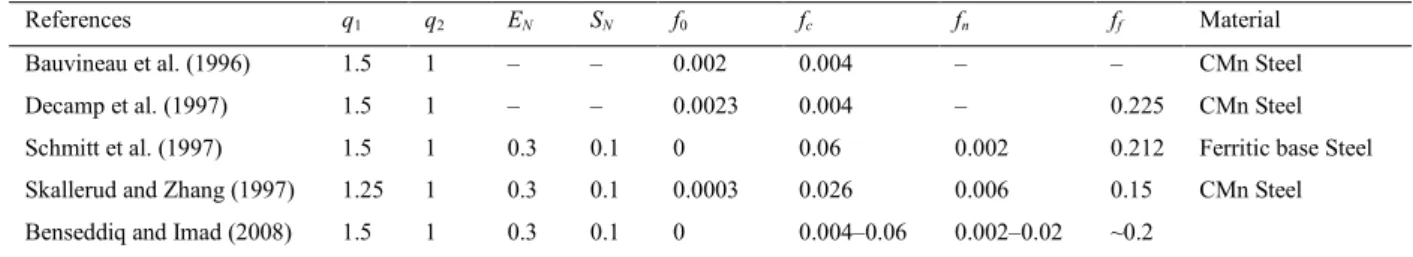
According to the literature (Bauvineau et al. (1996); Decamp et al. (1997); Schmitt et al. (1997); Skallerud and Zhang (1997); Benseddiq and Imad (2008)), we were able to have initial values of GTN parameters as listed in Table 1 for steels.
Table 1. Gurson parameters according to literature.
References q1 q2 EN SN f0 fc fn ff Material
Bauvineau et al. (1996) 1.5 1 – – 0.002 0.004 – – CMn Steel
Decamp et al. (1997) 1.5 1 – – 0.0023 0.004 – 0.225 CMn Steel
Schmitt et al. (1997) 1.5 1 0.3 0.1 0 0.06 0.002 0.212 Ferritic base Steel
Skallerud and Zhang (1997) 1.25 1 0.3 0.1 0.0003 0.026 0.006 0.15 CMn Steel Benseddiq and Imad (2008) 1.5 1 0.3 0.1 0 0.004–0.06 0.002–0.02 ~0.2
We took advantage of the symmetry and we make the 3D FEM model just for the half of the CT specimen as shown in the Fig. 2 the FEM model contains a total of 58,103 nodes and 51,512 elements.
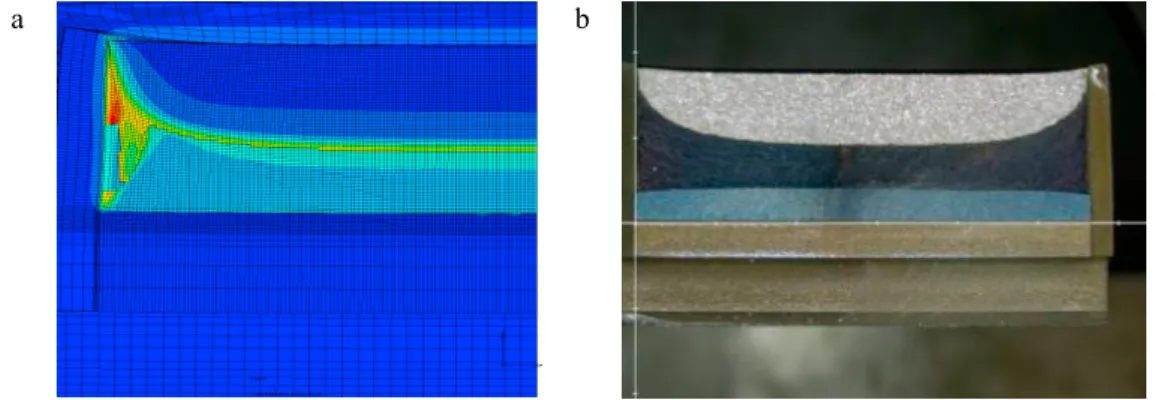
We shall proceed to the mesh refining near the crack tip because in this zone the gradient of strain and stress is intense, unlike the upper part of the specimen, which saves a little more of computing time the mesh size in the front of the pre-crack tip is 0.125 mm × 0.0625 mm, and the mesh is composed of quadratic axisymmetric elements with 8 nodes. The contour plot of the void volume fraction of the deformed specimen is shown in Fig. 3, in which the crack has propagated into the specimen.
Fig 2. FEM of CT specimen.
a b
Fig 3. (a) The contour plot of the void volume fraction of the deformed specimen; (b) The crack propagation in the CT specimen.
The observed force (kN) versus crack opening displacement (mm) measurement is plotted in Fig. 4, along with the FEM simulations. In the simulations, the initial crack of a0/W = 0.61 was used. Therefore, COD measurement was made on the knife-edge features in the mouth of the CT specimens. The simulations were done with different sets of GTN parameters.
It can be seen that almost all of the simulated force-COD curves are in reasonable agreement with the experimental data up to the peak load except for simulation 2. As we can notice from the curves that the best match in the post-peak stage is observed in simulation 1 and simulation 8 (see Fig. 5).
Fig 4. Force-COD curves of 10 simulations.
Fig 5. force-COD curves of the simulations 1 and 8.
In addition to this and as we can see in Fig. 3b, the GTN model predicts well the crack initiation and propagation for the CT specimen.
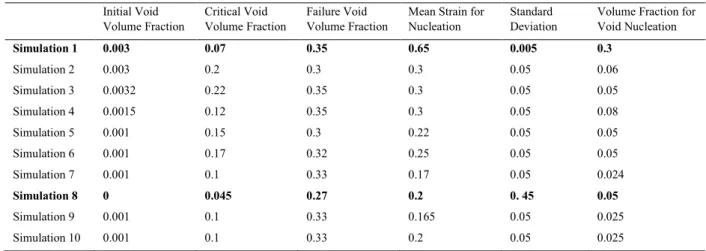
We summarized in Table 2 all the GTN parameters used during the simulations.
According to the literature (Bauvineau et al. (1996); Decamp et al. (1997); Schmitt et al. (1997); Skallerud and Zhang (1997); Benseddiq and Imad (2008)), the values of q1 and q2 are fixed, q1=1.5 and q2=1.
By comparing the experimental crack propagation to the simulation (Fig. 3) wee can notice that they are quite the same which can lead us to confirm that with GTN parameters used in simulation 1 and 8 we can predict the crack propagation.
Table 2. GTN parameters for different Simulations.
Initial Void
Volume Fraction Critical Void
Volume Fraction Failure Void
Volume Fraction Mean Strain for
Nucleation Standard
Deviation Volume Fraction for Void Nucleation
Simulation 1 0.003 0.07 0.35 0.65 0.005 0.3
Simulation 2 0.003 0.2 0.3 0.3 0.05 0.06
Simulation 3 0.0032 0.22 0.35 0.3 0.05 0.05
Simulation 4 0.0015 0.12 0.35 0.3 0.05 0.08
Simulation 5 0.001 0.15 0.3 0.22 0.05 0.05
Simulation 6 0.001 0.17 0.32 0.25 0.05 0.05
Simulation 7 0.001 0.1 0.33 0.17 0.05 0.024
Simulation 8 0 0.045 0.27 0.2 0. 45 0.05
Simulation 9 0.001 0.1 0.33 0.165 0.05 0.025
Simulation 10 0.001 0.1 0.33 0.2 0.05 0.025
According to the previous simulations and references, the most sensitive parameters are fn volume fraction for the void nucleation and fc critical void volume fraction.
If we compare the GTN parameters used in the simulations 1 and 8 we can see that the closest parameters to the literature data Table 1 are the parameters used in the simulation 8.
2.2. Prediction of crack propagation for SENT specimen
In order to check the validity of the GTN parameters that we found from CT Simulations, we are going to deal with the SENT specimen.
The dimensions of the SENT specimen are shown in the Fig. 6, and as we did for the CT simulation, we are going to use the axisymmetry, and make the 3D model just for the ¼ of the specimen, the FEM model contains a total of 75,461 nodes and 68,160 elements. The mesh size in the front of the pre-crack tip (Fig. 7) is the same as the CT specimen in order to avoid the effect of the sensibility of the mesh on the results (0.125×0.0625 mm) and the mesh is composed of quadratic axisymmetric elements with 8 nodes. The contour plot of the void volume fraction of the deformed specimen is shown in Fig. 8a, in which the crack has propagated into the specimen.
Fig. 6. Dimensions of SENT specimen.
We run the FEM simulation based on the GTN parameters that we got from simulation 8, the results show that the simulation curve fits the experimental curve and they are in a good agreement Fig. 9.
In addition to this and as we can see in the Fig. 8b, the GTN model predicts well the crack initiation and propagation which prove again the validity of this model.
Fig. 7. The 3D FEM of SENT specimen.
a b
Fig. 8. (a) The contour plot of the void volume fraction of the deformed specimen; (b) The crack propagation in the SENT specimen.
Fig. 9. Force-COD curve.
3.Conclusion
As a conclusion of this work, we have performed 3D FEM analysis to study ductile fracture of the SENT specimen because he is a good representative of the PIPELINE. To describe the crack propagation we used the GTN model because it’s a powerful and applicable tool. The GTN model parameters are determined using the CT specimen test data of steel extracted from the same plate of material used for the SENT specimen. The GTN parameters found during the CT simulation predict well ductile fracture in SENT specimen.
Acknowledgments
This work was carried out as part of the Advanced Structural Integrity Assessment Tools for Safe Long Term Operation project. The realization of this project is supported by the European Union.
The described work was partially supported by the EU as part of the EFOP3.6.1-16-2016-00011 “Younger and Renewing University Innovative Knowledge City – institutional development of the University of Miskolc aiming at intelligent specialisation” project implemented in the framework of the Szechenyi 2020 program.
This work was carried out in part in Bay Zoltán Alkalmazott Kutatási Nonprofit Kft Miskolc.
References
Bauvineau, L., Burlet, H., Eripret, C., & Pineau, A.L., 1996. Modelling ductile stable crack growth in a C-Mn steel with local approaches. Journal de Physique IV – Proceedings 06 (C6), C6-33–C6-42.
Benseddiq, N., Imad, A., 2008. A ductile fracture analysis using a local damage model. International Journal of Pressure Vessels and Piping 85 (4), 219–227.
Decamp, K., Bauvineau, L., Besson, J., Pineau, A., 1997. Size and geometry effects on ductile rupture of notched bars in a C-Mn steel:
experiments and modelling. International Journal of Fracture 88 (1), 1–18.
Gurson, A.L, 1975. Plastic Flow and Fracture Behavior of Ductile Materials Incorporating Void Nucleation, Growth and Interaction. Ph.D.
Thesis, Brown University, Providence, RI, USA, pp. 464.
Oral, A., Anlas, G., & Lambros, J., 2012. Determination of Gurson–Tvergaard–Needleman Model Parameters for Failure of a Polymeric Material.
International Journal of Damage Mechanics, 21 (1), 3–25.
Schmitt, W., Sun, D.Z., Blauel, J.G., 1997. Damage mechanics analysis (Gurson model) and experimental verification of the behaviour of a crack in a weld-cladded component. Nuclear Engineering and Design 174 (3), 237–246.
Skallerud, B., Zhang, Z.L., 1997. A 3D numerical study of ductile tearing and fatigue crack growth under nominal cyclic plasticity. International Journal of Solids and Structures 34 (24), 3141–3161.