applied sciences
Article
Systematic Analysis of Micro-Fiber Thermal Insulations from a Thermal Properties Point of View
Ákos Lakatos1,* , István Csarnovics2 and Attila Csík3
Citation: Lakatos, Á.; Csarnovics, I.;
Csík, A. Systematic Analysis of Micro-Fiber Thermal Insulations from a Thermal Properties Point of View.
Appl. Sci.2021,11, 4943. https://
doi.org/10.3390/app11114943
Academic Editors: Marco Perino and Stefano Fantucci
Received: 3 May 2021 Accepted: 24 May 2021 Published: 27 May 2021
Publisher’s Note:MDPI stays neutral with regard to jurisdictional claims in published maps and institutional affil- iations.
Copyright: © 2021 by the authors.
Licensee MDPI, Basel, Switzerland.
This article is an open access article distributed under the terms and conditions of the Creative Commons Attribution (CC BY) license (https://
creativecommons.org/licenses/by/
4.0/).
1 Department of Building Services and Building Engineering, Faculty of Engineering, University of Debrecen, Ótemet˝o Str 2-4, H-4028 Debrecen, Hungary
2 Department of Experimental Physics, Institute of Physics Bem tér 18/a, Faculty of Science and Technology, University of Debrecen, H-4026 Debrecen, Hungary; csarnovics.istvan@science.unideb.hu
3 Institute for Nuclear Research, Bem tér 18/c, H-4026 Debrecen, Hungary; csik.attila@atomki.hu
* Correspondence: alakatos@eng.unideb.hu; Tel.: +36-52415155 (ext. 77771)
Featured Application: This paper contains laboratory measurements of four different micro-fiber thermal insulation materials to reveal their applicability limits under various environmental con- ditions. On the samples, scanning electron microscope investigations were executed to disclose the structure of the fibers. The study also investigated the most important thermal parameters of the samples, namely, the thermal conductivity and the calorific value with the specific heat capacity. Humidity measurements and hydrophobic tests were also conducted and the sorption isotherm of the samples was registered. To reveal the thermal stability as well as the applicability limits, differential scanning calorimetry and Raman spectroscopy measurements have also been performed. As a result of these comprehensive measurements, one can predict the behavior of the samples in various external circumstances. The results can generate further studies and are very useful for both designers, planners, and researchers.
Abstract:In the European Union, almost 40% of all energy consumption comes from buildings, while another 20–25% comes from transport. In the European Union, including Hungary, only buildings with almost-zero energy demand could be built after 2020, and the use of renewable energies must be strengthened. The Renewable Directive stipulated that by 2020, the share of renewable energy in buildings must be 25%, and in transport it must be 10%; the use of electric vehicles is vital. There are about four million dwellings in Hungary, of which approximately three million need to be renovated, and only some of these (a few hundred) meet the cost-optimized level of the 2020 directive.
The use of insulation materials is very important in the transport sector, too. Insulation materials are also used by aircraft and electric vehicles. To reduce the energy loss from buildings, different insulation materials can be used; investigations of insulation materials are very important. This paper presents a comprehensive research report on insulation materials which could be used for building elements, HVAC (heating, ventilation, and air conditioning appliances) equipment, and vehicles.
In this paper, laboratory investigations will be presented along with calculations to better understand the properties and behavior of these materials. For this, firstly structural analysis with scanning electron microscope will be presented. Moreover, the paper will present thermal conductivity and combustion heat measurement results. The sorption and hydrophobic behavior of the materials will be also revealed. Finally, the article will also display differential scanning calorimetry measurements and Raman spectroscopy results of the samples. The research was conducted on four different types of colorized microfiber lightweight wool insulation.
Keywords:thermal properties; fibrous insulations; thermal insulation
1. Introduction
In the European Union, almost 40% of all energy consumption comes from buildings, while another nearly 20–25% comes from transport. In the European Union, including
Appl. Sci.2021,11, 4943. https://doi.org/10.3390/app11114943 https://www.mdpi.com/journal/applsci
Appl. Sci.2021,11, 4943 2 of 18
Hungary, only buildings with almost-zero energy demand could be built after 2020, and the use of renewable energies must be strengthened. The directive stipulated that, by 2020, the share of renewable energy in buildings must be 25% and in transport it must be 10%.
For reducing energy loss and greenhouse gas emissions, thermal insulations are used [1–3].
On the market, there are a few types of insulation materials, such as plastic foams, wool ma- terials, and the use of super insulation materials is also widespread [4,5]. When choosing the right thermal insulation, several factors need to be considered to maximize energy savings. The choice of material depends on the budget of the investor and the heat transfer parameters of the materials. Designers should know and choose the appropriate insulation material and its thickness [6–9]. Furthermore, if one knows the proper heat transfer param- eters, the useful thickness of the material can be determined [10–13]. Therefore, in winter, this is preventing the outflow of indoor heat, i.e., reducing the heat loss of heated rooms;
in summer, one has to maintain good and healthy thermal comfort inside by displacing the heat. There are several benefits of thermal insulation: thermal insulation considerably reduces heating energy; and external insulation of the walls expressively reduces heat changes through the envelope. It also reduces energy consumption and therefore reduces carbon dioxide and carbon monoxide emissions from buildings, providing a healthier envi- ronment and cleaner air. Thermal insulation of vehicles such as aircraft is very important, too. Moreover, choosing the proper thermal insulation for both vehicles and buildings or HVAC appliances is also important from an acoustic point of view [14]. Reduction in unwanted noise by insulation is also essential. Furthermore, fire retardancy is also a very important aspect. In these last two requirements, fiber-wool insulations perform better than plastic foam [15–19]. Some other parameters such as hygric properties or hydrophobicity also have a significant influence on the selection [20,21].
The main aim of this paper is to present a comprehensive laboratory test to properly understand the thermal behavior of fibrous insulation materials. Most of the thermal and structural parameters of these materials are not clear, which is why it is important to perform these laboratory measurements, to develop a better understanding of the properties and behavior of these materials under different environmental circumstances.
For this, structural analysis with a scanning electron microscope will first be presented, complete with composition analysis of the samples via the energy dispersive spectrometry method. From the images, the average diameter and the morphology of the fibers, as well as their components, will be defined. Moreover, the paper will present thermal conductivity and combustion heat measurement results as the most important thermal parameters for insulating materials. The sorption and hydrophobic behavior of the materials will also be in focus. Finally, the article will highlight differential scanning calorimetry measurements and Raman spectroscopy results to assess the thermal stability, as well as to explore further contents inside the materials which could not be detected by the scanning electron microscope. The research was conducted on four different types of colorized microfiber lightweight wool insulation used for building (HVAC) and other applications.
2. Materials and Methods 2.1. The Tested Material
The tested blankets were made of lightweight, flexible, fiber-glass material, which have superior thermal and acoustical performance in a minimal space, making them a dependable solution in many applications including HVAC equipment, office interiors, refrigerators and freezers, transportation, water heater retrofit kits, pipes, and a variety of specific applications such as in a convective microwave oven. They are also particularly well-suited for insulating the fuselage wall cavities of commercial and business aircraft.
An additive is used to provide water repellence and increase hydrophobicity. In circum- stances where moisture is not a concern, a plain phenolic binder can be specified. This is a lightweight, highly resilient, thermal insulation blanket made of fine, flame-attenuated glass fibers bonded with a thermosetting phenolic resin. Glass wool is an insulating mate- rial of glass fibers with a wool-like structure. Glass wool is a good quality raw material
Appl. Sci.2021,11, 4943 3 of 18
pre-shredded to a suitable fineness, e.g., glassy inorganic silicate fiber material obtained by melting and fiberizing a homogeneous mixture of sand, feldspar, soda ash, sodium sulfate, barium sulfate, fluorspar, and borax (or another boron-containing mineral). Within glass wool insulation, two types of product groups are known: one is rolled glass wool insulation, and the other is panel glass wool insulation. Glass wool has an extremely flexible and fine fiber structure and low body density (varying from 10 to 100 kg/m3 depending on the type). It has a fire rating of A1. Glass wool has good vapor permeability, i.e., it only slightly impedes the movement of steam [22–24]. In the case of multilayer thermal insulation, it is recommended for use just below the outermost layer. The thermal conductivity is estimated to be between 0.032–0.045 W/mK depending on the density.
The research was conducted on four different types of colorized (pink, yellow, orange, and green) micro fiberglass wool insulation materials. All four samples were received from the same manufacturer, where the differences among the yellow, green, and pink arose only from their density, and their components were declared to be the same. The coloring was only for their easier distinction. Moreover, in this study, our main aim was to reveal the differences in their thermal behavior, which should be connected with different densities, except for the orange one. They contained predominantly glass or ceramic-based elements.
Orange is specifically designed for use in spaces where a formaldehyde-free product is desirable; moreover, it also contains acryl. Table1shows the as-received densities and thicknesses of the samples examined in this work.
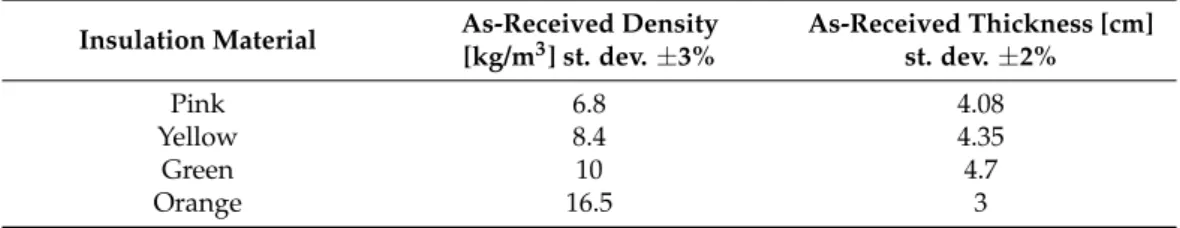
Table 1.The density and thickness of the as-received samples.
Insulation Material As-Received Density [kg/m3] st. dev.±3%
As-Received Thickness [cm]
st. dev.±2%
Pink 6.8 4.08
Yellow 8.4 4.35
Green 10 4.7
Orange 16.5 3
2.2. Application Possibilities and Experiences of Micro-Fiber Based Insulations
The use of micro-glass fiber materials as thermal insulation is well known, but it should be highlighted for better understanding. These materials can be used in buildings and for both industrial and vehicle engineering. They can be also used where the materials should be able to withstand high temperatures (~250–300◦C); for example, for insulating heating pipes transporting hot water or steam or for insulating furnaces [14]. Pipes are not only insulated to reduce heat loss. Several insulation methods are used which serve other purposes, such as safety, fire protection, sound attenuation, and condensation pre- vention. Thermal insulation coatings of pipelines have several elements that affect not only the efficiency of the system, but also the safety of their operation and utilization of the equipment [25]. Furthermore, they can be used as attic floors or dividing wall insulation between gypsum boards. It is reported that they can be used as shear wall insulation [26].
For choosing suitable places for these insulations, their thermo-physical properties as a function of temperature, density, mechanical load, thickness, and composition of insulating layers should be investigated. Moreover, analysis of the structure of the fibers is also vi- tal [27]. These layers can be also used as the core of vacuum insulation panels (VIPs), due to their very lightweight and loose-filled structure [28,29]. As previously presented by the authors, glass fiber materials are also suitable for sound insulation. It should be mentioned that the thermal stability of glass wool materials is higher than plastic foam, and their compressibility is greater compared to polystyrene types [30]. Kunic presented an extensive report about a comparison of the carbon footprint of different types of insulation materials.
He revealed that low-density glass wool materials have about 1.494 kg CO2eq./kg carbon footprint, which is less than the values of both plastic foam and advanced materials such as VIP and aerogel. The author also stated that this material in use has the highest impact on the environment [31]. Schiavoni et al. [30] investigated the embodied energy and global
Appl. Sci.2021,11, 4943 4 of 18
warming potential of different insulation materials. The authors analyzed the insulation materials using CTGA standards for the cradle-to-gate method. They found that glass fibers have 134.17 MJeqper f.u. energy consumption, and reached about 8 kg CO2eqper f.u.
of global warming potential. It should be mentioned that these values are higher compared to the values of other fibrous insulations such as cellulose or hemp [31,32]. Here, it should be mentioned that the environmental impact can be reduced and the circular economy approach can be adopted by using recycled glass during manufacturing [33].
2.3. Thermal Conductivity Measurements and Specific Heat Capacity Measurements
The thermal conductivity of the samples was measured by Netzsch 446 small heat flow meter equipment after curing the probes in Venticell-type drying apparatus to a constant weight. The thermal conductivity measurements were performed by using the ISO 10456 [34] and ISO 8301 [35] standards. The sample thickness corresponded to the actual sample dimension or matched the preferred thickness of a sample after compression.
The experiments were performed on samples with a 20 cm×20 cm base area. To determine the specific heat capacity (Cp), the same apparatus was used. This equipment measures the Cpby heating the sample on a step-by-step basis. After calibrating the equipment with a certified standard, about 5% uncertainty can be expected. The measurement procedures are presented in detail in the latest papers of the authors [16,36].
2.4. Combustion Heat Measurements of the Samples with Cal2 ECO Bomb Calorimeter
To measure the combustibility, or in the case of insulation materials, the non-combustibility, bomb calorimetry is a reasonable method. One of the most important properties of insula- tion materials is their behavior in or resistance to fire, which is called fire safety. For this, firing tests on the samples were conducted. With a Cal2 bomb calorimeter, the gross com- bustion heat (or the calorific value) of the samples could be measured. The calorific value of materials is measured by burning them at high pressure (30 bar) and in the presence of very clean oxygen gas. Both the clean O2and the high-pressure ensure the complete burning of the organic content of the material. The experimental results were reached by the average of five individual samples’ gross combustion heat values [15,16].
2.5. Experiments Executed by Scanning Electron Microscope
To determine the fiber diameter, surface morphology, and the contamination of the samples, a scanning electron microscope (LV-SEM, JEOL IT500HR) was used. Element mapping was performed by applying a JEOL Energy-Dispersive X-ray (EDS) system with a detection threshold of 0.1 at.%. During the EDS investigations, the acceleration voltage was increased up to 15 kV. The measurement details are written in [16].
2.6. Raman Spectroscopy
As well as EDS investigations, analysis by Raman spectroscopy is also important. In- side the materials, there could be elements (compounds) or bonds that cannot be visualized by electron microscopy. For revealing further components and structures of the materials, more sensitive equipment is needed, e.g., a Raman spectrometer. This method provides a good opportunity to identify the elements through their footprints (bonds). EDS gives only results about the composition of the samples; however, Raman spectroscopy identifies compounds and bond structures. A Horiba LabRam Raman spectrometer was used for Raman measurements, with a laser diode which operated at a wavelength of 785 nm, and a cooled CCD detector. For the measurement, 1800 lines/mm gratings were used, and as a result, the accuracy of the peak positions was at least±1.5 cm−1. The excitation beam was focused on the surface of the sample with a 50×lens. The laser power on the surface was about 1 mW/cm2. The measurements were performed with an acquisition time of 30 s, accumulating 5. The measured spectra were analyzed, and the baselines were corrected. Both the calibration method and other settings of the measurements were presented in [16,36].
Appl. Sci.2021,11, 4943 5 of 18
2.7. Differential Scanning Calorimetry Measurements
Differential scanning calorimetry (DSC) experiments were performed with Netzsch DSC 3500 Sirius equipment in nitrogen protective gas. The measurements were executed between 30 and 350◦C with 10◦C/min steps. DSC measurements provided acceptable and useful results on the thermal behavior and thermal stability of the materials. For the mea- surements, powder of the samples ~10 mg in weight was prepared. The method procedure was as follows: two samples were placed in a programmable variable temperature oven, one for the test substance and the other for a reference sample with known thermal proper- ties. While the furnace was heated in a programmed manner, the temperature difference between the two samples was measured as a function of the furnace temperature. However, in the calorimetric measurement, our goal was not to determine the temperature difference, but the power difference flowing into the two samples. It was previously presented that calorimetry measurements are suitable for thermal insulation materials [18,37].
2.8. Sorption Isotherms
Besides the thermal properties, the sorption characteristics of the samples are also important. Sorption isotherms are key parameters to understand the behavior of samples in a humid environment. Water taken up from humid environments can cause unwanted as well as undesirable changes in the properties of materials. Moisture in structures can affect the physical and mechanical properties of insulation materials. For the registration of the sorption isotherm curves, three types of equipment were combined. The sorption isotherms were registered by following the directions of the ISO 12571: 2013 standard. First, the samples were dehydrated until a constant mass was reached in Venticell 111 apparatus, the drying was executed at 70◦C and in atmospheric air, and after the equilibrium stage, the dry mass of the samples was measured (mdry). Subsequently, the dried samples were placed in a Climacell 111-type climatic chamber, treated at 23 ◦C and 20–90% relative humidity, and after reaching equilibrium, their wet mass was measured (mwet). By using Equation (1), their moisture content was calculated. For the measurements, four samples from each material were used, and the average of their equilibrium moisture content was given as a function of the relative humidity [7,38].
ω
kg
kg%
= mwet−mdry mdry
×100, (1)
2.9. Hydrophobic Tests
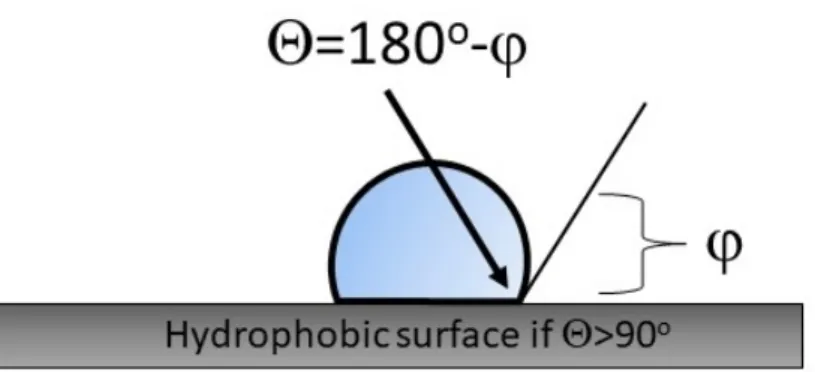
A hydrophobic test was executed with an optical microscope by investigating the contact angle between the water bubble and the surface area of the samples. For the evaluation of the images, the drop-snake plug-in of ImageJ software was used. Figure1 shows the relationship between the contact angle and the surface. A surface is hydrophobic if the contact angle is greater than 90◦[39].
Appl. Sci. 2021, 11, x FOR PEER REVIEW 6 of 19
Figure 1. The hydrophobicity.
3. Results and Discussion
3.1. Surface Morphology and Fiber Distribution Investigations by Scanning Electron Microscopy In order to explore the components as well as the structure of the samples with the resins, scanning electron microscopy analysis was performed. Nagy et al. [40] highlight that electron microscopy produces significant results for mineral wool insulations. They have highlighted that resin can increase the density and can enhance the thermal and me‐
chanical properties. Furthermore, they measured the fiber diameter to be 6–8 μm with a high rate of deviation. Others presented, through SEM images, that the fiber diameters of wool materials range between 2 and 8 μm inside the material [41].
Vinh et al. [27] presented a visualization of glass micro‐fibers with scanning electron microscopy. From our group of SEM images (Figure 2a–d), it can be seen the sample’s fiber is cylindrical, and the fibers are embedded in a binder material; moreover, the orien‐
tation of the fibers is randomized. For analysis of the samples, 700× magnification with a 2 kV acceleration voltage was used to minimize charge accumulation effects. By compar‐
ing the SEM images of the studied samples, the most important difference in morphology was that in the case of the yellow sample, the surface of the fibers was covered with a higher density of small particles. At the same time, the composition measurements did not show any difference between the samples. From the EDS results, we could deduce that the base components were almost the same for the four materials: carbon, silicon, aluminum, sodium, magnesium, and calcium, possibly with their oxides; moreover, a slight sign of sulfur was sometimes observed. However, significant sulfur was not de‐
tected in the green sample. By analyzing the fiber’s diameter with the ImageJ software, we could state that the distribution of the fibers also varied significantly within the mate‐
rial, and the inhomogeneity of the fibers was high. The scanning electron microscopy im‐
ages show a typical image of fibrous insulation materials. The material was lightweight and compressible. It was also notable that the surface of the fibers was smooth only for the green samples.
Figure 1.The hydrophobicity.
Appl. Sci.2021,11, 4943 6 of 18
3. Results and Discussion
3.1. Surface Morphology and Fiber Distribution Investigations by Scanning Electron Microscopy In order to explore the components as well as the structure of the samples with the resins, scanning electron microscopy analysis was performed. Nagy et al. [40] highlight that electron microscopy produces significant results for mineral wool insulations. They have highlighted that resin can increase the density and can enhance the thermal and mechanical properties. Furthermore, they measured the fiber diameter to be 6–8µm with a high rate of deviation. Others presented, through SEM images, that the fiber diameters of wool materials range between 2 and 8µm inside the material [41].
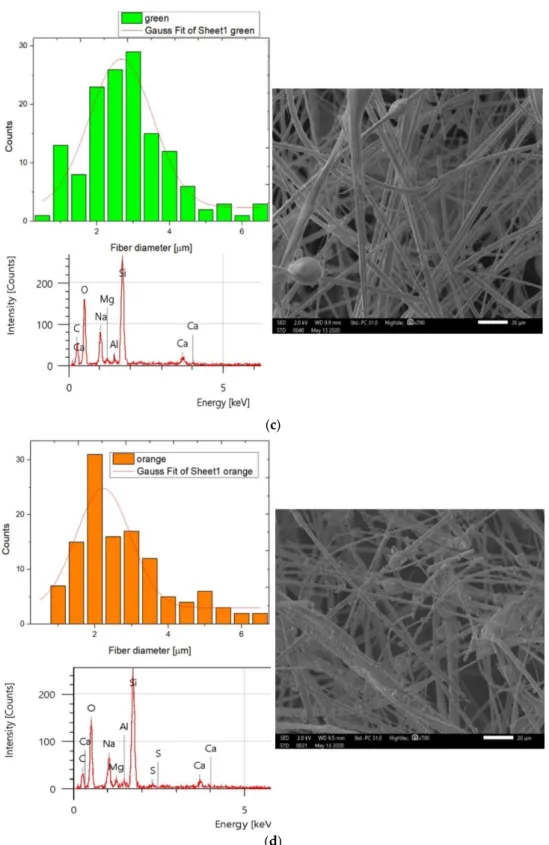
Vinh et al. [27] presented a visualization of glass micro-fibers with scanning electron microscopy. From our group of SEM images (Figure2a–d), it can be seen the sample’s fiber is cylindrical, and the fibers are embedded in a binder material; moreover, the orientation of the fibers is randomized. For analysis of the samples, 700×magnification with a 2 kV acceleration voltage was used to minimize charge accumulation effects. By comparing the SEM images of the studied samples, the most important difference in morphology was that in the case of the yellow sample, the surface of the fibers was covered with a higher density of small particles. At the same time, the composition measurements did not show any difference between the samples. From the EDS results, we could deduce that the base components were almost the same for the four materials: carbon, silicon, aluminum, sodium, magnesium, and calcium, possibly with their oxides; moreover, a slight sign of sulfur was sometimes observed. However, significant sulfur was not detected in the green sample. By analyzing the fiber’s diameter with the ImageJ software, we could state that the distribution of the fibers also varied significantly within the material, and the inhomogene- ity of the fibers was high. The scanning electron microscopy images show a typical image of fibrous insulation materials. The material was lightweight and compressible. It was also notable that the surface of the fibers was smooth only for the green samples.
Gaussian distribution analysis was also performed on the measured fiber diameters, and the results are shown in Figure2a–d as well as in Table2. The model used a built-in module of the data analyzing software. The equation of the model is given as Equation (2).
y = yo + (A/(w·sqrt(Pi/2)))*exp(−2((x-xc)/w)ˆ2 (2) where w is the width, A is the area, yo = 0 is the offset, xc = is the center, and sigma is half of the width as the standard deviation. The values of these parameters are shown in Table2. From the adjusted R-squared, it could be concluded that the model fitted very well to the data (fiber diameters) of the pink samples, and acceptably for the yellow and green samples. Moreover, the mean values of the measured data of the fiber diameters have also been calculated.
The main parameters of Gaussian distribution analysis are the center (xc) and sigma.
It could be seen that the value of the center was the highest for the green sample. Smaller fiber diameters were detected for the other samples. At the same time, from the results of the histograms in Figure2a–d, it was found that the largest inhomogeneity in fiber diameter was identified out for the green, yellow, and orange samples. For these materials, fiber diameters varied between 0.5 and 6.6 mm. To observe the relationship between the as- received density and the calculated mean fiber diameter, Figure3was created. This graph presents the fiber diameters of each sample. From the Gaussian distribution of the above figures, it could be determined that the mean value versus standard deviation ratio was 0.3 for pink, 0.41 for yellow and green, and 0.46 for the orange samples. The average fiber diameter for the orange and the green samples was the same considering the standard deviation. From Figure3, it could be concluded that with increasing density, the fiber diameter increases.
Appl. Sci.Appl. Sci. 2021, 11, x FOR PEER REVIEW 2021,11, 4943 7 of 7 of 1819
(a)
(b)
Figure 2.Cont.
Appl. Sci.2021,11, 4943 8 of 18
Appl. Sci. 2021, 11, x FOR PEER REVIEW 8 of 19
(c)
(d)
Figure 2. (a) SEM and EDS results of the pink sample with a Gaussian distribution of the diameter of the measured fiber.
(b) SEM and EDS results of the yellow sample with a Gaussian distribution of the diameter of the measured fiber. (c) SEM and EDS results of the green sample with a Gaussian distribution of the diameter of the measured fiber. (d) SEM and EDS results of the orange sample with a Gaussian distribution of the diameter of the measured fiber.
Figure 2.(a) SEM and EDS results of the pink sample with a Gaussian distribution of the diameter of the measured fiber.
(b) SEM and EDS results of the yellow sample with a Gaussian distribution of the diameter of the measured fiber. (c) SEM and EDS results of the green sample with a Gaussian distribution of the diameter of the measured fiber. (d) SEM and EDS results of the orange sample with a Gaussian distribution of the diameter of the measured fiber.
Appl. Sci.2021,11, 4943 9 of 18
Table 2.The results of the fitted Gaussian model on each sample.
Gaussian Model
Pink st. Err. Yellow st. Err. Green st. Err. Orange st. Err.
Adj. R-squared 0.986 0.88 0.879 0.765
xc 2.37 0.025 2.25 0.093 2.66 0.0944 2.23 0.125
sigma 0.66 0.029 0.86 0.11 0.87 0.123 0.742 0.15
Calculated mean 2.36 0.725 2.47 1.02 2.87 1.18 2.8 1.27
Appl. Sci. 2021, 11, x FOR PEER REVIEW 9 of 19
Gaussian distribution analysis was also performed on the measured fiber diameters, and the results are shown in Figure 2a–d as well as in Table 2. The model used a built‐in module of the data analyzing software. The equation of the model is given as Equation (2).
y = yo + (A/(w∙sqrt(Pi/2)))*exp(−2((x‐xc)/w)^2 (2) where w is the width, A is the area, yo = 0 is the offset, xc = is the center, and sigma is half of the width as the standard deviation. The values of these parameters are shown in Table 2. From the adjusted R‐squared, it could be concluded that the model fitted very well to the data (fiber diameters) of the pink samples, and acceptably for the yellow and green samples. Moreover, the mean values of the measured data of the fiber diameters have also been calculated.
Table 2. The results of the fitted Gaussian model on each sample.
Gaussian Model
Pink st. Err. Yellow st. Err. Green st. Err. Orange st. Err.
Adj. R‐squared 0.986 0.88 0.879 0.765 xc 2.37 0.025 2.25 0.093 2.66 0.0944 2.23 0.125 sigma 0.66 0.029 0.86 0.11 0.87 0.123 0.742 0.15 Calculated mean 2.36 0.725 2.47 1.02 2.87 1.18 2.8 1.27
The main parameters of Gaussian distribution analysis are the center (xc) and sigma.
It could be seen that the value of the center was the highest for the green sample. Smaller fiber diameters were detected for the other samples. At the same time, from the results of the histograms in Figure 2a–d, it was found that the largest inhomogeneity in fiber diam‐
eter was identified out for the green, yellow, and orange samples. For these materials, fiber diameters varied between 0.5 and 6.6 mm. To observe the relationship between the as‐received density and the calculated mean fiber diameter, Figure 3 was created. This graph presents the fiber diameters of each sample. From the Gaussian distribution of the above figures, it could be determined that the mean value versus standard deviation ratio was 0.3 for pink, 0.41 for yellow and green, and 0.46 for the orange samples. The average fiber diameter for the orange and the green samples was the same considering the stand‐
ard deviation. From Figure 3, it could be concluded that with increasing density, the fiber diameter increases.
Figure 3. The fiber diameter vs. as‐received density.
Figure 3.The fiber diameter vs. as-received density.
3.2. Thermal Conductivity Measurement Results
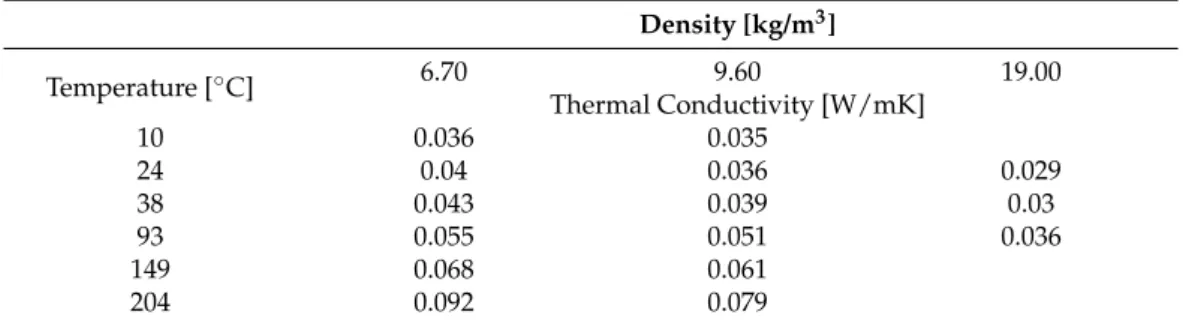
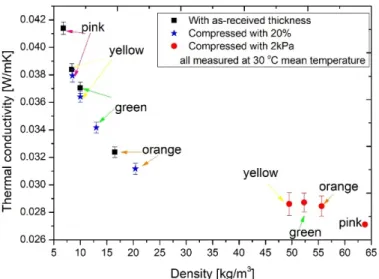
Table3shows the declared thermal conductivities as a function of the temperature and density. As can be observed, the thermal conductivities varied between 0.029 and 0.092 as a function of temperature and density. The tested materials were loose-filled and lightweight insulation; therefore, they were very compressible. Netzsch equipment enables measuring the thermal conductivity of the samples under various loads of heat plates applied on the samples, as well as allows measurement without any load. However, here it must be emphasized that the default setting for the applied load was about 2 kPa. Moreover, by using this equipment, the thermal conductivity could also be measured at different mean temperatures.
Table 3.The declared thermal conductivities.
Density [kg/m3]
Temperature [◦C] 6.70 9.60 19.00
Thermal Conductivity [W/mK]
10 0.036 0.035
24 0.04 0.036 0.029
38 0.043 0.039 0.03
93 0.055 0.051 0.036
149 0.068 0.061
204 0.092 0.079
First, to observe the effects of compression and the resultant change in density on the thermal conductivity, three measurements were performed on each sample at a mean temperature of 30◦C, and the results are highlighted in Figure4. Black squares show the measured thermal conductivities without any load. With an increasing density, a de- creasing thermal conductivity was reached. Then, the samples were compressed manually with the equipment by 20%, and their thermal conductivities were measured again. Here, the results presented the same order as above: the highest value was attained for the pink sample, while the lowest value was measured for the orange. The phenomenon that the increasing density reduces the thermal conductivity was also presented by others
Appl. Sci.2021,11, 4943 10 of 18
for fibrous insulations, although notably, the thermal conductivity decreased to a local minimum [16,42]. In order to see the effect of the compression load on the thermal conduc- tivity, samples were pressed with the plates applying 2 kPa pressure, resulting in about an 80 N force. This compression could happen in real cases, where the insulation material is placed between two layers, or it is compressed by another layer inside the structure. In this case (indicated with red circles), the density of the pink insulation changed the most due to the compression and reached the lowest thermal conductivity. Here, it must be mentioned that due to the compression, the resultant thermal conductivity and thickness decrease might also result in a decrease in the calculated thermal resistance. However, these results supported the case that increasing density decreases the thermal conductivity.
Appl. Sci. 2021, 11, x FOR PEER REVIEW 11 of 19
Figure 4. Thermal conductivity measurement results.
In Table 4, thicknesses measured during the thermal conductivities in the case of the 20% compression and under 2 kPa load are displayed. One can see that in the last case, where 2 kPa load was exerted on the materials, the thicknesses was less than 1 cm, where the measurement limit of the equipment was reached. Therefore, these results should be treated with care, and no significant conclusions should be drawn from this. Additionally, from the results presented in Figure 4, it can be stated that the best choice for the thermal conductivity measurements was the setup where the compression was fixed at 20%. The reason for this was because these materials are loose‐filled and compressible. For exact measurements of the thermal conductivities, the heat plates had to be in good contact with the surface, and we found that this was the best solution for the thermal conductivity measurements. As a result, further thermal conductivity measurements were conducted at different mean temperatures (0, 10, 24, and 30 °C with 20 °C temperature differences, see Figure 5.). We have concluded that thermal conductivities increased as a function of mean temperature. The lowest thermal conductivity was attributed to the orange sample, followed by the green, yellow, and pink materials, in ascending order.
Table 4. Thicknesses during the thermal conductivity measurements.
Insulation Material Thickness at 20% Compression [cm] Thickness at 2 kPa [cm]
Pink 3.30 0.44
Yellow 3.65 0.74
Green 3.66 0.91
Orange 2.25 0.82
Figure 4.Thermal conductivity measurement results.
In Table4, thicknesses measured during the thermal conductivities in the case of the 20% compression and under 2 kPa load are displayed. One can see that in the last case, where 2 kPa load was exerted on the materials, the thicknesses was less than 1 cm, where the measurement limit of the equipment was reached. Therefore, these results should be treated with care, and no significant conclusions should be drawn from this.
Additionally, from the results presented in Figure4, it can be stated that the best choice for the thermal conductivity measurements was the setup where the compression was fixed at 20%. The reason for this was because these materials are loose-filled and compressible.
For exact measurements of the thermal conductivities, the heat plates had to be in good contact with the surface, and we found that this was the best solution for the thermal conductivity measurements. As a result, further thermal conductivity measurements were conducted at different mean temperatures (0, 10, 24, and 30◦C with 20◦C temperature differences, see Figure5.). We have concluded that thermal conductivities increased as a function of mean temperature. The lowest thermal conductivity was attributed to the orange sample, followed by the green, yellow, and pink materials, in ascending order.
Table 4.Thicknesses during the thermal conductivity measurements.
Insulation Material Thickness at 20%
Compression [cm] Thickness at 2 kPa [cm]
Pink 3.30 0.44
Yellow 3.65 0.74
Green 3.66 0.91
Orange 2.25 0.82
Appl. Sci.Appl. Sci. 2021, 11, x FOR PEER REVIEW 2021,11, 4943 12 of 19 11 of 18
Figure 5. The measured thermal conductivities at different temperatures.
With the Netzsch equipment, we were able to measure the specific heat capacity (Cp) values of the samples at 10 °C, and the results are shown in Table 5. It was found that the highest value was attained for the yellow sample, followed by the orange, green, and pink in descending order. Higher specific heat capacity means a higher potential for storing heat, which is a very important thermal property of insulation materials. Similar investi‐
gation results have been presented elsewhere [16,43].
Table 5. The measured specific heat capacities.
Specific Heat Capacity [J/kgK]
Temperature [°C] Pink Yellow Green Orange
10 740 1170 955 976
3.3. Wetting Tests 3.3.1. Hydrophobic Tests
With a combination of an optical microscope and the ImageJ software, contact angles between the surface of the insulations and the water droplets were estimated (see Figure 6).
From the measurement results, it can be concluded that the highest contact angle belonged to the green sample, while the orange and the pink one had the lowest. It should be empha‐
sized that the results for each material showed hydrophobicity, which is also very important for insulation material. The uncertainty of this measurement was about ±5%.
. Figure 6. Hydrophobic tests of the samples.
Figure 5.The measured thermal conductivities at different temperatures.
With the Netzsch equipment, we were able to measure the specific heat capacity (Cp) values of the samples at 10◦C, and the results are shown in Table5. It was found that the highest value was attained for the yellow sample, followed by the orange, green, and pink in descending order. Higher specific heat capacity means a higher potential for storing heat, which is a very important thermal property of insulation materials. Similar investigation results have been presented elsewhere [16,43].
Table 5.The measured specific heat capacities.
Specific Heat Capacity [J/kgK]
Temperature [◦C] Pink Yellow Green Orange
10 740 1170 955 976
3.3. Wetting Tests
3.3.1. Hydrophobic Tests
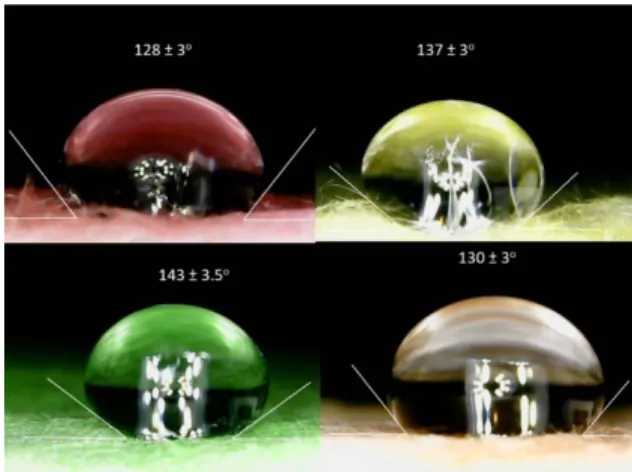
With a combination of an optical microscope and the ImageJ software, contact angles between the surface of the insulations and the water droplets were estimated (see Figure6).
From the measurement results, it can be concluded that the highest contact angle belonged to the green sample, while the orange and the pink one had the lowest. It should be emphasized that the results for each material showed hydrophobicity, which is also very important for insulation material. The uncertainty of this measurement was about±5%.
Appl. Sci. 2021, 11, x FOR PEER REVIEW 12 of 19
Figure 5. The measured thermal conductivities at different temperatures.
With the Netzsch equipment, we were able to measure the specific heat capacity (Cp) values of the samples at 10 °C, and the results are shown in Table 5. It was found that the highest value was attained for the yellow sample, followed by the orange, green, and pink in descending order. Higher specific heat capacity means a higher potential for storing heat, which is a very important thermal property of insulation materials. Similar investi‐
gation results have been presented elsewhere [16,43].
Table 5. The measured specific heat capacities.
Specific Heat Capacity [J/kgK]
Temperature [°C] Pink Yellow Green Orange
10 740 1170 955 976
3.3. Wetting Tests 3.3.1. Hydrophobic Tests
With a combination of an optical microscope and the ImageJ software, contact angles between the surface of the insulations and the water droplets were estimated (see Figure 6).
From the measurement results, it can be concluded that the highest contact angle belonged to the green sample, while the orange and the pink one had the lowest. It should be empha‐
sized that the results for each material showed hydrophobicity, which is also very important for insulation material. The uncertainty of this measurement was about ±5%.
Figure 6. Hydrophobic tests of the samples.
Figure 6.Hydrophobic tests of the samples.
Appl. Sci.2021,11, 4943 12 of 18
3.3.2. Sorption Isotherm Measurement Results
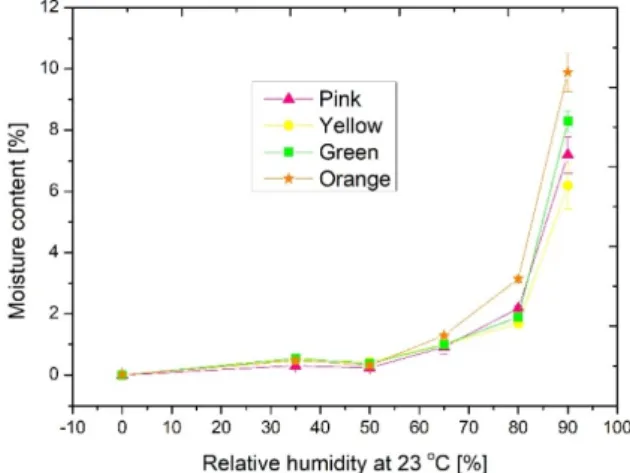
Sorption isotherms are key parameters of insulation materials from an application point of view. The sorption isotherm curves presented the dependency between the equilibrium moisture content and the relative humidity at a certain temperature: in our case, at 23 ◦C. For the exact planning of the structures, it is necessary to know how the applied materials behave in a humid environment. With the combination of the dryer and the climatic chamber, their sorption isotherms were determined. These curves can be assessed using Brunauer, Emmett and Teller’s theory from the point of view of adsorption processes among solid material and vapor. Figure7 shows the measured sorption isotherms. The shape of the graphs shows a type III isotherm, which predicts strong cohesion forces between adsorbed molecules if the sample is hydrophobic. It can be seen that the extent of adsorption was high only under high pressures (over 70% relative humidity). This corresponds to multimolecular adsorption where the heat of adsorption of the monolayer is less than that of multilayers. As the heat of adsorption of the first layer approached zero, adsorption was delayed until near the saturation pressure limit.
From the sorption isotherm curves, it can be seen that the orange sample had the highest moisture content, which might have originated from its acrylic content, and the others had a nearly similar quantity [44]. Here, it was noticed that significant moisture content (10%) was detected for the orange sample under a high humidity level (at rh = 90%). It could be concluded that these materials can be used in cases where the relative humidity of the environment is below 70%.
Appl. Sci. 2021, 11, x FOR PEER REVIEW 13 of 19
3.3.2. Sorption Isotherm Measurement Results
Sorption isotherms are key parameters of insulation materials from an application point of view. The sorption isotherm curves presented the dependency between the equi‐
librium moisture content and the relative humidity at a certain temperature: in our case, at 23 °C. For the exact planning of the structures, it is necessary to know how the applied ma‐
terials behave in a humid environment. With the combination of the dryer and the climatic chamber, their sorption isotherms were determined. These curves can be assessed using Brunauer, Emmett and Teller’s theory from the point of view of adsorption processes among solid material and vapor. Figure 7 shows the measured sorption isotherms. The shape of the graphs shows a type III isotherm, which predicts strong cohesion forces between adsorbed molecules if the sample is hydrophobic. It can be seen that the extent of adsorption was high only under high pressures (over 70% relative humidity). This corresponds to multimolecu‐
lar adsorption where the heat of adsorption of the monolayer is less than that of multilayers.
As the heat of adsorption of the first layer approached zero, adsorption was delayed until near the saturation pressure limit. From the sorption isotherm curves, it can be seen that the orange sample had the highest moisture content, which might have originated from its acrylic content, and the others had a nearly similar quantity [44]. Here, it was noticed that significant moisture content (10%) was detected for the orange sample under a high humid‐
ity level (at rh = 90%). It could be concluded that these materials can be used in cases where the relative humidity of the environment is below 70%.
Figure 7. Sorption isotherms.
3.4. Investigations of the Thermal Degradation
3.4.1. Measurements of the Gross Combustion Heat
Thermal insulation materials should be fire retardant and should have a low gross combustion heat value (GHC < 7.5 MJ/kg). Fangrat [15] demonstrated that thermal degra‐
dation and combustion data can be accurately determined by bomb calorimetry. An un‐
wanted fire in a structure can be fatal. Unfortunately, in many cases, fires cause significant damages and tragedies, mainly due to improper storage from a fire protection point of view, improper use, improper construction, or decades of construction. Contemporary fire pro‐
tection is playing an increasingly important role, covering a growing segment of regulation.
Thus, investigations of the calorific values of insulation materials are vital. The gross com‐
bustion heat of the materials was measured after burning them under high pressure (30 bars) and in pure oxygen. The results showed that the highest combustion heat value was attributed to the orange sample, which could also have resulted from its declared acrylic content. Moreover, it could be concluded that all the other samples had a lower calorific value, approximately 2–4 MJ/kg. Figure 8 presents the combustion heats of the samples as a function of the as‐received densities.
Figure 7.Sorption isotherms.
3.4. Investigations of the Thermal Degradation
3.4.1. Measurements of the Gross Combustion Heat
Thermal insulation materials should be fire retardant and should have a low gross com- bustion heat value (GHC < 7.5 MJ/kg). Fangrat [15] demonstrated that thermal degradation and combustion data can be accurately determined by bomb calorimetry. An unwanted fire in a structure can be fatal. Unfortunately, in many cases, fires cause significant damages and tragedies, mainly due to improper storage from a fire protection point of view, improper use, improper construction, or decades of construction. Contemporary fire protection is playing an increasingly important role, covering a growing segment of regulation. Thus, investigations of the calorific values of insulation materials are vital. The gross combustion heat of the materials was measured after burning them under high pressure (30 bars) and in pure oxygen. The results showed that the highest combustion heat value was attributed to the orange sample, which could also have resulted from its declared acrylic content.
Moreover, it could be concluded that all the other samples had a lower calorific value, approximately 2–4 MJ/kg. Figure8presents the combustion heats of the samples as a function of the as-received densities.
Appl. Sci.2021,11, 4943 13 of 18
Appl. Sci. 2021, 11, x FOR PEER REVIEW 14 of 19
Figure 8. The gross combustion heat of the samples.
We noticed an interesting phenomenon in the structural changes of the samples after the bomb calorimetry measurements; all the samples took on a spherical shape after their combustion. To clarify this occurrence, the burned samples were analyzed by both scan‐
ning electron (at 3 Kv and M = 250×) and optical microscopy (M = 20×).
Figure 9 shows the microscope images and the EDS spectra of the burned samples. On the left‐hand side, the optical images of the samples showed a spherical residuum after burning. This was also indicated by the SEM images. Due to the high charge accumulation, the electron microscope had to be operated under a low vacuum. After evacuation to high vacuum (~10−7 mbar), the chamber was filled with high‐purity nitrogen up to 0.30 mbar. The observed strong charge accumulation effect suggested that after the calorimetry measure‐
ments, the spherical residuum was mostly formed of an oxide alloy. This was also confirmed by the fact that the elemental composition measurements clearly showed increasing oxygen content compared to the measured on the as‐prepared samples. It can also be stated from the composition measurements that most of the components remained in the samples, but they diffused out to the surface of the samples.
Figure 9. The optical microscopy (left), scanning microscopy (right), and EDS measurement results (down) of the burned sample.
Figure 8.The gross combustion heat of the samples.
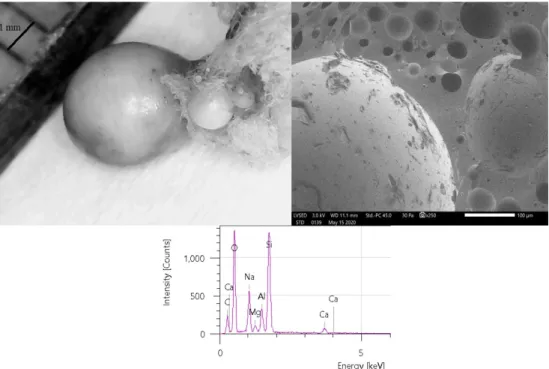
We noticed an interesting phenomenon in the structural changes of the samples after the bomb calorimetry measurements; all the samples took on a spherical shape after their combustion. To clarify this occurrence, the burned samples were analyzed by both scanning electron (at 3 Kv and M = 250×) and optical microscopy (M = 20×).
Figure9shows the microscope images and the EDS spectra of the burned samples.
On the left-hand side, the optical images of the samples showed a spherical residuum after burning. This was also indicated by the SEM images. Due to the high charge accumulation, the electron microscope had to be operated under a low vacuum. After evacuation to high vacuum (~10−7mbar), the chamber was filled with high-purity nitrogen up to 0.30 mbar. The observed strong charge accumulation effect suggested that after the calorimetry measurements, the spherical residuum was mostly formed of an oxide alloy.
This was also confirmed by the fact that the elemental composition measurements clearly showed increasing oxygen content compared to the measured on the as-prepared samples.
It can also be stated from the composition measurements that most of the components remained in the samples, but they diffused out to the surface of the samples.
Appl. Sci. 2021, 11, x FOR PEER REVIEW 14 of 19
Figure 8. The gross combustion heat of the samples.
We noticed an interesting phenomenon in the structural changes of the samples after the bomb calorimetry measurements; all the samples took on a spherical shape after their combustion. To clarify this occurrence, the burned samples were analyzed by both scan‐
ning electron (at 3 Kv and M = 250×) and optical microscopy (M = 20×).
Figure 9 shows the microscope images and the EDS spectra of the burned samples. On the left‐hand side, the optical images of the samples showed a spherical residuum after burning. This was also indicated by the SEM images. Due to the high charge accumulation, the electron microscope had to be operated under a low vacuum. After evacuation to high vacuum (~10−7 mbar), the chamber was filled with high‐purity nitrogen up to 0.30 mbar. The observed strong charge accumulation effect suggested that after the calorimetry measure‐
ments, the spherical residuum was mostly formed of an oxide alloy. This was also confirmed by the fact that the elemental composition measurements clearly showed increasing oxygen content compared to the measured on the as‐prepared samples. It can also be stated from the composition measurements that most of the components remained in the samples, but they diffused out to the surface of the samples.
Figure 9. The optical microscopy (left), scanning microscopy (right), and EDS measurement results (down) of the burned sample. Figure 9.The optical microscopy (left), scanning microscopy (right), and EDS measurement results
(down) of the burned sample.
Appl. Sci.2021,11, 4943 14 of 18
3.4.2. Differential Scanning Calorimetry Measurement Results
It has been demonstrated that differential scanning calorimetry is a good opportunity to disclose the thermal behavior and degradation of samples [18,37]. In order to correctly understand and reveal the thermal degradation of the samples, differential scanning calorimetry measurements were performed. From the DSC curves in Figure10, in the 30–350◦C temperature range the curves had a wide peak after the amorphous stage between 50 and 100◦C, and above this, a valley was present in the curves until 170◦C, except in the curve of the orange samples where a small peak (a melting event) at about 110◦C was also shown. It is supposed that this deviation also resulted from the different components of the orange sample (e.g., acryl). Above 110◦C, similar peaks were detected until 350◦C, possibly due to the crystallization (semi-crystalline part) of the samples.
Appl. Sci. 2021, 11, x FOR PEER REVIEW 15 of 19
3.4.2. Differential Scanning Calorimetry Measurement Results
It has been demonstrated that differential scanning calorimetry is a good opportunity to disclose the thermal behavior and degradation of samples [18,37]. In order to correctly understand and reveal the thermal degradation of the samples, differential scanning cal‐
orimetry measurements were performed. From the DSC curves in Figure 10, in the 30–350
°C temperature range the curves had a wide peak after the amorphous stage between 50 and 100 °C, and above this, a valley was present in the curves until 170 °C, except in the curve of the orange samples where a small peak (a melting event) at about 110 °C was also shown. It is supposed that this deviation also resulted from the different components of the orange sample (e.g., acryl). Above 110 °C, similar peaks were detected until 350 °C, possibly due to the crystallization (semi‐crystalline part) of the samples.
Figure 10. The DSC curves.
3.5. Raman Spectroscopy Measurement Results
As visible in the DSC spectra, orange samples were suspected to have another com‐
ponent or compound which was not visible in the EDS images. To reveal this compound and the difference in the composition or the bond structure of the orange material com‐
pared to the other three, the green and orange samples were examined by Raman micros‐
copy. Figure 11 reports the Raman spectra of the investigated samples. It is necessary to identify both spectra: the red dashed line belongs to the orange sample, while the black continuous line belongs to the green sample.
Figure 11. Raman spectra of the green and orange samples.
Figure 10.The DSC curves.
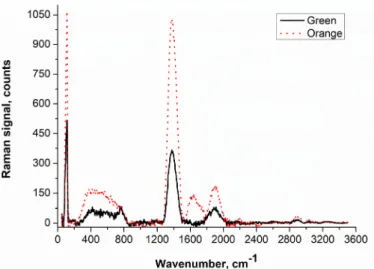
3.5. Raman Spectroscopy Measurement Results
As visible in the DSC spectra, orange samples were suspected to have another compo- nent or compound which was not visible in the EDS images. To reveal this compound and the difference in the composition or the bond structure of the orange material compared to the other three, the green and orange samples were examined by Raman microscopy.
Figure11reports the Raman spectra of the investigated samples. It is necessary to identify both spectra: the red dashed line belongs to the orange sample, while the black continuous line belongs to the green sample.
Appl. Sci. 2021, 11, x FOR PEER REVIEW 15 of 19
3.4.2. Differential Scanning Calorimetry Measurement Results
It has been demonstrated that differential scanning calorimetry is a good opportunity to disclose the thermal behavior and degradation of samples [18,37]. In order to correctly understand and reveal the thermal degradation of the samples, differential scanning cal‐
orimetry measurements were performed. From the DSC curves in Figure 10, in the 30–350
°C temperature range the curves had a wide peak after the amorphous stage between 50 and 100 °C, and above this, a valley was present in the curves until 170 °C, except in the curve of the orange samples where a small peak (a melting event) at about 110 °C was also shown. It is supposed that this deviation also resulted from the different components of the orange sample (e.g., acryl). Above 110 °C, similar peaks were detected until 350 °C, possibly due to the crystallization (semi‐crystalline part) of the samples.
Figure 10. The DSC curves.
3.5. Raman Spectroscopy Measurement Results
As visible in the DSC spectra, orange samples were suspected to have another com‐
ponent or compound which was not visible in the EDS images. To reveal this compound and the difference in the composition or the bond structure of the orange material com‐
pared to the other three, the green and orange samples were examined by Raman micros‐
copy. Figure 11 reports the Raman spectra of the investigated samples. It is necessary to identify both spectra: the red dashed line belongs to the orange sample, while the black continuous line belongs to the green sample.
Figure 11. Raman spectra of the green and orange samples.
Figure 11.Raman spectra of the green and orange samples.
Appl. Sci.2021,11, 4943 15 of 18
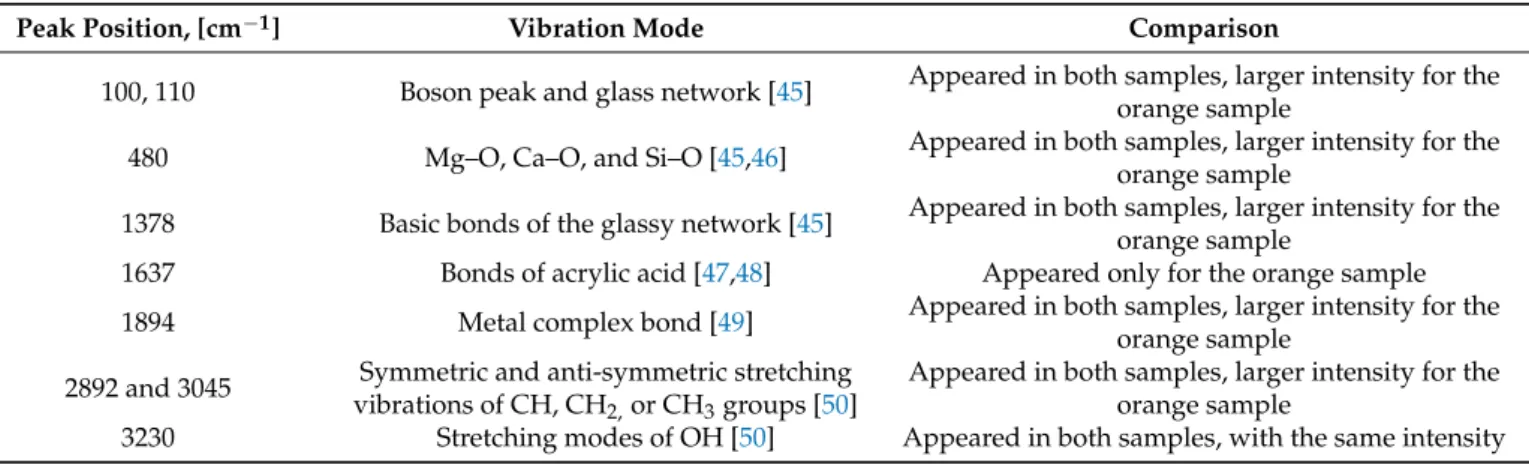
During the measurement, counts were registered at wavenumbers from 50 to 3600 cm−1. The changes of the main peaks, the Raman bands, are shown in Table6.
Table 6.Identification of the signs in Raman spectra.
Peak Position, [cm−1] Vibration Mode Comparison
100, 110 Boson peak and glass network [45] Appeared in both samples, larger intensity for the orange sample
480 Mg–O, Ca–O, and Si–O [45,46] Appeared in both samples, larger intensity for the orange sample
1378 Basic bonds of the glassy network [45] Appeared in both samples, larger intensity for the orange sample
1637 Bonds of acrylic acid [47,48] Appeared only for the orange sample
1894 Metal complex bond [49] Appeared in both samples, larger intensity for the orange sample
2892 and 3045 Symmetric and anti-symmetric stretching vibrations of CH, CH2,or CH3groups [50]
Appeared in both samples, larger intensity for the orange sample
3230 Stretching modes of OH [50] Appeared in both samples, with the same intensity
It was established that the boson peak (connected with the metallic content of the samples), the metallic oxide bonds, basic bonds of the glassy network, some organic bonds, and OH modes could be observed in both samples. However, the intensities of the peaks at the same investigation parameters were larger for the orange sample. This could be connected with the higher density of the material. Moreover, the Raman spectra of the orange sample contain peaks associated with acrylic acid: a band at the wavelength of 1637 cm−1is reported in Table6. All these structural components and differences could influence the previously shown experimental results. From the Raman spectra, it can also be concluded that all of the samples had an amorphous structure.
4. Conclusions
It is well known that the application of thermal insulation to reduce energy consump- tion is vital. Laboratory tests of insulation materials are very important for the better characterization and development of new materials. The declared values by the man- ufacturers are often not complete, which why more and more investigations should be conducted to verify performance. Measurements of the thermal and hygric properties are extremely important to find suitable insulation for any cases. This paper focused on the results of complex laboratory investigations for better understanding of the thermal hygric and morphological properties and behavior of four different micro-fiber glass wool insulation materials under different environmental circumstances. From the measurements, our conclusions are as follows:
• After examining the samples with scanning electron microscopy, it was revealed that the bases of the materials were mainly silicon, calcium, magnesium, sodium, alumina, and carbon, and possibly their oxides. Moreover, some also contained traces of sulfur. The results showed that the mean pore diameter of the cylindrical fibers varied between 0.5 and 7µm at random locations. The presence of colorized binders was also depicted. The increase in the fiber diameter increased the density and resulted in a better thermal insulation capability;
• Through thermal conductivity measurements, it was revealed that thermal conductiv- ity decreased with increasing density independently from the mean temperature of the samples, but due to their loose-filled structure, unfortunately, they cannot be used in situations where they would be exposed to significant mechanical effects. By only applying a 2 kPa load on the sample, their material thickness decreased. This assay determined the applicability limit of the samples;
• From the specific heat capacity measurements, it was shown that Cpvalues of the samples fitted in the normal range of insulation materials (~1000 J/kgK);