DOI: 10.1556/446.14.2018.S1.4
1786-335X @ 2018 Akadémiai Kiadó, Budapest
Thermal Properties of Selected Bee Products
MONIKA BOŽIKOVÁ1*–PETER HLAVÁČ* –VLASTA VOZÁROVÁ1– ZUZANA HLAVÁČOVÁ1–ĽUBOMÍR KUBÍK1–PETER KOTOULEK1–
JÁN BRINDZA2
1Faculty of Engineering, Department of Physics,
2 The Faculty of Agrobiology and Food Resources, Department of Genetics and Plant Breeding
Slovak University of Agriculture in Nitra, Tr. A. Hlinku 2, 949 76 Nitra, Slovak Republic
Abstract. Knowledge of bee products’ physical properties has a decisive importance for the monitoring of their quality. Thermophysical parameters are very important properties. Thermal conductivity and thermal diffusivity of selected bee products (honey, bee pollen and perga) were measured by two different methods. For identification of thermal conductivity and thermal diffusivity transient methods were used: Hot Wire (HW) and Dynamic Plane Source (DPS) method with an instrument Isomet 2104. The principle of measuring process is based on the analysis of time- temperature relation. In the first series of measurements thermal conductivity and diffusivity at constant laboratory temperature of 20 °C were measured. The second series was focused on identification of the changes in the thermophysical parameters during temperature stabilisation in the temperature range of 5–25 °C. For samples with constant temperature standard deviations and probable errors in % were calculated. For relations of thermal parameters to temperature graphical dependencies were obtained. Two different thermophysical methods were used for improvement of data reliability and data statistics.
Keywords: thermal conductivity, thermal diffusivity, honey, bee pollen, perga
Introduction
Controlled processes in manufacturing, handling, and holding require precise knowledge of physical quantities of materials and in quality evaluation of food materials it is important to know their physical properties, particularly the mechanical and thermophysical properties (Biczó
* Corresponding authors: Monika Božiková, Peter Hlaváč, Slovak University of Agriculture in Nitra, Faculty of Engineering, Department of Physics, Tr. A. Hlinku 2, 949 76 Nitra, Slovak Republic, phone: +421 37 641 4711, fax: +421 37 741 7003, E-mails:
Monika.Bozikova@uniag.sk, Peter.Hlavac@uniag.sk
et al., 2013; Zsom et al., 2016). The bee products such as honey, bee pollen and perga are very special food materials, which have high concentration of health-promoting substances. Some physical properties of bee products (especially honey) are mentioned in literature. Physicochemical characteristics of honey from different origins were described by El Sohaimy et al. (2015).
In this article theoretical parts from thermophysics – Hot Wire (HW) and Dynamic Plane Source (DPS) methods – and the results of thermal conductivity and thermal diffusivity measurements for three different types of bee products – honey, bee pollen and perga – are presented.
Materials and Methods
Natural honey is one of the most widely sought products due to its unique nutritional and medicinal properties, which are attributed to the influence of the different groups of substances it contains. Codex Alimentarius Commission defined honey as the natural sweet substance produced by honey bees (CAC 2001a, CAC 2001b).
Bee pollen is quite a varied plant product rich in biologically active substances. 200 substances were found in the pollen grains from different plant species. In the group of basic chemical substances, there are proteins, amino acids, carbohydrates, lipids and fatty acids, phenolic compounds, enzymes, and coenzymes as well as vitamins and bioelements (Campos et al., 2010, Cuoto and Cuoto, 2006, Pereira et al., 2006).
Perga is also called fermented pollen, pergolas and bee bread. Perga is a fermented mixture of bee saliva, plant pollen, and nectar that the worker bees use as food for the larvae and for young bees to produce royal jelly.
Generally, physical properties of bee products as honey, bee pollen and perga are influenced by various factors such as: the type of flowers, way of processing and, most of all, area of origin, etc.
Our research was oriented to measuring of selected thermophysical properties such as thermal conductivity and thermal diffusivity of bee products. Thermal conductivity is mathematically defined by Fourrier’s law (1):
qG= −λ grad T
(1) where: q is density of thermal flow (W·m–2), λ is thermal conductivity
(W·m–1·K–1) and T is the thermodynamic temperature (K).
Thermal diffusivity a (m2·s–1) characterizes the velocity of the temperature equalization in material during non-stationary processes. This thermal parameter is defined by thermal conductivityλ, specific heat c (J·kg-1·K-1) and density ρ by equation (2):
a c λ
= ρ (2)
Both thermal parameters were measured by instrument Isomet 2104. In our case measurements of thermophysical parameters were realised by the needle probe. This needle probe contains a hot wire with heating function.
Measuring of thermal parameters was performed by simplified transient Hot Wire (HW) technique. The simplified HW method is a technique based on the measurement of the temperature rise of a linear heat source (hot wire) embedded in the tested material (Parsons – Mulligan, 1978;
Kadjo et al., 2008). For data comparison and for verifying of data reliability another transient method, the dynamic plane source (DPS) method described in literature (Cviklovič and Paulovič, 2014, Karawacki et al, 1992, Beck and Arnold, 2003) was used. Each thermophysical parameter was measured 50 times at constant laboratory temperature 20 °C and arithmetic average and relative probable error in % were obtained
Results and Discussion
In the first series of measurements the thermal conductivity and the thermal diffusivity of bee products were measured and results are summarised in Table 1. For each sample basic statistical characteristics were obtained:
arithmetic average and relative probable error in %. From the presented results it is evident that thermal conductivity of honey had the highest value 0.392 W.(m.K)–1± 0.62%. Thermal conductivity of granular bee pollen (0.124 W.(m.K)–1± 0.87%.) and perga (0.146 W.(m.K)–1± 1.21%) had similar values because of similar composition and relative moisture content. Before measurements the granules of perga were compacted to form unify structure, so the air gaps were partially removed.
Table 1. Results for 1st series of bee products thermophysical parameters measurement at constant temperature 20 °C
Coefficients Sample – honey
Arithmetic average Relative probable error
Thermal conductivity 0.392 W.(m.K)–1 ± 0.62%
Thermal diffusivity 0.094.10–6 m2.s–1 ± 0.93%
Sample – bee pollen
Arithmetic average Relative probable error Thermal conductivity 0.124 W.(m.K)–1 ± 0.87%
Thermal diffusivity 0.148.10–6 m2.s–1 ± 1.02%
Sample – perga
Arithmetic average Relative probable error
Thermal conductivity 0.146 W.(m.K)–1 ± 1.21%
Thermal diffusivity 0.133.10–6 m2.s–1 ± 2.02%
Temperature dependencies of thermal conductivity and thermal diffusivity (Figures 1–6) can be described by linear increasing functions (Eq.
3 and Eq. 4) for granular bee pollen sample and sample of perga. For honey’s thermal conductivity a linear increasing dependence was obtained (Eq. 3) and for relation of honey thermal diffusivity to the temperature was identified linear decreasing function (Eq. 5):
0
A B t λ= + ⎜ ⎟⎛ ⎞t
⎝ ⎠ [W.(m.K)-1] (3)
0
a C D t t
= + ⎜ ⎟⎛ ⎞
⎝ ⎠ [m2.s-1] (4)
0
a E F t t
= − ⎜ ⎟⎛ ⎞
⎝ ⎠ [m2.s-1] (5)
where: t – temperature [°C], to – equals to 1°C, λ – thermal conductivity [W.(m.K) –1], a – thermal diffusivity [m2.s–1], A, B, C, D, E, F – are constants
dependent on the type of material. In all cases the coefficients of determination were very high (Table 2).
Figs 1 and 2. Relation of honey thermal conductivity and diffusivity to temperature during the temperature stabilisation in the temperature range of 5–25 °C Table 2. Coefficients A, B, C, D, E, F of regression Eqs 3, 4 and 5 and coefficients of
determinations (R2) for 2nd series of bee products thermophysical parameters measurement during the temperature stabilisation in the temperature range of 5–25 °C
Coefficients Sample – honey
Thermal conductivity, W.(m.K)–1 A B R2
0.359 0.002 516 0.993 48
Thermal diffusivity, mm2.s–1 E F R2
0.115 0.001 529 0.988 17 Sample – bee pollen
Thermal conductivity, W.(m.K)–1 A B R2
0.095 0.001 956 0.994 52
Thermal diffusivity, mm2.s–1 C D R2
0.097 0.003 541 0.986 89
Sample – perga
Thermal conductivity, W.(m.K)–1 A B R2
0.114 0.002 345 0.990 95
Thermal diffusivity, mm2.s–1 C D R2
0.095 0.002 559 0.991 356
7.5 12.5 17.5 22.5
5.0 10.0 15.0 20.0 25.0
Temperature , °C 0.35
0.37 0.39 0.41
0.34 0.36 0.38 0.40 0.42
Thermal conductivity , W.(m.K)-1
7.5 12.5 17.5 22.5
5.0 10.0 15.0 20.0 25.0
Temperature , °C 0.085
0.095 0.105 0.115
0.080 0.090 0.100 0.110 0.120
Thermal diffusivity , x E-6 m2.s-1
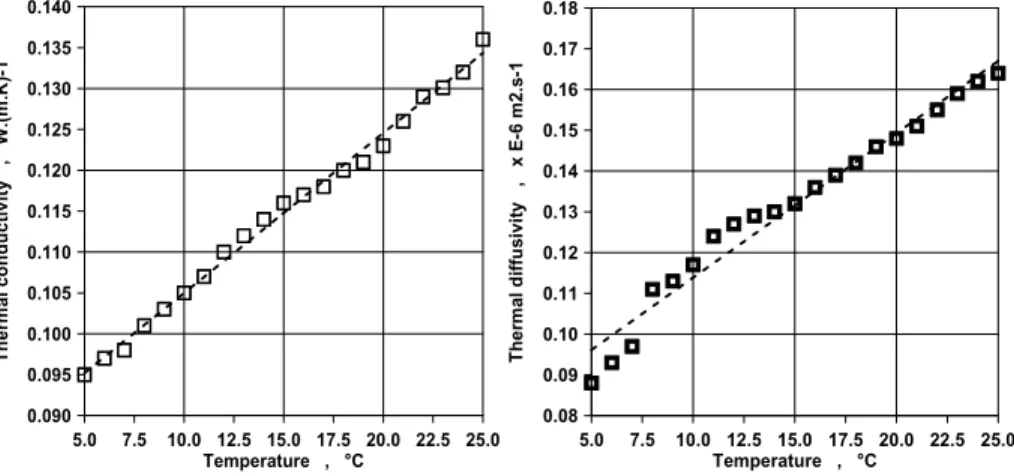
Figs 3 and 4. Relation of granular bee pollen thermal conductivity and diffusivity to temperature during the temperature stabilisation in the temperature range of 5–25 °C
All results obtained for thermal conductivity and thermal diffusivity of honey are in good agreement with the literature: White (1975). From the presented results for thermophysical measurements it is clear that the thermal conductivity of high viscosity liquids or suspensoid materials can be measured both with HW and DPS method. The thermophysical parameters as thermal conductivity and thermal diffusivity of perga and bee pollen were not presented in the literature, so the presented values are new in this research field. The results of thermal parameters obtained by HW and DPS method for perga and bee pollen samples were very similar.
From the practise point of view for measurement of compact samples DPS method is more appropriate and for measurement of granular samples HW method is better. For the data reliability protection, a series of fifty measurements were done for every point in the presented graphic relations (Figs 1–6). Each point in the graphics characteristics was obtained as the average of the measured values.
Accurate values of thermal properties are critical for practical design as well as theoretical studies and analysis, especially in the fields of heat transfer and thermal processing. The knowledge of materials thermophysical properties is significant in the context of liquid, compact and granular biomaterials. Biomaterials are often thermally processed or they are exposed to natural changes of temperature conditions, so it is necessary to have knowledge about their thermal characteristics.
7.5 12.5 17.5 22.5
5.0 10.0 15.0 20.0 25.0
Temperature , °C 0.095
0.105 0.115 0.125 0.135
0.090 0.100 0.110 0.120 0.130 0.140
Thermal conductivity , W.(m.K)-1
7.5 12.5 17.5 22.5
5.0 10.0 15.0 20.0 25.0
Temperature , °C 0.09
0.11 0.13 0.15 0.17
0.08 0.10 0.12 0.14 0.16 0.18
Thermal diffusivity , x E-6 m2.s-1
Figs 5 and 6. Relation of perga thermal conductivity and diffusivity to temperature during the temperature stabilisation in the temperature range of 5–25 °C
Conclusions
The results of experiments obtained by HW method and DPS method showed that both methods are suitable for identification of bee products thermal parameters. The values of thermal conductivity and thermal diffusivity obtained by the implementation of HW method and DPS method on honey, granular bee pollen and perga samples can be compared only with ranges of honey thermal parameters presented in the literature because of the bee products variety. In the literature the presented values for thermal conductivity of honey are in the range of λ = 0.350–0.422 W.(m.K)–1 and for thermal diffusivity of honey the mentioned values are in the range of a = 0.085–0.120 .10–6 m2.s–1. The examined samples of honey have thermal conductivity and thermal diffusivity from these ranges. Results for samples – perga and bee pollen – have not been presented in the literature yet, so they could not be compared.
Temperature dependencies of the examined bee products’ thermal conductivity and thermal diffusivity had linear increasing shape (Figs 1, 3, 5 and Figs 4, 6), except for the relation between honey thermal diffusivity and temperature, which had linear decreasing progress. It was caused by honey composition and structure. This result is in accordance with results presented in the literature. All temperature dependencies had very high coefficients of determination, which are presented in Table 2.
The presented results showed that thermophysical parameters have a significant connection with the quality of bee products. The detailed
7.5 12.5 17.5 22.5
5.0 10.0 15.0 20.0 25.0
Temperature , °C 0.115
0.125 0.135 0.145 0.155
0.110 0.120 0.130 0.140 0.150 0.160
Thermal conductivity , W.(m.K)-1
7.5 12.5 17.5 22.5
5.0 10.0 15.0 20.0 25.0
Temperature , °C 0.09
0.11 0.13 0.15
0.08 0.10 0.12 0.14 0.16
Thermal diffusivity , x E-6 m2.s-1
knowledge about thermophysical characteristics of bee products during thermal manipulation can improve their technological processes and storage.
Acknowledgement
This work was supported by project KEGA 017-SPU 4/2017 of Ministry of Education, Science, Research, and Sport of the Slovakia and was co-funded by European Community under project no 26220220180: Building Research Centre „AgroBioTech“.
References
Beck, J. V., Arnold, K. J. (2003). Parameter estimation in engineering science. John Wiley, New York, 522 p.
Biczó, V., Fekete, A., Scherer, R. (2013). Influence of composition and storage conditions on chocolate hardness and heat resistance. Progress in Agricultural Engineering Sciences, 9(1): 55–73.
Campos, M., Firgerio, C., Lopes, J., Bogdanov, S. (2010). What is the future of bee-pollen?
Journal of Analytical Atomic Spectrometry, 2: 131–144.
Codex Alimentarius Commission (2001a). Codex Standard for Honey, FAO, Rome. Alinorm 1: 19–26.
Codex Alimentarius Commission (2001b). Codex Standard 12, Revised Codex Standard for Honey, Standards and Standard Methods 11, 8 p.
Couto, R. H. N., Couto, L. A. (2006). Apicultura: Manejo e Produtos, Funep, Jaboticabal, 3rd edition, 193 p.
Cviklovič, V., Paulovič, S. (2014). Using selected transient methods for measurements of thermophysical parameters of building materials. Acta Technologica Agriculturae, 17(1): 21–23.
El Sohaimy, S. A., Masry, S. H. D., Shehata, M. G. (2015). Physicochemical characteristics of honey from different origins. Annals of Agricultural Sciences, 60(2): 279–287.
Kadjo, A., Garnier, J. P., Maye, J. P., Martemianov, S. (2012). A new transient two-wire method for measuring the thermal diffusivity of electrically conducting and highly corrosive liquids using small samples. International Journal of Thermophysics, vol.
29(4): 1267–1277.
Karawacki, E., Suleiman, B. M., Ul-Hang, I., Nhi, B. T. (1992). An extension to the dynamic plane source technique for measuring thermal conductivity, thermal diffusivity and specific heat of solids. Review of Scientific Instruments, 63: 4390–4397.
Parsons Jr., J. R., Mulligan, J. C. (1978). Measurement of the properties of liquids and gases using a transient hot-wire technique. Review of Scientific Instruments, 49(10):
1460–1463.
Pereira, F. M., Freitas, B. M., Vieira Neto, J. M., Lopes, M. T. R., Barbosa, A. L., De Camargo, R. C. R. (2006). Desenvolvimento de colônias de abelhas com diferentes alimentos protéicos. Pesquisa Agropecuária Brasileira, 41(1): 1–7.
Zsom, T., Zsom-Muha, V., Dénes, D. L., Baranyai, L., Felföldi, J. (2016). Quality changes of pear during shelf-life. Progress in Agricultural Engineering Sciences, 12(1): 81–106.