https://doi.org/10.1007/s10973-020-10022-4
Experimental investigation of rheological properties and thermal conductivity of SiO
2–P25 TiO
2hybrid nanofluids
Thong Le Ba1 · Zalán István Várady1 · István Endre Lukács2 · János Molnár3 · Ida Anna Balczár4 · Somchai Wongwises5,6 · Imre Miklós Szilágyi1
Received: 19 May 2020 / Accepted: 2 July 2020 / Published online: 21 July 2020
© The Author(s) 2020
Abstract
Over many years, great efforts have been made to develop new fluids for heat transfer applications. In this paper, the thermal conductivity (TC) and viscosity of SiO2–P25 TiO2 (SiO2–P25) hybrid nanofluids were investigated for different nanoparticle volume concentrations (0.5, 1.0 and 1.5 vol%) at five various temperatures (20, 30, 40, 50 and 60 °C). The mixture ratio (SiO2:P25) in all prepared hybrid nanofluids was 1:1. Besides, pure SiO2, P25 nanofluids were prepared with the same con- centrations for comparison with the hybrid nanofluids. The base fluid used for the preparation of nanofluids was a mixture of deionized water and ethylene glycol at a ratio of 5:1. Before preparing the nanofluids, the nanoparticles were analyzed with energy-dispersive X-ray analysis, scanning electron microscope, X-ray powder diffraction, and Fourier transform infrared spectroscopy. The zeta potentials of the prepared nanofluids except SiO2 nanofluids were above 30 mV. These nanofluids were visually observed for stability in many days. The TC enhancement of the hybrid nanofluid was higher than the pure nanofluid. In particular, with 1.0 vol% concentration, the maximum enhancement of SiO2, P25 and SiO2–P25 nanofluids were 7.5%, 9.9% and 10.5%, respectively. The rheology of the nanofluids was Newtonian. The viscosity increment of SiO2, P25 and hybrid nanofluids were 19%, 32% and 24% with 0.5 vol% concentration. A new correlation was developed for the TC and dynamic viscosity of SiO2–P25 hybrid nanofluid.
Keywords Silicon dioxide · Titanium dioxide · Base fluid · Nanofluids · Thermal conductivity · Viscosity
Introduction
Masuda et al. [1] and Choi [2] started working with nano- fluids as an effective heat transfer fluid. In recent years, the nanofluids have become more popular due to the
improvement of their thermal characteristics compared to conventional fluids like EG, water and oil. There are a lot of engineering applications of nanofluids such as solar
* Thong Le Ba kenty9x@gmail.com Zalán István Várady varadyzalan@gmail.com István Endre Lukács lukacs.istvan@energia.mta.hu János Molnár
molnar.janos@mail.bme.hu Ida Anna Balczár
balczari@almos.uni-pannon.hu Somchai Wongwises somchai.won@kmutt.ac.th Imre Miklós Szilágyi imre.szilagyi@mail.bme.hu
1 Department of Inorganic and Analytical Chemistry, Budapest University of Technology and Economics, Muegyetem rakpart 3., Budapest 1111, Hungary
2 Centre for Energy Research, Institute for Technical Physics and Materials Science, Hungarian Academy of Sciences, Konkoly Thege M. út 29-33, Budapest 1121, Hungary
3 Department of Physical Chemistry and Materials Science, Budapest University of Technology and Economics, Muegyetem rakpart 3., Budapest 1111, Hungary
4 Institute of Materials Engineering, Faculty of Engineering, University of Pannonia, Egyetem út 10, Veszprém 8200, Hungary
5 Department of Mechanical Engineering, Faculty
of Engineering, King Mongkut’s University of Technology Thonburi, Bangmod, Bangkok 10140, Thailand
6 National Science and Technology Development Agency (NSTDA), Khlong Luang, Pathum Thani 12120, Thailand
thermal, automobile and electronic cooling applications [3–8]. It is evidenced that the TC of nanofluids mostly depends on the property of nanoparticles [9].
Compared to the standard nanofluid, hybrid nanoflu- ids (HNs) offer even more possibilities. The composite nanofluids or HNs are the colloidal dispersion of two or more kinds of nanoparticles with the BF [10]. Accord- ing to Sundar et al. [11], there are three main types of HN: metal matrix, ceramic matrix and polymer matrix nanocomposites. The nanoparticles can be prepared by various techniques or by the combination of different techniques such as ball milling, chemical vapor deposi- tion and plasma treatment [12–16]. There are two types of nanofluid preparations, including a one-step method and a two-step method. In the first one, the production of nanoparticles and dispersion of nanoparticles into BF are combined in one step. In the two-step method, the nanoparticles are prepared first and then dispersed into the BFs [17]. Because of new characteristics, HNs have been investigated with different nanoparticles, BFs, tem- peratures and concentrations. Nabil et al. [18] and Ganvir et al. [19] presented some reviews about their thermo- physical properties. Hybrid nanofluid with carbon nano- tubes grafted to alumina/iron oxide spheres dispersed in poly-alpha-olefin was studied by Han et al. [20]. A TC enhancement of 21% for a volume concentration of 0.2%
was obtained. The carbon nanotubes play an important role in the augmentation of TC. The Al2O3–Cu/water HNs with volume concentrations from 0.1 to 2% were investigated by Suresh et al. [21]. A maximum TC enhancement of 12.11% compared to single Al2O3 was shown at a volume concentration of 2%. Madhesd et al. [22] investigated Cu- TiO2 HNs in the application of water-based coolant. The TC of the fluid increased by 48.4% compared to the BF of water up to 0.7 vol% of the hybrid nanocomposite. It was found that the functionalized surface and the high crystallinity of the nanocomposite improved the enhance- ment of TC. In recent years, further investigations on the viscosity of HNs have been performed [23–26]. A numeri- cal study on hybrid nanocomposite of TiO2, Al2O3 and SiO2 nanoparticles dispersed in water was performed [27].
Al2O3 (25%) was mixed with TiO2 (75%) or SiO2 (75%) for preparing HNs at concentrations of 0.5, 1.0 and 1.5 vol%. An experimental investigation on the rheological behavior of Fe–CuO HNs was performed in water–EG at a proportion of 20:80 vol%. The concentration range of HNs was 0.04–1.5 vol%. They found that at low concen- tration, the rheology of HNs was Newtonian, whereas at high concentration, HN exhibited non-Newtonian behavior (shear-thinning) [28]. Sundar et al. and Zakaria et al. [29,
30] investigated the TC of nanofluids with the BF of DW and EG mixture. They found that the enhancement of TC was affected by volume concentration and temperature.
Additionally, the particle size and stability of nanofluid contributed to the improvement of TC [31, 32]. It was found that the combination of nanofluids has higher TC and lower dynamic viscosity [33–35].
From the results of Agresti et al. [36] and Turgut et al. [37], the TC of pure TiO2 nanofluid was higher than of pure SiO2 nanofluid; meanwhile, the viscosity of SiO2 nanofluid was lower than of TiO2 nanofluid. Producing hybrid or composite nanofluids from SiO2 and TiO2 nanoparticles is expected to enhance the useful characteristic of single nanofluids, such as higher TC of TiO2 nanofluid and lower viscosity of SiO2 nanofluid. Some works have been performed to evaluate the TC of SiO2–TiO2 HNs. Nabil et al. used TiO2 (50 nm) and SiO2 (22 nm) nanoparticles for investigating the heat trans- fer enhancement of HNs with different concentrations (0.5–3 vol%), temperatures (30–80 °C), BF ratios, nanoparticle ratios and forced convection mode [35, 38–40]. They found that the TC enhancement of HNs was 22.1% at 3.0 vol% and 70 °C compared to the BF. Meanwhile, 62.5% increment of relative viscosity was observed for 3.0% volume concentration.
Due to the instability in nanofluids, the aggregation of nan- oparticles causes a decrease in the thermo-physical character- istics. This is a critical problem for nanofluids, which limits their engineering applications. The preparation of nanofluids with good stability is the priority challenge [41, 42]. Nanopar- ticles cause the TC and viscosity of nanofluids to be higher due to the motion of nanoparticles in suspension. The instability of nanofluids and higher viscosity result in decreasing the heat transfer. Therefore, the stability, viscosity and TC should be investigated in detail [17]. Besides, the results obtained in dif- ferent research groups are not consistent. Also, studying the properties of the nanofluids is often not completely performed.
The theoretical understanding of the mechanisms is the lack of improvement of properties [43].
To the best of authors’ knowledge, there are no reports on the TC enhancement and viscosity of these SiO2–P25 HNs. The purpose of this research is to prepare the stable SiO2–P25 HNs with SiO2 (10–20 nm) and P25 (21 nm) nan- oparticles and investigate their rheological property and TC.
The experimental study is conducted for 0.5, 1.0 and 1.5%
volume concentrations with the nanoparticle mixture ratio (SiO2:P25) of 1:1. The temperatures during the experiments are from 20 to 60 °C. The properties of the nanoparticles are investigated with EDX, SEM, XRD and FT-IR. Lastly, the relevant correlations are proposed using the results of the present study.
Materials and methods
MaterialsSilicon dioxide (SiO2) nanopowder (99.5%, 10–20 nm, 637238-50G), P25 titanium dioxide (P25) nanopowder ( ≥ 99.5%, 21 nm, 718467-100G) and ethylene glycol ( ≥ 99%, 102466-1L) were purchased from Sigma-Aldrich, Hungary.
The materials were analytical reagent grades and utilized as original, with no other change. DI and EG were used as BFs. DI was produced in the Department of Inorganic and Analytical Chemistry laboratory, Budapest University of Technology and Economics (Hungary). Tables 1 and 2 show the properties of P25, SiO2 nanoparticles, ethylene glycol and water.
Preparation of nanofluid
SiO2, P25 nanofluids and SiO2–P25 HNs were prepared by dispersing different amounts of SiO2, P25 nanoparticles and SiO2–P25 mixture (1:1 volume ratio) in DI and EG mixture (5:1). SiO2–P25 in amounts of 0.5 vol%, 1.0 vol% and 1.5 vol% was dispersed in an appropriate mass of DI and EG.
Then, SiO2–P25 HN colloidal solutions were sonicated at 130 W and 45 kHz using an ultrasonication instrument for 1 h. Table 3 shows pure SiO2, P25 nanofluids and SiO2–P25 HN sample specifications.
Characterization methods
The crystal structure of SiO2 and P25 was investigated by using PANalytical X’PERT PRO MPD XRD with Cu Kα irradiation. Data were collected for the 2θ range of 5° to 65° at a resolution of 3 degrees/min. Morphological char- acterization of SiO2 and P25 was done by LEO 1440 XB SEM at 5 kV in a high vacuum mode with a secondary electron detector. The chemical composition of SiO2 and P25 was studied by using EDX analysis with JEOL JSM- 5500LV electron microscope. Infrared spectra of nanopo- wders were studied by Excalibur FTS 3000 Bio-Rad FT-IR in the 400–4000 cm−1 domain in transmittance mode, the
sensitivity of measurements was 4 cm−1, and the number of scans was 64.
A Brookhaven ZETAPALS device was used for ZP meas- urement of SiO2–P25 HNs. The ZP (ζ) was obtained from electrophoretic mobility (EM) of particles thanks to the Henry equation by applying the Smoluchowski approxima- tion [46]. Each sample was tested three times, and the aver- age value was reported.
The rheological behavior of SiO2–P25 HN was measured using a rotation viscometer (Anton Paar Physica MCR 301) at different shear rates and temperatures. The number of data points per measurement was 15. The amplitude was 5%, and the angular frequencies were between 0.6 and 3600 s−1.
The TC of SiO2–P25 HN samples was measured based on the modified transient plane source technique using a TCi Thermal conductivity analyzer. The TC of all samples was measured at five different temperatures of 20, 30, 40, 50 and 60 °C. A temperature-controlled oven was used to maintain the temperature at the desired set point. All samples were kept in the oven for 30 min to reach that temperature. Three TC measurements were taken for each sample, and an aver- age value was reported.
Table 1 Properties of P25 and SiO2 nanoparticles [44]
Properties SiO2 P25
Color White White
Molecular mass/g mol−1 60.08 79.87
Average particle diameter/nm 10–20 21
Density/kg m−3 2220 4260
Melting point/°C 2230 1850
Table 2 Properties of ethylene glycol and water [45]
Properties Ethylene glycol Water
Formula C2H6O2 H2O
Molecular mass/g mol−1 62.07 18.02
Freezing point/°C − 12.7 0
Boiling point, at 101.3 kPa/°C 198 100
Viscosity at 20 °C/mPas 20.9 1
Density/kg m−3 1113 997
Thermal conductivity/W mK−1 0.258 0.609
Specific heat at 20 °C/J kg−1 K−1 2347 4186
Table 3 Specification of SiO2, P25 nanofluids and SiO2–P25 hybrid nanofluid samples
Sample names SiO2/vol% P25/vol% DI and EG mixture (5:1)/
vol%
SiO2-0.5 0.50 0.00 99.50
SiO2-1.0 1.00 0.00 99.00
SiO2-1.5 1.50 0.00 98.50
P25-0.5 0.00 0.50 99.50
P25-1.0 0.00 1.00 99.00
P25-1.5 0.00 1.50 98.50
SiO2–P25-0.5 0.25 0.25 99.50
SiO2–P25-1.0 0.50 0.50 99.00
SiO2–P25-1.5 0.75 0.75 98.50
Results and discussion
SiO2 and P25 structureFigure 1 shows the XRD pattern of SiO2 and P25. For the XRD pattern of SiO2 (Fig. 1a), the amorphous nature of the used nano-SiO2 could be seen from the diffractogram [47]. The broad diffraction peak confirmed a completely amorphous structure. Except for a broad band centered at 2θ = 22.5°, there is no diffraction peak observed. This peak is the characteristic peak for amorphous SiO2. It also reveals no impurity peaks for SiO2 nanoparticles. Based on the XRD patterns of P25 (Fig. 1b), P25 consists of rutile and anatase phases. The anatase form is the main component with peaks at 2θ values of 25.4°, 37.9°, 48.1°, 54°, 55.1° and 62.8°. The rutile phase is an adjunct at 2θ values of 27.6°, 36.2°, 41.4°
and 54.4° [48]. There are not any lines corresponding to
any impurity phases, so the high purity of the P25 sample is indicated.
Figure 2 shows the SEM image of the morphological structure of nano-SiO2. It can be observed from the SEM image that nano-SiO2 has a nanosize of ca. 15 nm in accord- ance with the manufacturer’s specifications. The SEM image of nano-P25 is shown in Fig. 3. It can be found that the par- ticle size is 10–20 nm. The P25 and SiO2 nanoparticles tend to stick together into the larger particles. The aggregation size of SiO2 is larger than of P25.
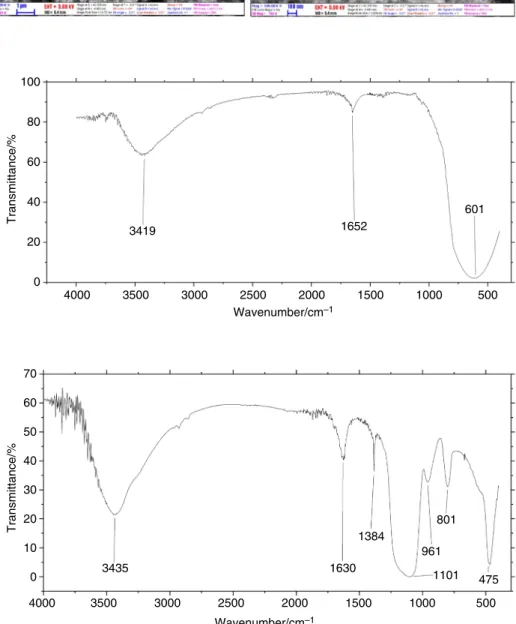
The functional groups support the achievement of a proper dispersion. The FT-IR spectrum of P25 nanoparti- cles is shown in Fig. 4. The broadband centered at around 600 cm−1 is assigned to the bending vibration (Ti–O-Ti) bonds in the TiO2 lattice. The broadband centered at around 3420 cm−1 is attributed to the intermolecular interaction of the hydroxyl group (–OH) with H2O molecule on TiO2
400 (a) 1000 (b)
900 800 700 600 500 400 300 200 100
020 25 30 35 40 45 50 55 60 65
Intensity/cps Intensity/cps
300
200
100
5 10 15 20 25 30 35 40 45 50 55 60 2θ/°
0 65
2θ/°
Fig. 1 XRD pattern of SiO2 (a), P25 (b) at the following XRD circumstances: X-ray: 40 kV, 30 mA. Scan speed: 3.0° min−1
Fig. 2 SEM images of SiO2 nanoparticles
surface. The peak at around 1650 cm−1 confirms the typi- cal bending vibration of –OH group [49]. Figure 5 shows the FT-IR spectrum of SiO2 nanoparticles. The peaks at around 3420 cm−1 and 1630 cm−1 can be ascribed to the –OH stretching and bending vibrations of absorbed water molecules on the SiO2 nanoparticles, respectively. The
peaks at 1101 and 475 cm−1 refer to the Si–O-Si asymmetric stretching and bending vibrations. The Si–O bond stretching vibration appears at 1384 cm−1. The peaks at 961 cm−1 and 801 cm−1 are attributed to the Si–O-(H-H2O) bending vibra- tions and in-plane bending vibrations of geminol groups, respectively.
Fig. 3 SEM images of P25 nanoparticles
Fig. 4 FT-IR spectrum of P25
nanoparticles 100
Transmittance/%
80 60 40 20
4000
Wavenumber/cm–1 3500
3419 1652
601
3000 2500 2000 1500 1000 500
0
Fig. 5 FT-IR spectrum of SiO2
nanoparticles 70
Transmittance/%
60 50 40 30 20 10 0
4000 3500
3435 1630
1384
961 1101
801
475
3000 2500 2000
Wavenumber/cm–1
1500 1000 500
Table 4 contains the EDX results of P25 and SiO2 nan- oparticles. The results are the average values of different measurement points in the atomic percentage. These results confirm the chemical composition of the used nanoparticles.
Zeta potential measurement
Table 5 shows the ZP of 0.5 vol% SiO2–P25 HN with dif- ferent surfactants. For improving the stability of SiO2–P25 HN, different surfactants are used such as CTAB (cetyl tri- methylammonium bromide), SDBS (sodium dodecylbenze- nesulfonate), SCMC (sodium carboxymethylcellulose) and TX (Triton X-100). Among the used surfactants, the CTAB gives the best result with − 19.09 mV. According to the ZP values, the SiO2–P25 HNs have the best stability without any surfactants. However, by visual observation, it can be seen that the role of surfactant is not much important in improv- ing the stability of the HNs. Further studies can focus on the stability of nanofluid by changing surfactant concentration, other types of surfactants and solvents.
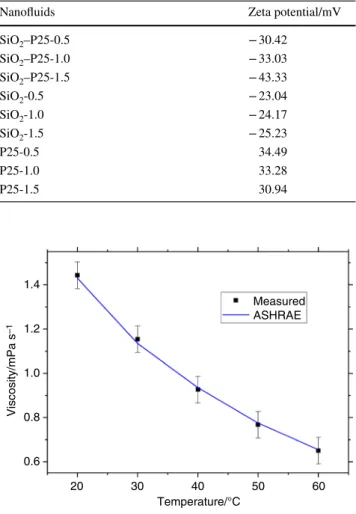
Colloidal solutions with ZP s lower − 30 mV have acceptable stability [50, 51]. Table 6 shows ZP values of SiO2, P25 pure nanofluids and SiO2–P25 hybrid nanoflu- ids with different concentrations. The ZP of 0.5, 1.0 and 1.5 vol% SiO2–P25 HN was − 30.42 mV, − 33.03 mV and − 43.33 mV, respectively. This shows the stability of nanofluids. These ZP values indicate the slower aggrega- tion behavior of SiO2–P25 nanoparticles by increasing the concentration. It means that by increasing the concentra- tions of nanofluids, the negative electrical surface charge of SiO2–P25 increased; thus, the -OH groups were ionized. P25 nanofluids provide good stability with high ZP. ZP results showed that SiO2 nanofluids have moderate stability. By
visual observation, it is confirmed that these nanofluids are stable for several days.
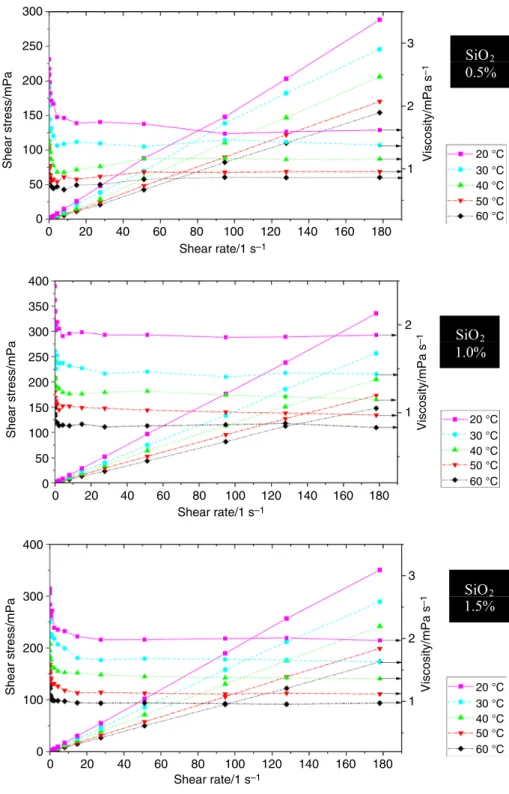
Rheological properties of SiO2–P25 hybrid nanofluid The viscosity of the BF was measured, and the results are compared to the literature in order to verify the measure- ment. The results are compared to the BF in the ASHRAE standard [45] as shown in Fig. 6. The maximum error is less than 1.0%, and the measurements are trustable.
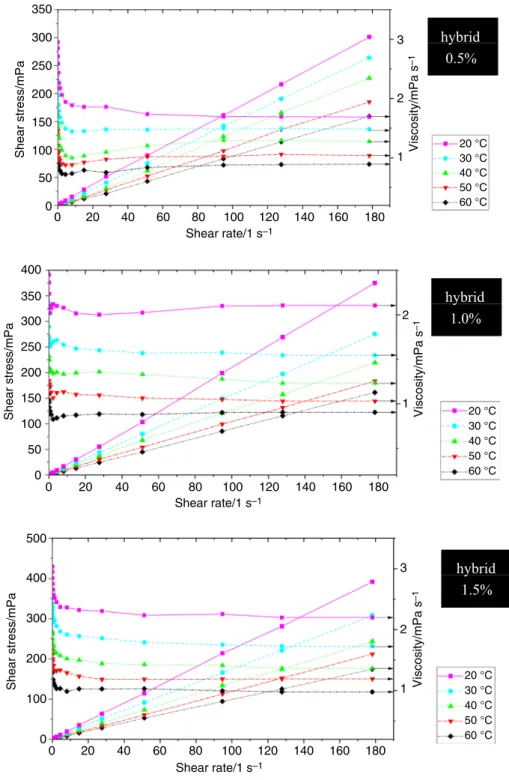
For determining the rheological behaviors of SiO2–P25 HNs, the shear stress at different shear rates is investigated for three volume concentrations of 0.5, 1.0 and 1.5 at five temperatures: 20, 30, 40, 50 and 60 °C as shown in Fig. 7.
Shear stress of all SiO2–P25 HN samples decreases with increasing temperature and increases with increasing frac- tion of nanofluids.
Table 4 EDX results of P25 and
SiO2 nanoparticles SiO2/atom% P25/atom%
Si O Ti O
33.68 66.32 30.57 69.43
Table 5 ZP of 0.5 vol% SiO2–P25 nanofluids with different sur- factants
Surfactant ZP of 0.5 vol% SiO2–
P25 hybrid nanofluid/
mV
N/A − 30.42
CTAB − 19.09
SDBS − 10.46
SCMC − 10.09
TX − 17.34
Table 6 ZP of SiO2, P25 nanofluids and SiO2–P25 hybrid nanofluids with different concentrations
Nanofluids Zeta potential/mV
SiO2–P25-0.5 − 30.42
SiO2–P25-1.0 − 33.03
SiO2–P25-1.5 − 43.33
SiO2-0.5 − 23.04
SiO2-1.0 − 24.17
SiO2-1.5 − 25.23
P25-0.5 34.49
P25-1.0 33.28
P25-1.5 30.94
1.4
Measured ASHRAE
Viscosity/mPa s–1 1.2 1.0
0.8
0.6
20 30
Temperature/°C
40 50 60
Fig. 6 Comparison between the measured viscosity of DI/EG base fluid and ASHRAE results [45]
This reduction behavior of viscosity may be caused because higher temperature increases the Brownian and thermal motion of molecules and their average velocity, leading to weakened intermolecular interaction and adhe- sion forces between molecules [25, 52]. For low shear rates (less than 5 s−1), the nanofluid behaves as a non-Newtonian fluid or shear-thinning fluid. It means the viscosity of all HNs decreases with the increase in the shear rate. In a case of high shear rates, the viscosity of SiO2–P25 HNs is almost
independent of the applied shear rate. This means the HN is Newtonian as shown in Fig. 7. Bahrami et al. [28] and Nabil et al. [38] found the Fe–CuO nanofluids and TiO2-SiO2 nanofluids owned Newtonian rheological behavior for dif- ferent temperatures and concentrations. These results indi- cate that the properties of nanoparticles and temperature are important factors in the rheological properties of nanofluids.
The rheological behavior generally depends on particle size and morphology, nanoparticle fraction, BF, electro-viscous
Fig. 7 Shear stress–shear rates diagram
SiO2
SiO2
SiO2 300
Shear stress/mPa
250 200 150 100 50
0 20 40 60 80 100
Shear rate/1 s–1
120 140 160 180 3
20 °C 30 °C 40 °C 50 °C 60 °C
20 °C 30 °C 40 °C 50 °C 60 °C
20 °C 30 °C 40 °C 50 °C 60 °C 2
Viscosity/mPa s–1
1
3
2
1 2
1 0
300 350 400
Shear stress/mPaShear stress/mPa
250 200 150 100 50
0 20 40 60 80 100 120 140 160 180
0 20 40 60 80 100 120 140 160 180
0
300 400
200
100
0
0.5%
1.0%
1.5%
Shear rate/1 s–1
Shear rate/1 s–1
Viscosity/mPa s–1 Viscosity/mPa s–1
effects and solution chemistry-related surface layer [53].
Mehrali et al. showed that at low shear rates, the structure of fluid changes temporarily when the spindle rotates in the fluid, and molecules are gradually arranged in the direc- tion of increasing shear, causing less reduction in viscosity.
Nevertheless, the maximum amount of possible shear order- ing was attained as the shear rate was high enough. The larger aggregate molecules were broken down into smaller sizes, causing less viscosity [54]. With the presence of
P25
P25
P25
300
Shear stress/mPa
250 200 150 100 50
0 20 40 60 80 100
Shear rate/1 s–1
Shear rate/1 s–1
Shear rate/1 s–1
120 140 160 180 3
20 °C 30 °C 40 °C 50 °C 60 °C 2
Viscosity/mPa s–1Viscosity/mPa s–1Viscosity/mPa s–1
1
0 350
300
Shear stress/mPa
250 200 150 100 50
0 20 40 60 80 100 120 140 160 180 3
20 °C 30 °C 40 °C 50 °C 60 °C
20 °C 30 °C 40 °C 50 °C 60 °C 2
1
3
2
1 0
350 400
300
Shear stress/mPa
200
100
0 20 40 60 80 100 120 140 160 180
0 400
450
0.5%
1.0%
1.5%
Fig. 7 (continued)
nanoparticles in HNs, it can be explained that the viscosity of SiO2–P25 HNs is higher than the BF.
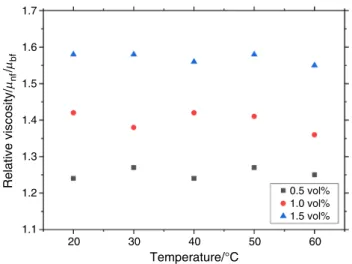
Figure 8 shows the relative viscosity of SiO2–P25 HNs.
The relative viscosity increases with the increase in the volume concentration, while temperature does not play an
important role. The lowest relative viscosity of 24% increase was obtained for 0.5% volume fraction, while the highest enhancement of relative viscosity was 58% for 1.5 vol%.
The relative viscosity increased from 24 to 58% compared to the BF.
0.5%
1.0%
1.5%
300
Shear stress/mPa
250 200 150 100 50
0 20 40 60 80 100
Shear rate/1 s–1
Shear rate/1 s–1
Shear rate/1 s–1
120 140 160 180 3
20 °C 30 °C 40 °C 50 °C 60 °C
20 °C 30 °C 40 °C 50 °C 60 °C
20 °C 30 °C 40 °C 50 °C 60 °C 2
Viscosity/mPa s–1 Viscosity/mPa s–1Viscosity/mPa s–1
1
0 350
300
Shear stress/mPaShear stress/mPa 250 200 150 100 50
0 20 40 60 80 100
500
400
300
200
100
0
120 140 160 180
0 20 40 60 80 100 120 140 160 180
2
1
2 3
1 0
350 400
hybrid
hybrid
hybrid Fig. 7 (continued)
Figure 9 shows a comparison of the relative viscosity between the present work (0.5 vol%) with the data from Nabil et al. [38]. The results from the present research show little higher relative viscosity than the literature between 20 and 60 °C. The SiO2 nanofluids still have the smallest relative viscosity, while the P25 nanofluids have the highest viscosity. The viscosity strongly depends on nanoparticles, BFs and concentrations.
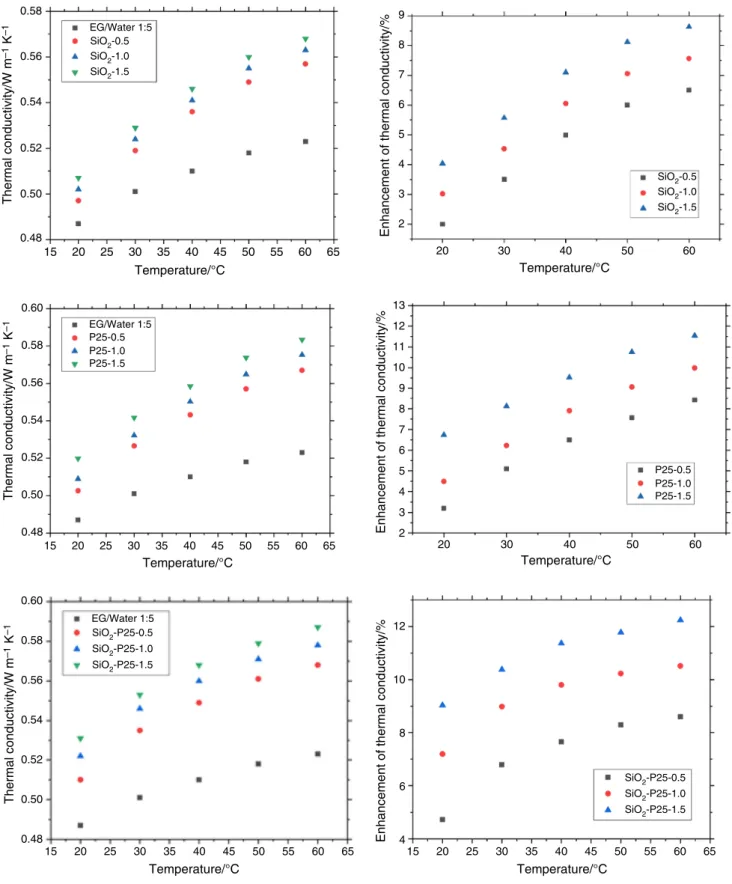
Thermal conductivity of SiO2–P25 hybrid nanofluid The TC of all SiO2–P25 HNs at various temperatures is shown in Fig. 10. The calibration tests for distilled water are
verified before the measurement of samples, and the results are obtained within 0.5% error. All SiO2–P25 HNs show higher TC compared to DI/EG mixture at all temperatures.
SiO2–P25 HNs at 0.5 vol%, 1.0 vol% and 1.5 vol% showed 4.72%, 7.19% and 9.03% TC enhancement compared to the EG/DI mixture at 20 °C, respectively. The TC of SiO2–P25 HNs is enhanced by increasing the temperature. Neverthe- less, the effect of temperature and concentration on the enhancement of TC is different. On the one hand, the tem- perature causes the TC of nanofluids to be higher because of the reduction in viscosity and the augmentation in Brown- ian motion of nanoparticles [55]. On the other hand, the relationship between TC enhancement and concentration of SiO2–P25 nanoparticles is not completely linear. This is understandable; as the number of nanoparticles in the solution increases, the TC of the solution also increases. In addition to the concentration and temperature, the extent of TC enhancement of nanofluids depends on the type of used nanomaterials, pH, surfactants and the type of BF, which influence the motion of particles in suspension.
Figure 11 shows the enhancement of TC obtained from the present work and previous studies. It can be seen that the TC of the HNs in the present research is higher than the TC of SiO2 pure nanofluid, P25 nanofluid and even SiO2–P25 HNs. This can be explained that P25 contributes greatly to increasing the TC of the HNs.
Regression correlations
The following correlation is proposed based on experimental data:
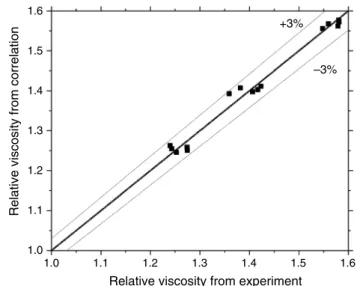
where μnf and μbf represent the viscosity of nanofluid and viscosity of BF, while φ and T are volume concentration and temperature. This correlation is valid for a range of concentrations 0≤𝛷≤1.5% and range of temperatures 30◦C≤T ≤70◦C . The average and standard deviations are 1.1% and 1.2%. The maximum deviation is found to be 2.4%. Figure 12 shows the tabulation of viscosity from the experiment and Eq. 1.
Meanwhile, Eq. 2 is proposed based on experimental data where knf and kbf represent the TC of nanofluid and TC of BF.
(1)
Relative viscosity=𝜇nf
𝜇bf =1.1036( 1+ T
70 )0.03667(
1+ 𝜙 100
)22.4472
, 1.7
Relative viscosity/µnf/µbf1.6 1.5 1.4 1.3 1.2
1.1
20 30 40
Temperature/°C
50 60
0.5 vol%
1.0 vol%
1.5 vol%
Fig. 8 Relative viscosity of SiO2–P25 HNs at different temperatures
1.4
1.3
Relative viscosity/µnf/µbf 1.2
1.1
15 20 25 30 35 40
Temperature/°C
45 50 55 60 65
SiO2-P25-0.5 (Present work) SiO2-TiO2-0.5 (Nabil et. al.) P25-0.5 (Present work) SiO2-0.5 (Present work)
Fig. 9 Comparison of the relative viscosity between the present work and the result of Nabil et al. [38]
0.58
EG/Water 1:5
EG/Water 1:5 P25-0.5 P25-1.0 P25-1.5
P25-0.5 P25-1.0 P25-1.5 SiO2-0.5
SiO2-1.0 SiO2-1.5
SiO2-0.5 SiO2-1.0 SiO2-1.5 0.56
Thermal conductivity/W m–1 K–1Thermal conductivity/W m–1 K–1Thermal conductivity/W m–1 K–1 0.54
0.52
0.50
0.48
15 20 25 30 35 40 Temperature/°C
0.60 13
12 11 10 9 8 7 6 5 4 3
2 20 30 40 50 60
0.58
0.56
0.54
0.52
0.50
0.48
15 20 25 30 35 40
Temperature/°C Temperature/°C
45 50 55 60 65
Temperature/°C 45 50 55 60 65
9 8 7 6
Enhancement of thermal conductivity/%Enhancement of thermal conductivity/%
5 4 3 2
20 30 40 50 60
0.60
12
Enhancement of thermal conductivity/%
10
8
6
415 20 25 30 35 40 45 50 55 60 65
0.58
0.56
0.54
0.52
0.50
0.4815 20 25 30 35 40
Temperature/°C Temperature/°C
45 50 55 60 65
EG/Water 1:5 SiO2-P25-0.5 SiO2-P25-1.0 SiO2-P25-1.5
SiO2-P25-0.5 SiO2-P25-1.0 SiO2-P25-1.5
Fig. 10 TC and enhancement of TC of pure SiO2, P25 and SiO2–P25 hybrid nanofluids at different temperatures
The average deviation and standard deviations are 0.30%
and 0.36%. The maximum deviation is found to be 0.79%.
The tabulation of TC from the experiment and Eq. 2 is shown in Fig. 13. From these results, it can be seen that the experimental data are inappropriate agreement with the correlation proposed.
(2) knf=k
bf∗1.0156( 1+ T
70
)0.0848( 1+ 𝜙
100 )3.474
,
Conclusions
Pure SiO2, P25 nanofluids and SiO2–P25 HNs were pre- pared using SiO2 and P25 nanoparticles for characterizing the properties of nanoparticles and HNs by different tech- niques. The volume concentrations of nanofluid were 0.5, 1.0 and 1.5 vol%. The mixture of DI and EG at a ratio of 5:1 was used as the BF of nanofluids. The viscosity and TC of HNs were studied from 20 to 60 °C. The SEM showed that SiO2-P25
Enhancement of thermal conductivity/%
12
10
8
6
4
0.5
Concentration of nanoparticles/vol%
20 °C 30 °C 40 °C 50 °C 60 °C
1.0 1.5
Fig. 10 (continued)
10
Enhancement of thermal conductivity/%
8
6
415 20 25 30 35 40 45 Temperature/°C
50 55 60 65
SiO2-P25-1.0 (Present work) SiO2-TiO2-1.0 (Nabil et. al.) P25-1.0 (Present work) SiO2-1.0 (Present work)
Fig. 11 Comparison of the enhancement of TC between the present work and the result of Nabil et al. [38]
1.6 +3%
–3%
1.5
Relative viscosity from correlation
1.4 1.3 1.2 1.1
1.01.0 1.1
Relative viscosity from experiment
1.2 1.3 1.4 1.5 1.6
Fig. 12 Comparison between measured relative viscosity and pro- posed correlation
0.60
knf= kbf* 1.0156 T
+1%
0.58 –1%
k from correlation/W m–1 K–1 0.56
0.54
0.52
0.50
0.50 0.52 0.54 0.56
k from experiment/W m–1 K–1
0.58 0.60
1 +70
0.0848 1 + φ 3.474
100
Fig. 13 Comparison between TC obtained from experiment and pro- posed correlation
the particle sizes of SiO2 and P25 nanoparticles were ca.
15 nm and 10–20 nm, respectively. From XRD, the prop- erty of SiO2 was amorphous, while P25 consisted of rutile and anatase phases. The infrared spectroscopy and elemen- tal analysis have stated the chemical properties of nano- particles and also the presence of functional groups on the surface of the particle. The stability of HNs was confirmed by ZP results. These nanofluids were visually observed in many days. The effective TC of HNs was improved up to 12.24% as compared to the mixture of BFs for 1.5 vol%
concentration. The TC enhancement of the hybrid nanofluid was higher than the pure nanofluid. In particular, with 1.0 vol% concentration, the maximum enhancement of SiO2, P25 and SiO2–P25 nanofluids are 7.5%, 9.9% and 10.5%, respectively. Rheological properties were studied, and it is seen that the rheology of HNs was Newtonian behavior. The viscosity increment of SiO2, P25 and hybrid nanofluids were 19%, 32% and 24% with 0.5 vol% concentration. Compared to the SiO2, P25 and hybrid SiO2–P25 nanofluids, it could be a good heat transfer fluid. The correlations of TC and vis- cosity for this type of nanofluid were developed. The results confirmed good accuracy.
Acknowledgements Open access funding provided by Budapest Uni- versity of Technology and Economics.
Author contributions IMS and TLB were involved in conceptualiza- tion; TLB, ZIV, IEL, JM and IAB took part in methodology; ZIV and TLB carried out investigation; IMS performed funding acquisition;
IMS collected the resources and supervised the study; TLB wrote the original draft; TLB, JM, SW and IMS wrote, reviewed and edited the manuscript. All authors have read and agreed to the published version of the manuscript.
Funding An NRDI K 124212 and an NRDI TNN_16 123631 Grants are acknowledged. The research within Project No. VEKOP-2.3.2-16- 2017-00013 was supported by the European Union and the State of Hungary, and co-financed by the European Regional Development Fund. The research reported in this paper was supported by the Higher Education Excellence Program of the Ministry of Human Capacities in the frame of Nanotechnology and Materials Science research area of Budapest University of Technology (BME FIKP-NAT) and Stipendium Hungaricum scholarship Grant.
Compliance with ethical standards
Conflict of interest The authors declare no conflict of interest.
Open Access This article is licensed under a Creative Commons Attri- bution 4.0 International License, which permits use, sharing, adapta- tion, distribution and reproduction in any medium or format, as long as you give appropriate credit to the original author(s) and the source, provide a link to the Creative Commons licence, and indicate if changes were made. The images or other third party material in this article are included in the article’s Creative Commons licence, unless indicated otherwise in a credit line to the material. If material is not included in the article’s Creative Commons licence and your intended use is not permitted by statutory regulation or exceeds the permitted use, you will
need to obtain permission directly from the copyright holder. To view a copy of this licence, visit http://creat iveco mmons .org/licen ses/by/4.0/.
References
1. Masuda H, Ebata A, Teramae K. Alteration of thermal conductiv- ity and viscosity of liquid by dispersing ultra fine particles. Netsu Bussei. 1993;7:227–33.
2. Choi SUS, Eastman JA. Enhancing thermal conductivity of fluids with nanoparticles. ASME Int Mech Eng Congr Expo.
1995;66:99–105. https ://doi.org/10.1115/1.15320 08.
3. Yogeswaran M, Kadirgama K, Rahman MM, Devarajan R. Tem- perature analysis when using ethylene-glycol-based TiO2 as a new coolant for milling. Int J Automot Mech Eng. ISSN 2272–81;
https ://doi.org/10.15282 /ijame .11.2015.10.0191.
4. Bhanvase BA, Sarode MR, Putterwar LA, Abdullah KA, Deo- sarkar MP, Sonawane SH. Intensification of convective heat trans- fer in water/ethylene glycol based nanofluids containing TiO2 nanoparticles. Chem Eng Process Process Intensif. 2014;82:123–
31. https ://doi.org/10.1016/j.cep.2014.06.009.
5. Mehrali M, Sadeghinezhad E, Akhiani AR, Tahan Latibari S, Talebian S, Dolatshahi-Pirouz A, Metselaar HSC, Mehrali M. An ecofriendly graphene-based nanofluid for heat transfer applica- tions. J Clean Prod. 2016;137:555–66. https ://doi.org/10.1016/j.
jclep ro.2016.07.136.
6. Baby TT, Ramaprabhu S. Synthesis and nanofluid applica- tion of silver nanoparticles decorated graphene. J Mater Chem.
2011;21:9702–9. https ://doi.org/10.1039/c0jm0 4106h .
7. Ul Haq R, Khan ZH, Khan WA. Thermophysical effects of car- bon nanotubes on MHD flow over a stretching surface. Phys E Low Dimens Syst Nanostruct. 2014;63:215–22. https ://doi.
org/10.1016/j.physe .2014.06.004.
8. Ul Haq R, Nadeem S, Khan ZH, Noor NFM. Convective heat transfer in MHD slip flow over a stretching surface in the presence of carbon nanotubes. Phys B Condens Matter. 2015;457:40–7.
https ://doi.org/10.1016/j.physb .2014.09.031.
9. Warrier P, Yuan Y, Beck MP, Teja AS. Heat transfer in nanoparti- cle suspensions: modeling the thermal conductivity of nanofluids.
AIChE J. 2010;56:3243–56. https ://doi.org/10.1002/aic.12228 . 10. Sarkar J, Ghosh P, Adil A. A review on hybrid nanofluids: recent
research, development and applications. Renew Sustain Energy Rev. 2015;43:164–77. https ://doi.org/10.1016/j.rser.2014.11.023.
11. Sundar LS, Sharma KV, Singh MK, Sousa ACM. Hybrid nano- fluids preparation, thermal properties, heat transfer and friction factor—a review. Renew Sustain Energy Rev. 2017;68:185–98.
https ://doi.org/10.1016/j.rser.2016.09.108.
12. Theres Baby T, Sundara R. Surfactant free magnetic nano- fluids based on core-shell type nanoparticle decorated mul- tiwalled carbon nanotubes. J Appl Phys. 2011. https ://doi.
org/10.1063/1.36429 74.
13. Batmunkh M, Tanshen MR, Nine MJ, Myekhlai M, Choi H, Chung H, Jeong H. Thermal conductivity of TiO2 nanoparticles based aqueous nanofluids with an addition of a modified sil- ver particle. Ind Eng Chem Res. 2014;53:8445–51. https ://doi.
org/10.1021/ie403 712f.
14. Madhesh D, Parameshwaran R, Kalaiselvam S. Experimental investigation on convective heat transfer and rheological char- acteristics of Cu-TiO2 hybrid nanofluids. Exp Therm Fluid Sci. 2014;52:104–15. https ://doi.org/10.1016/j.expth ermfl usci.2013.08.026.
15. Li H, Ha C-S, Kim I. Fabrication of carbon nanotube/SiO2 and carbon nanotube/SiO2/Ag nanoparticles hybrids by using plasma treatment. Nanoscale Res Lett. 2009;4:1384–8. https ://
doi.org/10.1007/s1167 1-009-9409-4.
16. Aravind SSJ, Ramaprabhu S. Graphene-multiwalled carbon nano- tube-based nanofluids for improved heat dissipation. RSC Adv.
2013;3:4199–206. https ://doi.org/10.1039/c3ra2 2653k .
17. Le Ba T, Mahian O, Wongwises S, Szilágyi IM. Review on the recent progress in the preparation and stability of graphene-based nanofluids. J Therm Anal Calorim. 2020. https ://doi.org/10.1007/
s1097 3-020-09365 -9.
18. Nabil MF, Azmi WH, Hamid KA, Zawawi NNM, Priyandoko G, Mamat R. Thermo-physical properties of hybrid nanofluids and hybrid nanolubricants: a comprehensive review on perfor- mance. Int Commun Heat Mass Transf. 2017;83:30–9. https ://
doi.org/10.1016/j.ichea tmass trans fer.2017.03.008.
19. Ganvir RB, Walke PV, Kriplani VM. Heat transfer charac- teristics in nanofluid—a review. Renew Sustain Energy Rev.
2017;75:451–60. https ://doi.org/10.1016/j.rser.2016.11.010.
20. Han ZH, Yang B, Kim SH, Zachariah MR. Application of hybrid sphere/carbon nanotube particles in nanofluids. Nanotechnol- ogy. 2007. https ://doi.org/10.1088/0957-4484/18/10/10570 1.
21. Suresh S, Venkitaraj KP, Selvakumar P, Chandrasekar M.
Synthesis of Al2O3-Cu/water hybrid nanofluids using two step method and its thermo physical properties. Colloids Surf A Physicochem Eng Asp. 2011;388:41–8. https ://doi.
org/10.1016/j.colsu rfa.2011.08.005.
22. Madhesh D, Kalaiselvam S. Experimental analysis of hybrid nanofluid as a coolant. In: Procedia engineering, vol. 97. Else- vier Ltd.; 2014, pp 1667–75. https ://doi.org/10.1016/j.proen g.2014.12.317.
23. Hemmat Esfe M, Abbasian Arani AA, Rezaie M, Yan WM, Kari- mipour A. Experimental determination of thermal conductiv- ity and dynamic viscosity of Ag-MgO/water hybrid nanofluid.
Int Commun Heat Mass Transf. 2015;66:189–95. https ://doi.
org/10.1016/j.ichea tmass trans fer.2015.06.003.
24. Soltani O, Akbari M. Effects of temperature and particles con- centration on the dynamic viscosity of MgO-MWCNT/ethylene glycol hybrid nanofluid: experimental study. Phys E Low Dimens Syst Nanostruct. 2016;84:564–70. https ://doi.org/10.1016/j.physe .2016.06.015.
25. Afrand M, Toghraie D, Ruhani B. Effects of temperature and nanopar- ticles concentration on rheological behavior of Fe3O4-Ag/EG hybrid nanofluid: an experimental study. Exp Therm Fluid Sci. 2016;77:38–
44. https ://doi.org/10.1016/j.expth ermfl usci.2016.04.007.
26. Asadi A, Asadi M, Rezaei M, Siahmargoi M, Asadi F. The effect of temperature and solid concentration on dynamic viscosity of MWCNT/MgO (20–80)–SAE50 hybrid nano-lubricant and pro- posing a new correlation: an experimental study. Int Commun Heat Mass Transf. 2016;78:48–53. https ://doi.org/10.1016/j.ichea tmass trans fer.2016.08.021.
27. Minea AA. Hybrid nanofluids based on Al2O3, TiO2 and SiO2:
numerical evaluation of different approaches. Int J Heat Mass Transf. 2017;104:852–60. https ://doi.org/10.1016/j.ijhea tmass trans fer.2016.09.012.
28. Bahrami M, Akbari M, Karimipour A, Afrand M. An experimental study on rheological behavior of hybrid nanofluids made of iron and copper oxide in a binary mixture of water and ethylene glycol:
non-Newtonian behavior. Exp Therm Fluid Sci. 2016;79:231–7.
https ://doi.org/10.1016/j.expth ermfl usci.2016.07.015.
29. Sundar LS, Farooky MH, Sarada SN, Singh MK. Experimen- tal thermal conductivity of ethylene glycol and water mixture based low volume concentration of Al2O3 and CuO nanoflu- ids. Int Commun Heat Mass Transf. 2013;41:41–6. https ://doi.
org/10.1016/j.ichea tmass trans fer.2012.11.004.
30. Zakaria I, Azmi WH, Mohamed WANW, Mamat R, Najafi G.
Experimental investigation of thermal conductivity and electri- cal conductivity of Al2O3 nanofluid in water—ethylene glycol mixture for proton exchange membrane fuel cell application.
Int Commun Heat Mass Transf. 2015;61:61–8. https ://doi.
org/10.1016/j.ichea tmass trans fer.2014.12.015.
31. Javadi FS, Sadeghipour S, Saidur R, BoroumandJazi G, Rahmati B, Elias MM, Sohel MR. The effects of nanofluid on thermo- physical properties and heat transfer characteristics of a plate heat exchanger. Int Commun Heat Mass Transf. 2013;44:58–63. https ://doi.org/10.1016/j.ichea tmass trans fer.2013.03.017.
32. Paul G, Philip J, Raj B, Das PK, Manna I. Synthesis, characteriza- tion, and thermal property measurement of nano-Al95Zn05 dis- persed nanofluid prepared by a two-step process. Int J Heat Mass Transf. 2011;54:3783–8. https ://doi.org/10.1016/j.ijhea tmass trans fer.2011.02.044.
33. Azmi WH, Sharma KV, Sarma PK, Mamat R, Najafi G. Heat transfer and friction factor of water based TiO2 and SiO2 nanofluids under turbulent flow in a tube. Int Commun Heat Mass Transf. 2014;59:30–
8. https ://doi.org/10.1016/j.ichea tmass trans fer.2014.10.007.
34. Garg J, Poudel B, Chiesa M, Gordon JB, Ma JJ, Wang JB, Ren ZF, Kang YT, Ohtani H, Nanda J, McKinley GH, Chen G. Enhanced thermal conductivity and viscosity of copper nanoparticles in eth- ylene glycol nanofluid. J Appl Phys. 2008;103:074301. https ://doi.
org/10.1063/1.29024 83.
35. Nabil MF, Azmi WH, Hamid KA, Mamat R. Experimental inves- tigation of heat transfer and friction factor of TiO2-SiO2 nano- fluids in water:ethylene glycol mixture. Int J Heat Mass Transf.
2018;124:1361–9. https ://doi.org/10.1016/j.ijhea tmass trans fer.2018.04.143.
36. Agresti F, Barison S, Bobbo S, Colla L, Fedele L, Pagura C, Scat- tolini M. Thermal conductivity and viscosity measurements of water-based silica nanofluids. NSTI Nanotech. 2011;2:478–81.
37. Turgut A, Tavman I, Chirtoc M, Schuchmann HP, Sauter C, Tav- man S. Thermal conductivity and viscosity measurements of water-based TiO 2 nanofluids. Int J Thermophys. 2009;30:1213–
26. https ://doi.org/10.1007/s1076 5-009-0594-2.
38. Nabil MF, Azmi WH, Abdul Hamid K, Mamat R, Hagos FY.
An experimental study on the thermal conductivity and dynamic viscosity of TiO2-SiO2 nanofluids in water: ethylene glycol mix- ture. Int Commun Heat Mass Transf. 2017;86:181–9. https ://doi.
org/10.1016/j.ichea tmass trans fer.2017.05.024.
39. Hamid KA, Azmi WH, Nabil MF, Mamat R. Experimental inves- tigation of nanoparticle mixture ratios on TiO2–SiO2 nanofluids heat transfer performance under turbulent flow. Int J Heat Mass Transf. 2018;118:617–27. https ://doi.org/10.1016/j.ijhea tmass trans fer.2017.11.036.
40. Hamid KA, Azmi WH, Nabil MF, Mamat R, Sharma KV. Experi- mental investigation of thermal conductivity and dynamic viscos- ity on nanoparticle mixture ratios of TiO2-SiO2 nanofluids. Int J Heat Mass Transf. 2018;116:1143–52. https ://doi.org/10.1016/j.
ijhea tmass trans fer.2017.09.087.
41. Evans W, Prasher R, Fish J, Meakin P, Phelan P, Keblinski P.
Effect of aggregation and interfacial thermal resistance on thermal conductivity of nanocomposites and colloidal nanofluids. Int J Heat Mass Transf. 2008;51:1431–8. https ://doi.org/10.1016/j.ijhea tmass trans fer.2007.10.017.
42. Xuan Y, Li Q, Hu W. Aggregation structure and thermal con- ductivity of nanofluids. AIChE J. 2003;49:1038–43. https ://doi.
org/10.1002/aic.69049 0420.
43. Keblinski P, Eastman JA, Cahill DG. Nanofluids for thermal trans- port. Mater Today. 2005;8:36–44. https ://doi.org/10.1016/S1369 -7021(05)70936 -6.
44. Sigma-Aldrich. www.sigma aldri ch.com.
45. ASHRAE. ASHRAE handbook 2001 fundamentals, vol. 53; 2001.
https ://doi.org/10.1017/cbo97 81107 41532 4.004.
46. Esfahani MR, Stretz HA, Wells MJM. Abiotic reversible self- assembly of fulvic and humic acid aggregates in low electro- lytic conductivity solutions by dynamic light scattering and zeta
potential investigation. Sci Total Environ. 2015;537:81–92. https ://doi.org/10.1016/j.scito tenv.2015.08.001.
47. Zamani L, Zomorodian K, Bi Fatemeh Mirjalili B, Khabnadi- deh S. One pot preparations 1-amidoalkyl-2-naphthols deriva- tive catalyzed by nano-TiCl4.SiO2 with antimicrobial studies of some products. J Pharm Sci Innov. 2014;3:208–16. https ://doi.
org/10.7897/2277-4572.03314 1.
48. Theivasanthi T, Alagar M. Titanium dioxide (TiO2) nanoparticles- XRD analyses—an insight. arXiv preprint 2013. arXiv :1307.1091 49. Thangavelu K, Annamalai R, Arulnandhi D. Preparation and char- acterization of nanosized TiO2 powder by sol-gel precipitation route. Int J Emerg Technol Adv Eng. 2013;3:636–9.
50. Yu W, Xie H. A review on nanofluids: preparation, stability mechanisms, and applications. J Nanomater. 2011. https ://doi.
org/10.1155/2012/43587 3.
51. Le Ba T, Mahian O, Wongwises S, Szilágyi IM. Review on the recent progress in the preparation and stability of graphene-based nanofluids. J Therm Anal Calorim. 2020. https ://doi.org/10.1007/
s1097 3-020-09365 -9.
52. Nguyen CT, Desgranges F, Roy G, Galanis N, Maré T, Boucher S, Angue Mintsa H. Temperature and particle-size dependent viscos- ity data for water-based nanofluids—hysteresis phenomenon. Int J Heat Fluid Flow. 2007;28:1492–506. https ://doi.org/10.1016/j.
ijhea tflui dflow .2007.02.004.
53. Chen H, Ding Y. Heat transfer and rheological behaviour of nano- fluids—a review. Berlin: Springer; 2009. p. 135–77. https ://doi.
org/10.1007/978-3-642-02690 -4_3.
54. Mehrali M, Sadeghinezhad E, Latibari S, Kazi S, Mehrali M, Zubir MNBM, Metselaar HS. Investigation of thermal conduc- tivity and rheological properties of nanofluids containing gra- phene nanoplatelets. Nanoscale Res Lett. 2014;9:15. https ://doi.
org/10.1186/1556-276x-9-15.
55. Jang SP, Choi SUS. Role of Brownian motion in the enhanced thermal conductivity of nanofluids. Appl Phys Lett.
2004;84:4316–8. https ://doi.org/10.1063/1.17566 84.
Publisher’s Note Springer Nature remains neutral with regard to jurisdictional claims in published maps and institutional affiliations.
![Table 1 Properties of P25 and SiO 2 nanoparticles [44]](https://thumb-eu.123doks.com/thumbv2/9dokorg/759770.32908/3.892.459.817.106.290/table-properties-p-sio-nanoparticles.webp)
![Figure 1 shows the XRD pattern of SiO 2 and P25. For the XRD pattern of SiO 2 (Fig. 1a), the amorphous nature of the used nano-SiO 2 could be seen from the diffractogram [47]](https://thumb-eu.123doks.com/thumbv2/9dokorg/759770.32908/4.892.86.815.474.775/figure-shows-xrd-pattern-pattern-amorphous-nature-diffractogram.webp)