C E R A M I C S
Network structure and thermal properties of bioactive (SiO 2 –CaO–Na 2 O–P 2 O 5 ) glasses
M. Fa´bia´n1,2,* , Zs. Kova´cs3 , J. L. La´ba´r1 , A. Sulyok1 , Z. E. Horva´th1 , I. Sze´ka´cs1 , and V. Kova´cs Kis1,4,*
1Centre for Energy Research, P.O.B. 49, Budapest 1525, Hungary
2Wigner Research Centre for Physics, P.O.B. 49, Budapest 1525, Hungary
3Institute of Physics, Eötvös Loránd University, Pázmány Péter sétány 1/c, Budapest 1117, Hungary
4Institute of Environmental Sciences, University of Pannonia, Egyetem u. 10, Veszprém 8200, Hungary
Received:2 October 2019 Accepted:7 November 2019
Ó
The Author(s) 2019ABSTRACT
Ca- and P-based bioactive glasses are excellent candidates for design and manufacture of biomaterials. Understanding the structure and physico-chemi- cal–thermal behaviour of bioactive glasses is a fundamental step towards the design of a new generation of biocompatible materials. In this study, the structure of SiO2–CaO–Na2O glasses and its derivatives, obtained by substi- tuting Na2O with P2O5 and prepared by melt–quench technique, was studied with neutron and electron diffraction techniques combined with thermal anal- ysis, high-resolution electron microscopy and X-ray photoelectron spectroscopy.
Neutron and electron diffraction data were analysed with reverse Monte Carlo simulation and pair distribution function analysis, respectively. Bioactivity of P2O5substituted glasses was also investigated and proven in vitro using sim- ulated body fluid. Based on the structural analysis, it was found that Si and P atoms are in well-defined tetrahedral units with a bond distance of 1.60 A˚ for both Si–O and P–O bonds, although P exhibits a higher average coordination number than Si. With increasing phosphate content, tendentious changes in the glass behaviour were observed. Linear increase inTg, supported by the changes in the average coordination numbers of Si and P, indicates strengthening of network structure with increasing P content and formation of P–O–Ca atomic linkages, which lead to Ca–P-rich atomic environments in the silicate network.
These Ca–P-rich environments trap volatile elements and thus decrease the total weight loss during heating at higher P concentrations. In the case of the highest investigated P2O5content (5 mol%), nanoscale structural inhomogeneity and the formation of Ca–P-rich clusters were also revealed by electron diffraction and atomic resolution imaging. This type of Ca–(Na)–P clustering has a key role in the behaviour of phosphate-substituted silicate glasses under physiological conditions.
Address correspondence toE-mail: fabian.margit@energia.mta.hu; kis.viktoria@energia.mta.hu https://doi.org/10.1007/s10853-019-04206-z
Ceramics
Introduction
Bioactive glasses are mostly silicate-based glasses which, besides exhibiting biocompatibility, are able to bond actively to host living tissue [1]. Their main practical advantages with respect to other bioactive or biocompatible materials like ceramics, bulk metallic glasses or other metallic materials are based on their metastable amorphous structure, which induces high reactivity under physiological condi- tions. At the same time, their composition, in contrast to metal-based implant materials, allows biomedical applications without additional coating.
Besides silicates, several glassy compositions based on B2O3 or P2O5 have been found suitable for dif- ferent kinds of biomedical applications [2, 3]. Each compositional series has its advantage: the SiO2- based group comprises a wide range of glass for- mulations, the B2O3-based glasses are characterized by higher reactivity than silicate materials, which leads to faster bioactive kinetics, and P2O5-based systems are better resorbable materials under physi- ological conditions, and their dissolution rate can be tuned by changing their compositions [4]. Various concentrations of other oxides can be incorporated in the basic glass composition to enhance particular properties of the glassy material, like the CaO and Na2O are useful to adjust the surface reactivity in biological environments.
However, common disadvantages of all composi- tions, namely poor load bearing performance and manufacturing difficulties, impede their widespread application in clinics. One way to overcome these disadvantages is the synthesis of glass–ceramics nanocomposite materials from bioactive glass as a starting material either by heat treatment or melt–
quench technique [5]. As both bioactivity and the high temperature behaviour of glasses depend on composition and structure, the structure of bioactive glasses has been intensively investigated.
It has been established that bioactive silicate glas- ses are characterized by a network structure of SiO4
polyhedra with some orthophosphate (PO4) substi- tution [6]. Subsequently, molecular dynamics simu- lations [7] suggested that the distribution of the network modifier cation Ca2? might not be homo- geneous in the random network structure but has a strong affinity to the orthophosphates. Combined neutron and X-ray diffraction study of commercial
BioglassÒ provided experimental evidence for the non-uniform distribution of Ca2? in the network structure [8]. At the same time, nuclear magnetic resonance spectroscopy proved the existence of phosphate clusters up to six PO4 tetrahedra units [9,10]. These results indicate that local fluctuations in the atomic structure and composition comprise an inherent property of bioactive silicate glasses that has to be considered when thermal and mechanical properties or bioactive behaviour is explained.
This integrated bulk-to-nanoscale study is moti- vated by a better understanding of the connection between the nanostructure and thermal behaviour of bioactive silicate glasses. To achieve this goal, we measure and model the average network structure of a bioactive glass series in the compositional range of SiO2(45)CaO(25)Na2O(30-x)P2O5(x), where x = 0,1,3,5, using neutron diffraction and reverse Monte Carlo simulations, and then study the nanos- cale inhomogeneities by transmission electron microscopy methods and X-ray photoelectron spec- troscopy. In parallel, thermal characterization is car- ried out as a function of composition. Finally, merging bulk and nanoscale structural data, inter- pretation of thermal behaviour is presented.
The requirements for synthetic bone substitute materials summarize the influence of the respective material towards the biocompatibility and bioactivity [11]. In the present work, the biological properties of studied materials were evaluated using in vitro settings.
Experimental details
Sample preparationGlassy samples were prepared by melt–quench technique, melted under atmospheric conditions, at temperatures between 1100 and 1250 °C in Pt cru- cibles. The melted mixture has been kept at the melting temperature for 2 h, during which the melt was periodically homogenized by mechanical stir- ring. The melt was quenched by pouring it on a stainless steel plate. The nominal compositions of the investigated glassy specimens are summarized in Table 1. The raw materials used were all of p.a.
grade, SiO2, P2O5are the basic glass-forming oxides, while Na2O and CaO both serve as network modifiers.
Neutron diffraction experiments
Neutron diffraction (ND) measurements were per- formed in a broad momentum transfer range, com- bining the data measured by the 2-axis PSD monochromatic neutron diffractometer (k0= 1.069 A˚ ; Q= 0.45–9.8 A˚-1) [12] at the 10 MW Budapest research reactor and by the 7C2 diffractometer at the LLB, Saclay (k0= 0.726 A˚ ;Q= 0.52–19 A˚-1) [13]. The powder specimens of about 3–5 g/each were filled in cylindrical V-sample holders of 8 and 6 mm diameter for the two experiments, respectively. The structure factors, S(Q)s, were evaluated from the raw experi- mental data, using the programme packages avail- able at the two facilities. As the statistics of the data is better for the PSD diffractometer at relatively low Q values (below*4 A˚-1) and the statistics of 7C2 diffractometer data is much better above 8 A˚-1, the S(Q) data were combined by normalizing the data of the PSD diffractometer to that of the 7C2 diffrac- tometer in the 4–8 A˚-1 range by least squares method. The agreement of the corresponding S(Q) values was within 1% in the overlapping Q- range. The combined values of the two spectra were used for further data treatment. (i.e. for Q\4 A˚-1 only the PSD data and for Q[8 A˚-1 only the 7C2 data were used.)
Electron microscopy and electron diffraction
For high-resolution transmission electron microscopy (HRTEM) and electron diffraction (ED), the sample was gently crushed under ethanol in an agate mortar, and a drop of the resulting suspension was deposited onto a lacey carbon-covered Cu grid (Ted Pella).
HRTEM was carried out using a JEOL 3010 at 300 keV (LaB6 cathode, 0.17 nm point-to-point reso- lution, UHR pole piece) equipped with GIF. Electron diffraction measurements were carried out in
nanobeam ED mode using a Philips CM20 (operating at 200 keV) and a JEOL 3010 (operating at 300 keV) TEMs, both with LaB6cathode. The diameter of the analysed area was 1.5lm and 25 nm for CM20 and JEOL 3010 microscopes, respectively. The applied camera length was 500 mm. Special care was taken to avoid background in nanobeam ED, by selecting appropriate areas for diffraction. The scattered intensity was recorded using Ditabis Imaging Plates (17.5lm pixel size) and Gatan Orius CCD (7.4lm pixel size) for CM20 and JEOL3010 microscopes, respectively. The use of Imaging Plates allows to record linear response to the electron dose over six orders of magnitude, which is ideal for measuring scattered intensity by amorphous structures. In the case of CCD, the dynamic range was extended by merging together diffraction patterns taken with different exposure times using the Digital Micro- graph script written by Bernhard Schaffer (Gatan).
The diffraction measurement procedure was based on the protocol summarized for selected area ED mode [14], which ensured reproducibility of camera length within 0.5%. Camera length was calibrated for the applied lens currents using a self-supporting random nanocrystalline Al thin film.
Thermal characterization
DTA measurements were performed using a SETARAM 92-16.18 DTA equipment with a TGA-92 set-up under Ar atmosphere. The DTA was cali- brated by melting of high-purity In, Zn and Al met- als, and each DTA scan consisted of a controlled heating with 10°C/min constant heating rate and a subsequent instantaneous uncontrolled cooling of the sample (with an approximate initial cooling rate of [50°C/min).
XRD
X-ray diffraction (XRD) measurements were per- formed using a Bruker AXS D8 Discover diffrac- tometer equipped with Go¨bel mirror and a scintillation detector with Cu Karadiation. The X-ray beam dimensions were 1 mm * 5 mm, the 2h step size was 0.02°, and the scan speed 0.1°/min. We used the Diffrac.EVA program and the ICDD PDF data- base for phase identification.
Table 1 Nominal composition in mole% of the studied glass samples
SiO2 CaO Na2O P2O5
S45P0 45 25 30 0
S45P1 45 25 29 1
S42P3 45 25 27 3
S45P5 45 25 25 5
XPS
Approximately 1-cm-sized specimens were selected for XPS analysis under ultrahigh vacuum conditions (2 * 10-9mbar). The specimens were exposed to 70°C heat treatment for 48 h, which is the standard baking procedure of the applied vacuum system. The photo- electron spectra were obtained using X-ray radiation (Al anode with water cooling, 15 keV excitation). Constant energy resolution of 1.5 eV was provided by a special cylindrical mirror analyser with a retarding field (type DESA 150, Staib Instruments Ltd.). All spectra were recorded with 0.1 eV energy steps. The XPS measure- ment yielded information on the average surface com- position of an area of ca. 5 mm diameter. Detected lines:
O 1s(532 eV); Ca 2p(347 eV); C 1s(285 eV); Na Auger (497 eV); P 2s(189 eV); Si 2p(100 eV). Low concentration elements such as P were recorded with longer detection time to improve the statistics and hence the reliability of the quantification. Spectra were evaluated by applying the usual Shirley background subtraction, and compo- sitions were calculated from peak areas assuming homogeneous model. Sensitivity factors were calculated from the reference area in Ref. [15]. Concentration versus depth curves (called depth profiles) were recorded by alternating ion sputtering (1 keV Ar ion beam) and XPS measurement.
Bioactivity tests
To test the bioactivity of the bulk glasses, samples were incubated in simulated body fluid (SBF) for 30 min, 3 h, 3 days, 7 days and 21 days at 37°C and p(CO2) = 0.05 atm (5%) as human serum is in equi- librium with such a partial pressure [16]. The SBF and the validation of the apatite-forming ability were done according to the procedure of Kokubo and Takadama [17]. After soaking, the samples were removed from the SBF, gently washed with deionized water and dried at room temperature. The surface morphology of the dried samples was explored using a LEO 1540XB scanning electron microscope (SEM).
Structural modelling
Structure factor calculation based on neutron diffraction
Neutron diffraction data were used to deduce aver- age structural information on the different bioactive
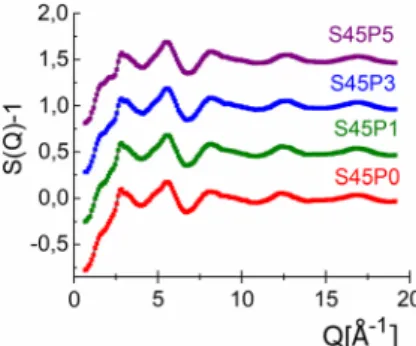
glasses. The total structure factors, S(Q), were obtained from the ND experiments with a good sig- nal-to-noise ratio up to Qmax = 19 A˚-1. The diffrac- tion experiments performed up to high Q values were important to obtain fine r-space resolution for the atomic distribution function analyses. Figure1 shows the experimental ND S(Q) data of the inves- tigated samples. For the first sight, the experimental ND curves seem to be similar and only slight differ- ences can be observed in the region of the low Qvalues near the first visible peak at 1.5–2.2 A˚-1.
The visible differences in the shape of the ND spectra are mainly due to the different values of the weighting factors,wij, of the partial structure factors, Sij(Q), defined as:
S Qð Þ ¼Xk
i;j
wijSijð ÞQ ð1Þ
wijND¼ cicjbibj Pk
i;jcibj
h i2 ð2Þ
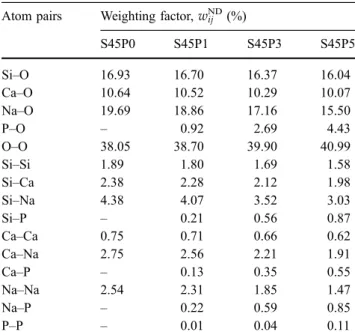
whereci,cjare the molar fractions of the components, bi,bjthe coherent neutron scattering amplitudes, and kthe number of elements in the sample. The neutron scattering amplitude of an element is constant in the entireQ-range [18]. Table 2shows the corresponding weighting factors for the atomic pairs, wij. It can be seen that the Si–O, Ca–O, Na–O and O–O atom pairs have significant contributions in the ND experiment.
Reverse Monte Carlo modelling
The experimental structure factors, S(Q), data have been simulated by the reverse Monte Carlo (RMC) method using the software package RMC?? [19].
Figure 1 Total structure factors (dotted line) together with RMC fits (solid line) for S45 series of samples: S45P0 (red), S45P1 (green), S45P3 (blue) and S45P5 (purple). The curves are shifted vertically for clarity.
RMC minimizes the squared difference between the experimentalS(Q) and the calculated one from a 3D atomic configuration. The RMC algorithm calculates the one-dimensional partial atomic pair correlation functions gij(r), and they are inverse-Fourier-trans- formed to calculate the partial structure factors, Sij(Q):
Sijð Þ ¼Q 1þ4pq0 Q
Z rmax
0
r g ijð Þ r 1
sinQrdr ð3Þ
where rmax is the half edge-length of the simulation box of the RMC calculation. The actual computer configuration is modified by moving the atoms ran- domly until the calculated S(Q) agrees with the experimental data within the experimental error.
Moves are only accepted if they are in accordance with certain constraints.
For the starting RMC model, a disordered atomic configuration was built up with a simulation box containing 10.000 atoms with density data 0.076, 0.0752, 0.0741 and 0.0714 atoms/A˚-3 and rmax-
= 26.39, 26.52, 26.65 and 26.93 A˚ for the S45P0, S45P1, S45P3 and S45P5 glasses, respectively. In the RMC simulation procedure, two types of constraints were used, for the minimum interatomic distances between atom pairs (cut-off distances) to avoid unreasonable atom contacts and coordination con- straints. For the starting configuration, we have used
the results based on the literature and our previous results for binary SiO2–Na2O [20] and CaO–P2O5[21]
glasses. We apply two types, a positive and a nega- tive coordination constraint for the network former Si atoms. Based on the literature and our previous results [22–24], it is reasonable to suppose that silicon has a fourfold oxygen coordination as a positive constraint, and the lack of onefold and/or twofold oxygen coordination as negative constraints.
Structure factor calculation based on electron diffraction
Electron diffraction-based structural analysis was carried out parallel to the ND-based RMC simula- tions to obtain localized information on the glassy structure. As structural inhomogeneities are related to phosphate content [8–10], we focused these experiments for the S45P5 sample. Table 3compares ND and ED weighting factors of the X-O (X: Si, Ca, Na, P, O) interatomic correlations for the S45P5 composition. In the case of electron scattering, a simple approach was used and the angular depen- dence of the scattering factor was neglected. Similar simplification was previously applied in the litera- ture for X-ray scattering [25]. In Table3, the ED weighting factors for zero scattering angle are listed.
As it can be seen, cation-O contributions in the ED measurement are quite similar to those in ND mea- surement, implying that the reliability of these cor- relations and the derived first-neighbour distances will be similar as well. As the ED-based quantitative structural analysis of amorphous solids (e.g. the cal- culation of the partial correlation functions) has not yet been fully established in the literature, this statement supports the expectation that ED Table 2 ND weighting factors of the partial interatomic
correlations in the glasses
Atom pairs Weighting factor,wijND(%)
S45P0 S45P1 S45P3 S45P5
Si–O 16.93 16.70 16.37 16.04
Ca–O 10.64 10.52 10.29 10.07
Na–O 19.69 18.86 17.16 15.50
P–O – 0.92 2.69 4.43
O–O 38.05 38.70 39.90 40.99
Si–Si 1.89 1.80 1.69 1.58
Si–Ca 2.38 2.28 2.12 1.98
Si–Na 4.38 4.07 3.52 3.03
Si–P – 0.21 0.56 0.87
Ca–Ca 0.75 0.71 0.66 0.62
Ca–Na 2.75 2.56 2.21 1.91
Ca–P – 0.13 0.35 0.55
Na–Na 2.54 2.31 1.85 1.47
Na–P – 0.22 0.59 0.85
P–P – 0.01 0.04 0.11
Table 3 Comparison of the isotropic ND weighting factors wij
NDand the angle-dependent ED weighting factors for zero scattering anglewijED
for the S45P5 composition
S45P5 wijND
(%) wijED
(%)
Si–O 16 13.5
O–O 41 8.4
Ca–O 10 12.7
Na–O 15.5 12.2
P–O 4.5 2.8
The atomic scattering factors for electrons are for neutral atoms and based on the formula given by Peng et al.
[26]
measurements on small volumes of bioactive glasses provide reliable structural data.
From Table3, it is also seen that, while during ND experiment almost all of the overall scattering (ca.
90%) is from O–O and cation-O contribution, in the case of electron scattering this contribution comprises only 50% of the overall scattering, implying a sig- nificant cation–cation (mostly Si–Si) contribution for this composition, which carries structural informa- tion on the medium-range order (MRO).
ED patterns were acquired from different sample volumes in the S45P5 glass using 200 keV and 300 keV electrons and analysed subsequently with the Process Diffraction software [27]. Reduced inter- ference functions were derived from ED measure- ments and compared to that calculated from ND experiments as shown in Fig.2. The position of the first sharp diffraction peak at 2.2 A˚-1 coincides, however, in the interference function of the 300 keV electron diffraction measurement; additional peaks appear as marked by arrows. At first glance, the 200 keV measurements appear to be better resolved at high Qvalues than the 300 keV one. This can be explained with the different experimental set-up: (1) during the 300 keV measurement, scattered intensity is gathered from a 25-nm-diameter area, while in the case of 200 keV the analysed volume is 60 times
larger (supposing the same sample thickness), which implies significant improvement in signal-to-noise ratio; and (2) in the case of 200 keV measurement the detection efficiency due to the application of Imaging Plates was higher [28].
Results and discussion
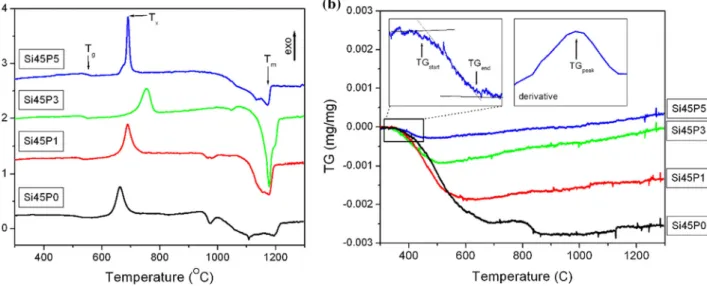
Thermal stabilityThermal analysis of the studied bioactive glasses was performed in linear heating experiments. Figure3a shows the thermal signals exhibiting a glass transi- tion and a single exothermic devitrification event followed by a multiple-stage melting for all the dif- ferent glass compositions. Figure 3b indicates the weight loss curves measured during the same linear heating DTA scans. Characteristic temperatures of the different thermal processes, such as glass transi- tion temperature (Tg), the peak temperature of the exothermic devitrification event (Tx), the melting temperature (Tm) and the peak temperature of the weight loss rate (TG peak), have been determined and are summarized in Table4.
Fused silica glass crystallizes at high temperatures and has a Tg at about 1200°C due to their high- strength SiO4 tetrahedron network [29]. It is well known that already trace amount of alkali elements, especially Na, reduces effectively the crystallization temperature of silica glass by breaking the network and promoting the rearrangement of the SiO4tetra- hedra [30]. Therefore, it is not surprising that theTg
and Tx temperatures are substantially lower for the Ca- and Na-containing S45P0 sample than for fused silica. P is also a network-forming component, and the addition of low concentrations of phosphate to the glass induces a gradual increase inTgandTx. This is visible in Fig.4, where with increasing phosphate content the glass transition temperature shifts to higher values from 516°C for S45P0 composition to 550 °C for S45P5 composition [31]. This trend fits well with a linear function with 7C/at% slope, which implies that the glass transition temperature is directly related to the amount of PO4 tetrahedra in the network structure. Similarly, linear relationship was found between the Tg and the composition of miscible blends of phosphate glasses [32]. Above the glass transition temperature, the rigid structure of the glass transits into the viscous supercooled liquid state Figure 2 Reduced interference functions from electron and
neutron diffraction measurements. The position of the first sharp diffraction peaks (dashed line) coincides independently from the scattering experiment. Extra peaks on the 300 keV electron diffraction measurements with respect to the 200 keV experiment are indicated by arrows.
in which thermal atomic movements can gradually transform it into the equilibrium crystalline state.
As shown in Fig. 4a, structural strengthening due to the PO4content increases also the stability of the supercooled liquid state, so that Txis also increased gradually with the PO4 content up to 3 mol% of phosphate concentration. However, SiO2 and P2O5
have a large miscibility gap in crystalline state and, according to the phase diagram [33], at low Figure 3 Thermal analysis of the glasses with the aartificially
displaced thermal signals showing the glass transition (Tg), the exothermic devitrification event (Tx) and melting (Tm) andbthe weight loss curves shifted to a common origin at 300°C. The
insets show the magnified TG(T) curve of the Si45P5 sample with the TGstartand TGendtemperatures and the corresponding derived smoothed weight loss rate curve with the TGpeaktemperature.
Table 4 Characteristic temperatures of the thermally activated processes for the different bioactive glass compositions
Sample Tg(°C) Tx(°C) Tm(°C) TG peak (°C)
S45P0 516 662 1215 503
S45P1 527 689 1192 467
S45P3 540 754 1209 418
S45P5 550 690 1183 410
Figure 4 aThe different characteristic temperatures as a function of the P concentration of the bioglass samples, whereTg is the inflection point of the glass transition temperature andTxis the peak temperature of the exotherm crystallization event.TTG start,
TTG peakandTTG endare the start, peak and end temperatures of the weight loss process, respectively.bThe weight loss as a function of the P concentration of the bioglass samples.
temperature only eutectic forms and practically no miscibility exists. At higher temperature, above cc.
1000°C, in the liquid state phosphate is miscible in liquid silica. Presumably, this better miscibility pre- vails in the glassy state as well. The continuously increasingTgindicates the increase in the cohesion in the glass structure with phosphate content. It is an unexpected behaviour, because the melting point of phosphate glasses is typically lower than that of silica glass. The same trend can be observed in the case of the Tx crystallization temperature up to 3% PO4
content. Above this concentration, the phosphate component becomes saturated and phase separation is preferred. The phase separation in the supercooled liquid state is indicated by the drop of the Tx for S45P5 sample.
At the same time, the investigated glasses show another minor transition, namely a 0.02–0.25% weight loss during the heat treatment. This process also indicates the appearance of some mobility in the glass structure with the increasing temperature. For S45P0, the peak of the weight loss process coincides with the glass transition temperature, indicating a close rela- tion between the two processes. The increase in phosphate content reduces the total weight loss and also the temperatures of the weight loss process. The large melting point difference between the silica and phosphate phases [32] indicates that the PO4-con- taining structure is less stable at elevated tempera- tures; thus, we anticipate that partial melting of the PO4-containing environments induces mobility in the glass structure. This process results in the lowering of weight loss temperature at higher phosphate concentration.
The decrease in total weight loss with phosphate content implies that the amount of volatile compo- nent is decreasing. Previous studies indicate the clustering of phosphate [9] and the non-uniform distribution of Ca2?in the network structure [8]. We suppose that the volatile component becomes bonded by the formation of more stable Ca(Na?)–phosphate clusters in the glass. These clusters are able to trap the volatile component and thus remove it from the channels of the silica-dominated network structure, leading to the decrease in the total weight loss during heating.
Above 800°C, the glasses transform into a crys- talline glass–ceramic material, as indicated by the presence of crystalline phases in the XRD patterns of the heat-treated sample (Fig.5). It is clearly seen that
one phase, the hexagonal sodium calcium silicate (Na6Ca3Si6O18, ICDD PDF Nr: 077-2189, B in Fig.5), is present in all the samples. This phase was identi- fied in the thermally treated BioglassÒ above 600°C as well [5]. Besides that, in sample S45P5, similarly to BioglassÒ [5] the presence of orthorhombic beta sodium calcium phosphate silicate (Na2Ca4(PO4)2
SiO4, ICDD PDF Nr: 32-1053) can be observed.
Decreasing the phosphorus content, in sample S45P3 this latter phase disappears, and only the hexagonal phase is present. Further decrease in the phosphorus content leads to the appearance of the lines of cubic sodium calcium silicate (Na15.6Ca3.84(Si12O36), ICDD PDF Nr: 75-1332, A in Fig.5), as well as further lines in sample S45P1. These unidentified lines are denoted by arrows in Fig.5. The diffractogram of sample S45P0 is fairly similar to that of S45P1 and shows the same tendency: the lines of the cubic phase and the unidentified lines are stronger, while the lines of the hexagonal phase are weaker.
Network structure from neutron diffraction and reverse Monte Carlo simulation
Several RMC runs have been completed by modify- ing the cut-off distances in such a way that the results of each run have been carefully checked to obtain reliable data for each partial pair correlation function (ppcf) and coordination number (CN) distributions.
Figure 5 XRD patterns of the different bioactive glasses after linear heat treatment up to 800°C. The different devitrified crystalline phases are indicated as green sticks—
Na15.6Ca3.84(Si12O36), ICDD PDF Nr: 75-1332, black sticks—
Na6Ca3Si6O18, ICDD PDF Nr: 077-2189, and *—
Na2Ca4(PO4)2SiO4, ICDD PDF Nr: 32-1053. Arrows indicate unidentified peaks in the S45P0 and S45P1 samples.
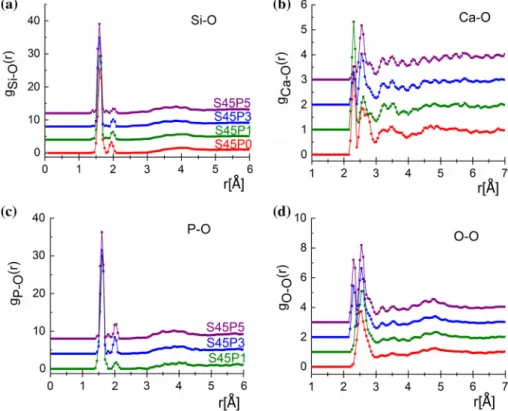
Results for the most important partial pair correlation functions obtained from the RMC simulation are displayed in Fig.6.
For Si–O, a covalent bond length at 1.60 A˚ was revealed for all studied glasses, showing an excellent agreement within limit of error (see Table5). This is a somewhat shorter value than that inv-SiO2(1.615 A˚ ) or in 70SiO2–30Na2O (1.62 A˚ ) [20 and references therein]. The coordination number distribution shows that Si atoms are surrounded by four oxygen atoms. The actual average coordination numbers are 3.67, 3.78, 3.77 and 3.78 (±0.15), where the coordi- nation constraint was fulfilled by 83.1%, 91.7%, 90.9%
and 91.2%, for the S45P0, S45P1, S45P3 and S45P5, respectively (see Fig.7a).
For the Ca–O network, we have established two distinct first-neighbour distances at 2.30±0.05 A˚ and 2.55±0.05 A˚ , in agreement with the high-reso- lution neutron diffraction study [21]. Taking into consideration the medium resolution of the present ND experiment, the agreement is reasonably repor- ted for CaSiO3glasses [8,24]. For the studied glassy compositions of the Ca–O average coordination number, distributions close to threefold coordinated oxygen atoms are obtained, that is 2.99, 2.68, 2.86 and 2.56 (±0.15) atoms for the S45P0, S45P1, S45P3 and S45P5 compositions, respectively (see Fig.7b).
The P–O first-neighbour distributions show a characteristic peak at 1.60±0.05 A˚ and a small sec- ond peak at 2.00±0.1 A˚ , where the second peak intensity changes in the function of phosphorous concentration. The agreement is reasonably reported for CaP glasses [8,21]. The P–O average coordination number varies as 3.97, 3.93 and 3.94 (±0.05) atoms for the S45P1, S45P3 and S45P5, respectively (see Fig.7c.).
Unfortunately, gNa–O(r) and gO–O(r) overlap with each other; thus, the results have to be handled carefully. It can be established that for the S45P3 and S45P5 glasses the distributions are similar. In the case of S45P0 and S45P1, the O–O distribution shows a wide distribution with one peak. This indicates that the modifier Na ions prefer the neighbourhood of Si- oxide units, indicating that Na2O acts as a modifier as it breaks up the silicate network, similarly to any alkali oxides, producing non-bridging oxygen atoms within the network. For Na–O, a double peak has been revealed at 2.27–2.35±0.03 A˚ and 2.62 ±0.03 A˚ for all samples [34, 35]. Two well-de- fined peaks have been obtained for the O–O at 2.30 ±0.03 A˚ and 2.65±0.04 A˚ [8,22,36]. Note that the overlapping character of Na–O and O–O distri- butions should be taken into account.
Figure 6 aSi–O,bCa–O, cP–O anddO–O ppcf’s for S45P0 (red), S45P1 (green), S45P3 (blue) and S45P5 (purple) glasses.
The RMC modelling provides information on the second coordination sphere. The shortest second- neighbour distances are obtained for the Si–Si and Si–
P ppcf’s with characteristic distributions, as it is illustrated in Fig.8.
Si–Si correlation functions show distributions at 2.95/3.05±0.02 A˚ , which is in good agreement with the literature data [20,22] and supports the formation of well-defined SiO4 units. In the case of S45P1 sample, the Si–P correlation functions consist of a double peak with distances at 2.85/3.10±0.05 A˚ , these are melting to the one wider peak at 3.10±0.05 A˚ for the S45P3 and S45P5 samples, and the P concentration dependence can be observed. The shortest second-neighbour distances obtained for Si–
P as*3 A˚ show a connection between the SiO4and PO4 tetrahedral units, which indicates that in the
building of the basic glass network take parts the [4]Si–O–[4]P linkages.
We have calculated the three-particle bond angle distributions (BAD) using the final atomic configu- ration of the RMC simulation, plotted as the function of both cos(h) andh, scale below and above, respec- tively, where h represents the actual bond angle.
Figure9 shows the distributions for the network former atoms: Si–O–Si, O–Si–O, P–O–P, O–P–O, P–O–
Si and O–O–O. For the Si–O–Si and O–Si–O, the peak positions are at 148°±3°and 108°±3°, respectively, which are very close values to the ideal tetrahedral (Si–O–Si and O–Si–O at 149°and 109.5°[37]) config- uration. O–Si–O bond angle distribution exhibits a pronounced shoulder at a lower value, at 91°±3°.
The peaks of the bond angle distributions for P–O–P and O–P–O are very similar to Si–O–Si and O–Si–O Figure 7 aSi–O,b CaO and cPO CN’s distributions from RMC modelling: S45P0 (red), S45P1 (green), S45P3 (blue) and S45P5 (purple) glasses.
Table 5 Most important oxygen-linked atomic distance,rij(A˚ ) obtained from RMC simulation
Sample Interatomic distances,rij(A˚ )
Si–O Ca–O Na–O P–O O–O
S45P0 1.60±0.01 2.30/2.55±0.05 2.25/2.65±0.05 – 2.52±0.05 S45P1 1.60±0.01 2.30/2.60±0.05 2.25/2.60±0.05 1.60±0.05 2.55±0.05 S45P3 1.60±0.01 2.30/2.55±0.05 2.25/2.55±0.05 1.60±0.05 2.30/2.55±0.05 S45P5 1.60±0.01 2.33/2.55±0.05 2.25/2.55±0.05 1.60±0.05 2.30/2.56±0.05
Figure 8 Second-neighbour partial atomic pair correlation functions obtained from the RMC modellingaSi–Si and bSi–P, where S45P0 (red), S45P1 (green), S45P3 (blue) and S45P5 (purple) glasses.
distributions. Characteristic distribution of P–O–P bonding angles show peaks at 145°±5°. The broad distribution of O–P–O bond angles shows double peaks, the average angles being 107.5°±5° and 92°±5°. These distributions suggest that fourfold P atoms are present. The O–P–O bond angle distribu- tions are close to the O–Si–O distribution. These detailed features of Si–O–Si and P–O–P bond angle distributions are consistent with the obtained coor- dination numbers. The P–O–Si distribution shows a peak at 149°±5° at lower phosphorous concentra- tion. With increasing the P concentration appears a second peak at 135±3°, which became stronger with the increasing P concentration. The P–O–Si angle distribution is close to the Si–O–Si/P–O–P
distributions, in agreement with Tilocca et al. [7]. The O–O–O bond angle distribution shows peaks centred at 60°±2°.
The short-range order of the glassy network structure is determined by two parameters, the bond length and the oxygen–cation–oxygen bond angles.
Si–O and P–O bond lengths, both 1.60 A˚ , coincide for all compositions within the error of the measurement (Table 1) and bond angle distributions, specific of the silicate structure, fall fairly close to each other as well (Fig.8). This implies similar average network struc- tures for all compositions, in good agreement with the literature data [38, 39]. However, careful obser- vation of the average coordination numbers allows us to make some considerations regarding the Figure 9 aSi–O–Si,bO–Si–
O,cP–O–P,dO–P–O,eP–
O–Si andfO–O–O BAD for S45P0 (red), S45P1 (green), S45P3 (blue) and S45P5 (purple) glasses.
changeability in the network structure. In the case of S45P0 glass, the average coordination number of Si is 3.67, in agreement with the literature data for soda–
lime glasses [40], indicating the presence of non- bridging oxygen, i.e. Si–O–Ca- and Si–O–Na-type connections, which break up the network structure [41]. By adding phosphate to the system, the coordi- nation number of Si slightly increases, but still remains below 4 (3.78, 3.77 and 3.78, for S45P1, S45P3 and S45P5, respectively), while that of P fairly coin- cides with the ideal value of the tetrahedral PO4units (3.97, 3.93 and 3.94 for S45P1, S45P3 and S45P5, respectively).
Similarly, different coordination numbers were found for the network formers Al and Si in Cax/2Alx
Si1-xO2glasses [38] and explained by the presence of Si–O–Ca-type bonds, which reduces the coordination number of Si without creating vacancy in the network structure [42]. This way, two types of atomic envi- ronments are forming in Ca–Al–Si-oxide glasses, namely Si–O and Al–O tetrahedral, and the former one will promote the disintegration of the network structure by the non-bridging oxygen-type Si–O–Ca linkages.
In our case, silica-rich and phosphate-rich envi- ronments were deduced from thermal measure- ments. The linear increase in Tg with phosphate content indicates the strengthening of network structure, which is also reflected in the increase in the average coordination number of Si by ca. 3%. We
propose that this strengthening of the network structure relies on the removal of Ca (and probably Na) from the environment of Si by the phosphate clusters. In this way, Ca- and P-rich environments
Figure 10 aTotal pair distribution functions from electron diffraction measurements,blow r range of the total pair distribution functions from electron diffraction measurements with the indicated first-neighbour distances determined by neutron-based RMC simulation.
Figure 11 aTypical HRTEM image taken from the S45P5 glass indicates nanocrystalline domains in the glassy matrix.bInverse Fourier transform of the area indicated by white box, which contains a nanocrystal embedded in the glassy matrix.c Lattice fringe periodicity of the nanocrystal is measured as 2.7 A˚ .
form, which, as indicated by the coordination num- bers of P, are well ordered, independently of the overall phosphate content of the glass. These Ca–P clusters are similar in bonding to the building blocks of crystalline Ca–phosphates which can be stable up to above 1000°C. Thus, the increase in thermal sta- bility reflected in the slopes of theTgcan be explained by the formation of P–O–Ca instead of non-bridging oxygen-type Si–O–Ca linkages. As phosphate traps Ca (and probably Na) by incorporating them into a more ordered, and thermally more stable structure,
the weight loss should seemingly decrease with phosphate content, which is in agreement with ther- mal data (Fig.4b).
Nanostructure: ePDF analysis, HRTEM and XPS
As both thermal properties and RMC indicated nanoscale inhomogeneities in the network structure, an attempt was made to prove directly the presence of these inhomogeneities using local analytical
Figure 12 Low-magnification HRTEM of sample S45P5.
a Image taken at the beginning of the analysis, b Fourier transform of the whole, ca. 1509150 nm area indicates the dominance of 8.1 A˚ , 5.2 A˚ and 3.4 A˚ periodicities which are in good agreement withd(100),d(101) andd(200) lattice spacings of
apatite.cAfter a few minutes of exposure to the electron beam, the studied volume exhibits a significant structural rearrangement.
d On the Fourier transform of c Miller indices of apatite are marked.
methods. Electron diffraction-based pair distribution function (ePDF) analysis was carried out on S45P5 sample. As this sample has the highest P2O5content, structural deviations from the SiCaNa glasses, if there are any, are expected to be the most enhanced.
Figure10 shows the total pair distribution func- tions of the ED measurements (ePDF). Comparing atomic distances derived from neutron-based RMC and ePDF, it can be concluded that the main peak positions are the same; however, smaller shift can be observed in the case of the 1.6 A˚ and 2.3 A˚ peaks. It has been proven for nanocrystalline materials that ePDF peak positions can be used for fingerprint phase identification [43]. Similarly, we made a set of measurements on amorphous silica, which indicated that peak position originating from atom pair fre- quencies on ePDF does not vary with experimental and evaluation parameters (Supplementary Mate- rial). Thus, we think that the ePDFs reflect real structural features and imply structural inhomo- geneities on the nanometre scale.
Figure11 shows a HRTEM image of the S45P5 sample. Lattice fringes of 2.7 A˚ periodicity are apparent, which originates from a ca. 5-nm-sized crystalline domain embedded in the amorphous matrix. Such crystalline nanodomains remain unre- vealed during bulk neutron diffraction measure- ments, and their uneven distribution in the glass matrix can lead to the observed differences in the ePDFs.
Besides individual crystalline nanodomains like the one shown in Fig.11, larger areas exhibiting nanocrystalline character have been also observed (Fig.12a). The Fourier transform of the ca.
1509150 nm area (Fig.12b) provides an overview of the distribution of spatial frequencies in the anal- ysed sample volume. According to the intensity profile, 8.1 A˚ , 5.2 A˚ and 3.4 A˚ periodicities are dominant, which are in good agreement withd(100), d(101) and d(200) lattice spacings of apatite. The studied area exhibited strong radiation sensitivity, and a significant structural rearrangement was observed after few minutes under the electron beam (Fig.11c, d). The resulting structure is also nanocrystalline and, according to the Fourier trans- form (Fig.11d), can be identified as apatite. Com- paring the Fourier transforms before and after the structural rearrangement, it seems that the size of the crystalline domains not, only their number has increased.
As the crystalline (apatite-like) character has been enhanced under the electron beam, we cannot state steadily that the crystalline domains presented in Fig.11a are inherent in the S45P5 glass structure.
However, the fact that the structural rearrangement under the electron beam resulted in nanocrystalline apatite serves as an indirect proof of the chemical inhomogeneity of the glass structure, manifested in the formation of Ca- and P-rich environments. The sample volume analysed in Fig. 11 originally con- tained undoubtedly more Ca and P than silica, as proven by its ability to transform into nanocrystalline apatite. Sample volumes, which did not show this type of structural rearrangement, are supposed to build up by dominantly silica.
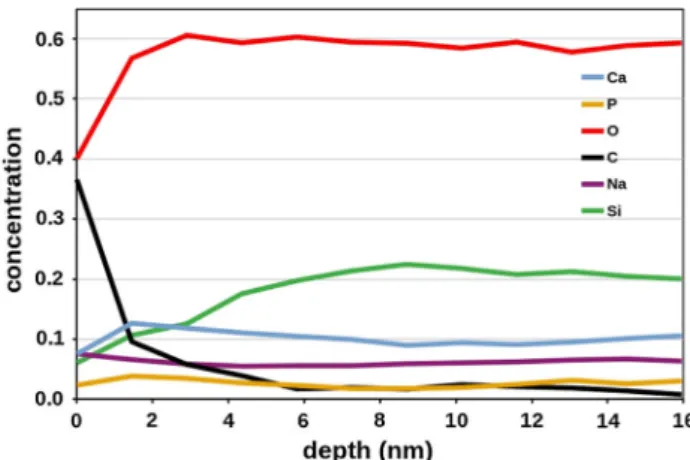
Surface properties, like morphology, surface area and surface chemistry, have prominent role in bioactivity. As the surface composition can deviate even significantly from the bulk composition, XPS measurements were applied to judge the potential bioactive behaviour of the glass samples. All the samples exhibited strong carbon signal due to surface contamination. Depth profile measurement of the highest-phosphate-containing S45P5 glass (Fig.13) indicates that this carbon signal disappears at ca.
2 nm depth, and, in parallel, the concentration of Si increases. Interestingly, Na and P concentrations remain almost constant, irrespectively of the surface contamination. The detected P content in this S45P5 is 2.6 at% which corresponds to 9.2 mol% P2O5. That is somewhat higher than the nominal 5 mol% of P2O5. Since the information depth of XPS measurement is about 3 nm for these peaks, the far bulk composition is not reached by this technique. The increased P2O5
Figure 13 Elemental concentration down to ca. 15 nm depth calculated from XPS lines for S45P5 specimen.
content in the studied 15-nm layer with respect to the expected bulk value can be attributed to the quenching procedure and anticipates good reactivity under physiological conditions.
Bioactivity
The bioactivity is generally described as the apatite- forming ability of the material on its surface after merging in SBF. Although there are several recipes
and procedures to test the bioactivity, in this study we followed the most frequently used protocol pub- lished by Kokubo and Takadama [17] completed with the criterion regarding the CO2partial pressure [16].
Figure14 presents SEM images and EDS spectra of the well-developed reaction layer formed after 21 days of soaking in SBF.
On the surface of all three PO4-containing glasses, a phosphorus-containing reaction layer was formed already after 30-min soaking [44]. This reaction layer was not continuous, and its composition also Figure 14 SEM images at two different magnifications together
with the EDS spectra of the reaction layer formed on the surface of the PO4-containing samples after 21 days of soaking in SBF prove
the apatite-forming ability.a,bS45P1 sample,c,dS45P3 sample, e,fS45P5 sample.
changed from place to place. Morphologically, simi- lar layer was formed on the surface of the S45P0 sample as well; however, this layer was phosphorus free. As the SBF is supersaturated with respect to apatite, this observation is of key importance and supports that the reaction layer is indeed the product of the incipient ion exchange between SBF and glass and not heterogeneously precipitated phosphate phase on the surface of the glass.
Based on morphological and compositional criteria [17], the apatitic reaction layer on the surface of all three samples can be recognized. A detailed nanos- tructural analysis of the bioactive layer of the glass samples is a subject of another paper.
Conclusions
The structure of SiO2(45)CaO(25)Na2O(30-x)P2
O5(x) (x = 0, 1, 3, 5) glasses has been studied using diffraction methods, RMC simulation and HRTEM and compared to the composition-dependent thermal properties.
Neutron diffraction-based RMC simulation revealed that the average Si–O and P–O network structures of the different glasses with Ca and Na modifiers are similar on the short-range scale, since both partial pair correlation functions and first neighbours nearly coincide for the different glasses within the error of the measurement. However, the differences observed in the coordination of the Si and P atoms indicate varying medium-range order for the different glass compositions.
Based on the tendentious change of thermal sta- bility with increasing P content, we presume that weakly bounded Ca (and Na) was removed from the environment of Si in the silicate network by forming phosphate clusters which are more stable as they melt above 1000°C in the bulk form. Thus, the enhanced thermal stability, reflected in the linear increase in the glass transition temperature with phosphate content, can be explained by the formation of these P–O–Ca linkages instead of non-bridging oxygen-type Si–O–Ca linkages. Therefore, Ca–P-rich clusters are similar in bonding to crystalline Ca–
phosphates and may trap additional volatile cations, like Na, in agreement with the total weight loss of the glasses on thermal activation. The tendency for Na–P association in weakly bounded atomic environments was demonstrated by the Na- and P-rich surface
chemistry revealed by XPS, while, at the larger P content (x= 5), the formation of Ca–P-rich clusters as nanometre-range heterogeneities was observed in HRTEM. We propose that these atomic-scale hetero- geneities have a key role in the behaviour of phos- phate-doped bioactive glasses under physiological conditions.
Acknowledgements
Open access funding provided by MTA Wigner Research Centre for Physics (MTA Wigner FK, MTA EK). This work was supported by the Centre for Energy Research, Hungarian Academy of Sciences, under the Project ‘‘Investigation of biocompatible glasses for biomedical applications’’ (125/2017 and 109/2018), and in minor part by the National Research, Development and Innovation Fund Office, Hungary, under the project ‘‘Investigation of the nanostructural background of functionality in case of biogenic and biocompatible mineral apatite’’, grant number K-125100. V.K.K. is indebted to the Ja´nos Bolyai Fellowship of the Hungarian Academy of Sciences and the U´ NKP-19-4 New National Excel- lence Program of the Ministry for Innovation and Technology. Work of Zs.K. was completed in the ELTE Institutional Excellence Program (1783-3/2018/
FEKUTSRAT) supported by the Hungarian Ministry of Human Capacities.
Electronic supplementary material: The online version of this article (https://doi.org/10.1007/s108 53-019-04206-z) contains supplementary material, which is available to authorized users.
Open Access This article is distributed under the terms of the Creative Commons Attribution 4.0 Inter- national License (http://creativecommons.org/licen ses/by/4.0/), which permits unrestricted use, distri- bution, and reproduction in any medium, provided you give appropriate credit to the original author(s) and the source, provide a link to the Creative Commons license, and indicate if changes were made.
References
[1] Jones JR (2013) Review of bioactive glass: from Hench to hybrids. Acta Biomater 9:4457–4486
[2] Gerhardt LC, Boccaccini AR (2010) Bioactive glass and glass–ceramic scaffolds for bone tissue engineering. Mate- rials 3:3867–3910
[3] Baino F, Vitale-Brovarone C (2011) Three-dimensional glass-derived scaffolds for bone tissue engineering: current trends and forecasts for the future. J Biomed Mater Res A 97:514–535
[4] Abou Neel EA, Pickup DM, Valappil SP, Newport RJ, Knowles JC (2009) Bioactive functional materials: a per- spective on phosphate-based glasses. J Mater Chem 19:690–701
[5] Lefebvre L, Chevalier J, Gremillard L, Zenati R, Thollet G, Bernache-Assolant D, Govin A (2007) Structural transfor- mations of bioactive glass 45S5 with thermal treatments.
Acta Mater 55:3305–3313
[6] Elgayar I, Aliev AE, Boccaccini AR, Hill RG (2005) Structural analysis of bioactive glasses. J Non-Cryst Solids 351:173–183
[7] Tilocca A, Cormack NA, Leeuw NH (2007) The structure of bioactive silicate glasses: new insight from molecular dynamics simulations. Chem Mater 19:95–103
[8] FitzGerald V, Pickup DM, Greenspan D et al (2007) A neutron and X-ray diffraction study of BioglassÒ with Reverse Monte Carlo modelling. Adv Funct Mater 17:3746–3753
[9] Fayon F, Due´e C, Poumeyrol T, Allix M, Massiot D (2013) Evidence of nanometric-sized phosphate clusters in bioactive glasses as revealed by solid-state 31 P NMR. J Phys Chem C 117:2283–2288
[10] Lockyer MWG, Holland D, Dupree R (1995) NMR inves- tigation of the structure of some bioactive and related glas- ses. J Non-Cryst Solids 188:207–219
[11] Karadjin M, Essers Ch, Tsitlakidis S, Reible AM, Boccaccini AR, Westhauser F (2019) Biological properties of calcium phosphate bioactive glass composite bone substitutes: cur- rent experimental evidence. Int J Mol Sci 305:1–22 [12] Sva´b E, Gy Me´sza´ros, Dea´k F (1996) Neutron powder
diffractometer at the Budapest research reactor. Mater Sci Forum 228:247–252
[13] Cuello GJ, Darpentignz J, Hennet L (2016) 7C2, the new neutron diffractometer for liquids and disordered materials at LLB. J Phys Conf Ser 746:012020
[14] Kis VK, Do´dony I, La´ba´r JL (2006) Amorphous and partly ordered structures in SiO2 rich volcanic glasses. An ED study. Eur J Miner 18:745–752
[15] Crist BV (ed) (2000) Handbook of monochromatic XPS spectra. Wiley, New York
[16] Bohner M, Lemaitre J (2009) Can bioactivity be tested in vitro with SBF solution? Biomaterials 30:2175–2179
[17] Kokubo T, Takadama H (2006) How useful is SBF in pre- dicting in vivo bone bioactivity? Biomaterials 27:2907–2915 [18] Hannon AC (2006) ISIS Disordered materials database. h ttp://www.isis2.isis.rl.ac.uk/Disordered/Database/DBMain.h tm
[19] Gereben O, Jovari P, Temleitner L, Pusztai L (2007) A new version of the RMC?? Reverse Monte Carlo programme, aimed at investigating the structure of covalent glasses.
J Optoelectron Adv Mater 9:3021–3027
[20] Fa´bia´n M, Jo´va´ri P, Sva´b E, Gy Me´sza´ros, Proffen T, Veress E (2007) Network structure of 0.7SiO2–0.3Na2O glass from neutron and x-ray diffraction and RMC modelling. J Phys Condens Mater 19:335209
[21] Wetherall KM, Pickup DM, Newport RJ, Mountjoy G (2009) The structure of calcium metaphosphate glass obtained from X-ray and neutron diffraction and reverse Monte Carlo modelling. J Phys Condens Mater 21:035109 [22] Fa´bia´n M, Sva´b E, Gy Me´sza´ros, Zs Re´vay, Proffen T,
Veress E (2007) Network structure of multi-component sodium borosilicate glasses by neutron diffraction. J Non- Cryst Solids 353:2084–2089
[23] Vedishcheva NM, Shakhmatkin BA, Wright AC (2004) The structure of sodium borosilicate glasses: thermodynamic modelling vs. experiment. J Non-Cryst Solids 39:345–346 [24] Mead RN, Mountjoy G (2005) The structure of CaSiO3glass
and the modified random network model. Phys Chem Glasses 46:311–314
[25] Kohara S, Suzuya K (2005) Intermediate-range order in vitreous SiO2 and GeO2. J Phys Condens Matter 17:S77–
S86
[26] Peng LM, RenSL Dudarev SL, Whelan MJ (1996) Robust parametrization of elastic and absorptive electron atomic scattering factors. Acta Cryst A52:257–276
[27] La´ba´r JL (2005) Consistent indexing of a (set of) SAED pattern(s) with the process diffraction program. Ultrami- croscopy 103:237–249
[28] Zuo JM (2000) Electron detection characteristics of a slow- scan CCD camera, imaging plates and film, and electron image restoration. Microsc Res Tech 49:245–268
[29] Ojovan MI (2008) Viscosity and glass transition in amor- phous oxides. Adv Condens Mater Phys.https://doi.org/10.
1155/2008/817829
[30] Fanderlik I (1991) Silica glass and its application. Glass science and technology, vol 11. Elsevier, Amsterdam. ISBN 0-444-98755-X
[31] Mabrouk A, Bachar A, Atbir A, Follet C, Mercier C, Tri- coteaux A, Leriche A, Hampshire S (2018) Mechanical properties, structure, bioactivity and cytotoxicity of bioactive Na–Ca–Si–P–O–(N) glasses. J Mech Behav Biomed Mater 86:284–293
[32] Fulchiron R, Belyamani I, Otaigbe JU, Bounor-Legare V (2015) A simple method for tuning the glass transition process in inorganic phosphate glasses. Sci Rep 5:8369. h ttps://doi.org/10.1038/srep08369
[33] Rahman M, Hudon P, Jung I-H (2013) A coupled experi- mental study and thermodynamic modelling of the SiO2– P2O5system. Metal Mater Trans 44B:837–852
[34] Fabian M, Svab E, Proffen Th, Veress E (2008) Structure study of multi-component borosilicate glasses from high-Q neutron diffraction measurement and RMC modelling.
J Non-Cryst Solids 354:3299–3307
[35] Cormier L, Neuville DR (2004) Ca and Na environments in Na2O–CaO–Al2O3–SiO2glasses: influence of cation mixing and cation-network interactions. Chem Geol 213:103–113 [36] Poulsen HF, Neuefeind J, Neumann HB, Schneider JR,
Zeidler MD (1995) Amorphous silica studied by high energy X-ray diffraction. J Non-Cryst Solids 188:63–74
[37] Floriano MA, Venezia AM, Deganello G, Svensson EC, Root JH (1994) The structure of pumice by neutron diffraction. J Appl Cryst 27:271–277
[38] Petkov V, Billinge SJL, Shastri S, Himmel B (2000) Poly- hedral units and network connectivity in calcium alumi- nosilicate glasses from high-energy X-ray diffraction. Phys Rev Lett 85:3436
[39] Bouty O, Delaye JM, Beuneu B, Charpentier T (2001) Modelling borosilicate glasses of nuclear interest with the help of RMC, WAXS, neutron diffraction and 11B NMR.
J Non-Cryst Solids 401:27–31
[40] Ha MT, Garofalini SH (2016) Local structure of network modifier to network former ions in soda-lime alumina- borosilicate glasses. J Am Cer Soc 14565:1–9
[41] Yu Y, Renny M, Eden M (2018) Quantitative composition- bioactivity relationships of phosphosilicate glasses: bearings from the phosphorus content and network polymerization.
J Non-Cryst Solids 502:106–117
[42] Stebbins JF, Xu Z (1997) NMR evidence for excess non- bridging oxygen in an aluminosilicate glass. Nature 360:60–62
[43] Gorelik TE, Schmidt MU, Kolb U, Billinge SLJ (2015) Total-scattering pair-distribution function of organic material from powder electron diffraction data. Microsc Microanal 2:459–471
[44] Mahdi OS (2019) Bioactive glasses in dental applications (literature review). J Univ Babylon Eng Sci 27:207–2012 Publisher’s Note Springer Nature remains neutral with regard to jurisdictional claims in published maps and institutional affiliations.