Journal of Non-Crystalline Solids 581 (2022) 121416
Available online 17 January 2022
0022-3093/© 2022 The Author(s). Published by Elsevier B.V. This is an open access article under the CC BY license (http://creativecommons.org/licenses/by/4.0/).
Tracking the initial stage of bioactive layer formation on Si-Ca-Na-P oxide glasses by nanoindentation
Zsolt Kov ´ acs
a,*, Margit F ´ abi ´ an
b, No ´ emi Sz ´ asz
b, Inna Sz ´ ek acs ´
b, Vikt oria Kov ´ ´ acs Kis
b,*aDepartment of Materials Physics, Institute of Physics, E¨otv¨os Lor´and University, H-1117 Budapest, P´azm´any P´eter st, 1/a, Hungary
bCentre for Energy Research, H-1121 Budapest, Konkoly-Thege Mikl´os u, 29-33, Hungary
A R T I C L E I N F O Keywords:
Bioactive glass Simulated body fluid Bioactive layer Nanoindentation
A B S T R A C T
Because of their excellent degradability and bioactivity in the human body, bioactive glasses of wide composi- tional range are synthesized for regenerative medicine and therapeutic functions. In this paper, the bioactivity of SiO2(45)CaO(25)Na2O(30-x)P2O5(x) x =0,1,3,5 glasses was tested in vitro by soaking for 30 min in simulated body fluid. Bioactive surface layer formation after this short treatment was assessed by focused ion beam assisted scanning electron microscopy and nanoindentation. Based on the nanoindentation tests, a novel method for quantitative assessment of bioactive layer formation is presented. Connection between the mechanical properties and glass network structure parameters is established up to the theoretical yield strength. It is demonstrated that the ratio of hardness and Young’s modulus provides estimation of the structural evolution during simulated body fluid treatments and thus, in the initial stage of bioactive layer formation, serves as a good parameter for measuring the bioactivity.
1. Introduction
Bioactive glasses exhibit the ability of bonding to living tissue when implanted into a living organism [1]. The first bioactive glass, Bioglass®
was developed for bone regeneration purposes [2–5], however, recently several new glass compositions are designed for therapeutic functions e.
g. for tumor treatment [6,7] and wound healing [8], and bioactive glass is also applied as a surface coating on metallic implants to improve their biological performance [9]. Besides excellent degradability, another advantage of bioactive glasses is the easy tuneability of composition, which allows functionalization through controlled ion release, e.g. Co and Mg doped bioactive glasses with the same network parameters, thus same degradation rate as Bioglass®, was designed for promoting blood vessel formation through cobalt release [8].
The initial assessment of the bioactivity of a newly formulated glass composition is based on in vitro experiments: the glass is immersed in simulated body fluid (SBF) under conditions similar to the physiological ones [10,11] and the characteristic thickness and evolution time of the HAp surface layer are monitored. Comparative studies support similar time dependent development of the bioactive surface layer under in vitro and in vivo conditions [12]. Details of the formation of these sur- face layers are described in [13–16].
Bioactive glasses are built up from network former cations (i.e. Si and P), which are linked by bridging oxygens (BO), and network modifiers (i.
e. Ca, Na), which break the continuity of the glass network by estab- lishing bonds with the network formers via non-bridging oxygens (NBO). Average number of BO atoms per network forming atoms [17, 18], or in other form, the network connectivity [19] was recommended as a useful parameter when predicting bioactivity from nominal composition. Later, supported by experimental evidences [20–24] and molecular dynamical simulations [25], separate handling of the network former Si and P atoms was proposed [26] and the average number of BO per individual network formers (Si or P) was used to give a preliminary estimation of bioactivity based on nominal composition. Thus, in the case of Si-Ca-Na-P-O glasses, the silicate network connectivity can be obtained, which provides better assessment of reactivity by taking into account the preferential aggregation of network modifiers (e.g. Ca, Na) in the environment of phosphorus. As for the role of phosphorus, experimental studies [27] and theoretical considerations indicate that minor doping of Si-Ca-Na-O glasses promotes bioactive layer formation, however, if the phosphate is the major component, no reactivity in SBF is measured.
Besides silicate network connectivity and phosphorus content, the role of network modifier Na has to be also emphasized. Hydration of Si-
* Corresponding authors.
E-mail addresses: kovacszs@metal.elte.hu (Z. Kov´acs), kis.viktoria@ek-cer.hu (V.K. Kis).
Contents lists available at ScienceDirect
Journal of Non-Crystalline Solids
journal homepage: www.elsevier.com/locate/jnoncrysol
https://doi.org/10.1016/j.jnoncrysol.2022.121416
Received 11 December 2021; Received in revised form 7 January 2022; Accepted 8 January 2022
Journal of Non-Crystalline Solids 581 (2022) 121416 Ca-Na oxide glasses is driven by the interdiffusion of H+/H3O+and Na+
[28], which leads to the formation of percolation channels [29], fast migration pathways for ions during the later stages of bioactive layer formation [30]. These parameters, namely the phosphorus and sodium content, and the silicate network connectivity are used for initial opti- miziation of bioactive glass composition [27,31-33], however, there are experimental evidences indicating that excellent bioactivity can be achieved in the case of sodium free glass composition as well [34].
In vitro bioactivity is generally estimated based on the qualitative evaluation of X-ray diffraction, spectroscopic, or electron microscopic data by revealing the appearance of the carbonated HAp layer in the surface layer as proposed by [10]. Indeed, only a restricted number of experimental works aim for the quantitative monitoring of either the time evolution of the bioactive layer, or the absolute amount of the developed calcium phosphate phase, or both [33,35,36]. In this study, we report an alternative approach to the quantitative assessment of the bioactive layer formation by using nanoindentation. Nanoindentation is a surface testing method, sensitive to processes occurring in about the upper μm3 volume of the material. Nanoindentation has been used for tracking surface degradation of metallic alloys induced by corrosion e.g.
[37], the effect of ion exchange [38], and hydration [39] on near-surface mechanical properties in the case of silicate glasses, and also to follow water-mediated processes on the surface of biological hard tissues like dental enamel dissolution [40–42] and remineralization [43,44].
In the following, we demonstrate that the very initial stage of the bioactive layer formation can be traced by nanoindentation testing.
Analysis of Young moduli and Vickers hardness values obtained before and after SBF treatment as short as 30 mins, allows to establish a quantitative relationship between composition and surface layer formation.
2. Materials and methods 2.1. Samples and surface treatment
Compositional series of melt quenched SiO2(45)CaO(25)Na2O(30-x) P2O5(x), where x = 0,1,3,5 (in mol%) glasses [45], shortly referred hereafter as S45Px, x =0,1,3,5, has been subjected to in vitro bioactivity test, according to the protocol [10]. The volume of SBF (Vs in ml) used for the bioactivity test was set according to the relation Vs/Sa =10, where Sa is the surface area of the sample in mm2 [10]. The bioactivity test was performed in an incubator at 37 ◦C, the partial pressure of CO2
was set to 0.05 atm [11], in agreement with human serum conditions.
The glass samples were kept in the SBF for 30 min and after were rinsed with distilled water, tapped, and let to dry completely at room temperature.
2.2. Imaging
Imaging of the surface was performed using a Zeiss Axio Imager M2m optical microscope with in axis illumination and in secondary electron (SE) and back scattered electron (BSE) modes of an FEI Scios 2 Dual- Beam system scanning electron microscope (SEM). To avoid charging in the SEM and thus ensure mechanical stability, a thin amorphous carbon layer was deposited onto the sample surface. The composition of the surface layers was determined by energy dispersive spectroscopy (EDS) within the SEM. To reveal the cross-section of the surface layers formed during the immersion of the glasses into the SBF and study the pene- tration depth of the solution as well as the related compositional changes, ca. 5–10 µm ×10–30 µm sized and approximately 6–12 µm deep trenches were cut perpendicular to the sample surface using the focused ion beam gun (FIB) of the dual beam system. To protect the sample surface during FIB milling of the trench, the milling was pre- ceded by the deposition of a 2 µm thick Pt protective layer onto the surface using 2 kV electrons and subsequently, 30 kV Ga-ions. Imaging of the surface of the trenches was performed in the same SEM by tilting
the sample to 45 deg from the normal vector of the surface. The effect of tilting was compensated in the corresponding SEM images.
2.3. X-ray diffraction
X-ray diffraction (XRD) pattern were acquired from the surfaces of the S45Px (x =0,1,3,5) samples after SBF treatment by using a RIGAKU SmartLab diffractometer in θ− 2θ geometry with Cu-Kα X-ray radiation.
The information volume of the XRD measurements was approximately 0.25 cm2 area x 10 µm depth.
2.4. Nanoindentation
Nanoindentation tests were performed on the flat surfaces of the untreated and the SBF treated samples using an UMIS nanoindentation device with Vickers indenter by applying a maximum load of 50 mN at a loading rate of 0.5 mN/s. 160 measurements were performed on each sample in a 4 ×40 matrix with 40 μm separation between the neigh- boring indents. The Vickers hardness (HV) and the Young’s modulus (E) from each test were determined by the Oliver-Pharr method [46].
3. Results
3.1. Morphological, structural and compositional changes on the SBF treated surface
Short, 30 min SBF treatment produced a surface layer along all the samples. After taking out the samples from the aqueous solution, they were air-dried. Drying leads to the loss of some already incorporated, but loosely bonded water species, which induced shrinking of the sur- face layer. Thus, all samples exhibit in-layer tensile stresses and certain degree of surface fracturing as shown by the optical micrographs of the treated surfaces in Fig. 1. Additionally, micrometer-sized patches were also seen on the surface of samples S45Px (x =0,1,3), which, according to SEM images, have irregular or spherical morphology (indicated by P for “patches” on Fig. 1c). In the case of sample S45P5, heterogeneous morphological elements from the sub-micrometer to ten-micrometer scale were observed on the strongly fractured surface. Typically the 30 min SBF treatments are too short to analyze the bioactivity of the glass samples, therefore the same compositions were also treated for up to 21 days. For reference, see the SEM images of the altered surface layers of phosphorus containing S45Px (x =1,3,5) glasses after 21 days of SBF soaking in our recently published work [45].
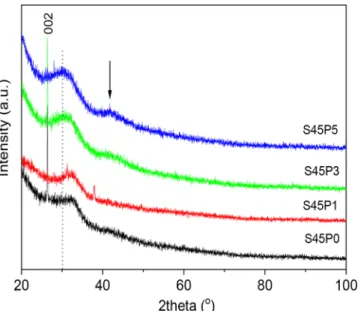
To assess the structural changes caused by SBF treatment, XRD pat- terns have been acquired from the surfaces of S45Px (x = 0,1,3,5) samples. Fig. 2 shows these XRD patterns and indicates that the surface layer has a dominant amorphous character, represented by a broad diffraction peak. Occasionally, the appearance of the 002 reflection also indicates the formation of minor amount of hydroxylapatite. Here we note, that soaking the same bioactive glasses for longer period (21 days) in SBF resulted in well defined Bragg peaks of OH-apatite for the S45P3 and S45P5 samples (not shown here).
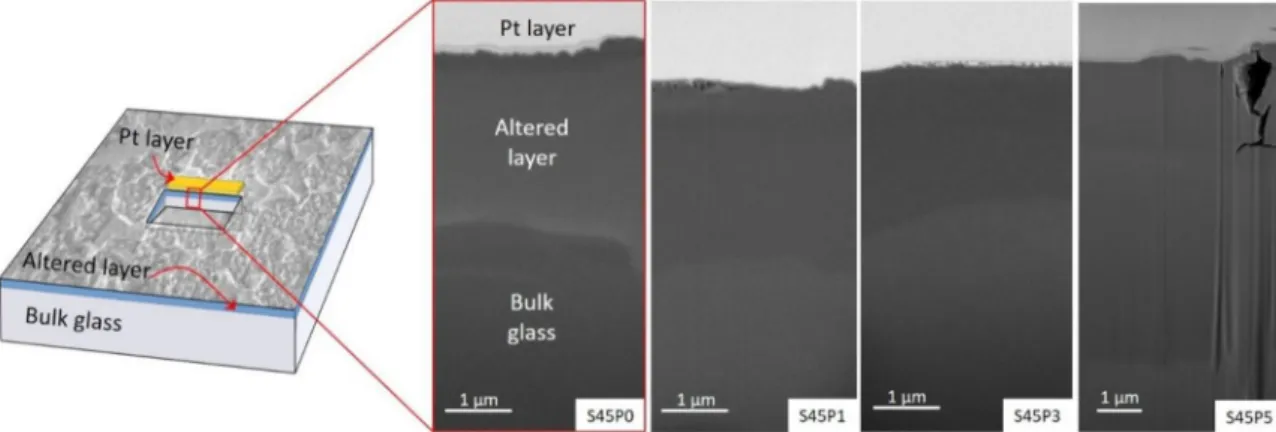
To study the penetration depth of the SBF solution and to get a measure of the reaction volume, SEM images in BSE mode were captured on the side-walls of the FIB milled trenches as seen by the schematic image in Fig. 3. The SEM images, which feature the cross-section of the surface layer formed during the SBF treatment, are shown also in Fig. 3.
In the S45P0, S45P1, and S45P3 samples, the surface layer consists of a top part with visible ~30–40 nm voids and a thicker (approx. 2 - 3 μm thick) bottom layer with altered composition, as indicated by contrast change in the BSE images with depth. In the case of the S45P0 sample, the BSE image indicates two zones inside the layer of altered composi- tion. On contrary, the layer with altered composition is thicker in the S45P5 sample (approx. 4.5 μm thick) and, based on BSE contrast, two zones, an upper one of 1.2 μm and a lower one of 3.3 μm thickness can be recognized. The boundary between the two zones exhibits intensive Z. Kov´acs et al.
cracking (Fig. 3).
3.2. Mechanical characterization of untreated and SBF treated glass surfaces
Mechanical characterization of the surface layers produced during SBF treatment was carried out by a large number of nanoindentation
tests. Fig. 4 shows typical nanoindentation curves for each untreated and treated sample. As seen, the surface treatment increases substantially the indentation depth in all four glass samples. Especially the SBF- treated S45P5 sample shows a large reduction in its strength (increased indentation depth) and a sectioning of the indentation curve.
This latter indicates abrupt surface fracturing or movements of debris of the surface layer during loading of the indenter in agreement with SEM images of the surface of S45P5 sample in Figs. 1 and 3.
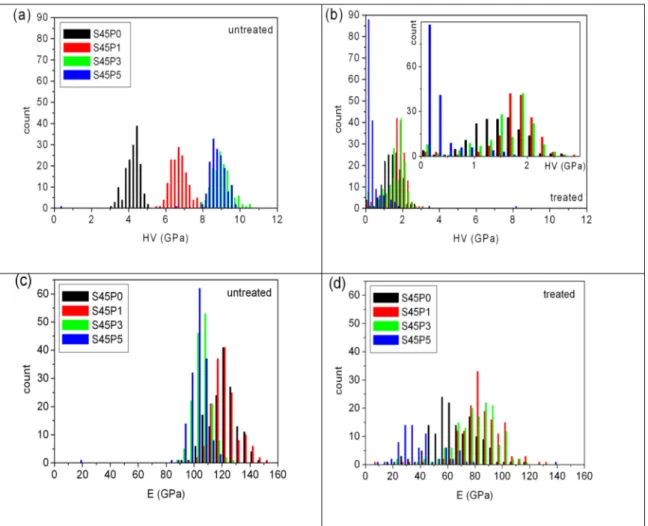
Fig. 5 shows the distributions of the hardness and Young’s modulus data obtained from the maximum indentation depth and from the (positive) slope of the nanoindentation tests for the various untreated and treated samples, respectively. The hardness of the untreated samples increases with PO4 content up to 3 mol% P2O5 concentration and no further increase was observed for the S45P5 sample. The frequency distributions for S45P0, S45P1, and S45P3 glasses exhibit Gaussian shape with well separated maxima, while the HV frequency distribution of the 5 mol% P2O5 sample overlaps with that of the 3 mol% sample (Fig. 5a). Nanoindentation tests after 30 min SBF treatment indicate a severe decrease of the hardness for all samples as seen in Fig. 5b. The frequency distributions of the individual HV measurements of S45P0, S45P1, and S45P3 glasses overlap practically and also exhibit maxima, while the hardness of the S45P5 dropped severely and the HV distri- bution has a changed decaying shape. Significantly longer SBF soaking for the same samples leaded to the formation of excessively brittle sur- face layers, which were pealed off during the drying procedure.
Initialization of the pealing off can be observed in the S45P5 sample even after 30 min soaking. This behavior limits the characterization of the dried surface by nanoindentation tests to the very early stages of bioactive layer formation.
Fig. 1. Optical (a) and (b), and SEM secondary electron (c) images of the bioactive glass samples after 30 min SBF treatment. Irregular or spherical-shaped patches enriched in Ca are indicated by P, flat area with depleted silica composition is indicated by S.
Fig. 2. XRD patterns of the SBF-treated S45Px (x =0,1,3,5) samples.
Journal of Non-Crystalline Solids 581 (2022) 121416
4. Discussion
4.1. Quantitative description of network glasses
Based on theoretical considerations, all compositions of the present study are expected to be bioactive. Composition and network parame- ters of the base, phosphorus-free S45P0 sample are close to the ternary glass composition classified as “highly bioactive” by Lebecq et al. [27].
Addition of phosphorus enhances bioactivity by increasing the molar ratio nP/nSi. Therefore, the composition of the phosphorus doped glasses was designed by varying the molar ratio of nNa/nSi and nP/nSi, the two important parameters which allows a quantitative assessment of bioactivity [26]. These parameters, together with the silicate network connectivity, N(BO)Si, which is related to the polymerization degree of the silicate network, for the studied glasses and some reference com- positions from literature are listed in Table 1. N(BO)Si silicate network connectivity is calculated by assuming a coordination number equal to 4 for phosphorus atoms, and that all phosphorus are coordinated only by NBOs [26].
4.2. Compositional and structural changes in the SBF treated surface layer
SBF treatment produces an altered surface layer with a thickness in order of micrometer on the top of each investigated S45Px (x =0,1,3,5) glass sample (Fig. 3). The interface between the surface layer and the bulk glass can be visualized by plotting the intensity profile of the SEM BSE images as a function of the distance from the surface (see Fig. 6).
These curves show an approximate Z-contrast, therefore concentration transients (which are typical at the boundary of two coexisting phases or temporal decomposition of the multicomponent glass) become visible at the interface as indicated by dashed lines in Fig. 6. Although the BSE intensity vs. distance curves exhibit some curvature due to the gradually changing imaging parameters, the transients clearly indicate local con- centration gradients and, so, locally increased diffusional currents of elements with larger average Z parameter from the – to the +sides of the boundary. Based on local EDS measurements on the side walls of the trenches, the altered layers become Ca and Na depleted, which indicates that the network modifier cations have migrated out and phosphorous migrated into the glass structure from the solution.
Taking into consideration the characteristic penetration depth of XRD to the lateral dimension of the surface layers (Fig. 3), and the results of the diffraction experiments performed on the as-quenched glasses [45] we claim that the source of halos in the XRD spectra (Fig. 2 up to 40 deg 2theta) is mainly the altered surface layer at the top of the samples and the change of the amorphous structure is related to the depletion of the glass indicated by BSE images. Thus, the obtained hardness and modulus data, due to the characteristic ~1 μm indentation depths, provide information from the compositionally and structurally altered surface layers formed during SBF treatment.
4.3. Concentration and glass network parameter dependence of mechanical characteristics
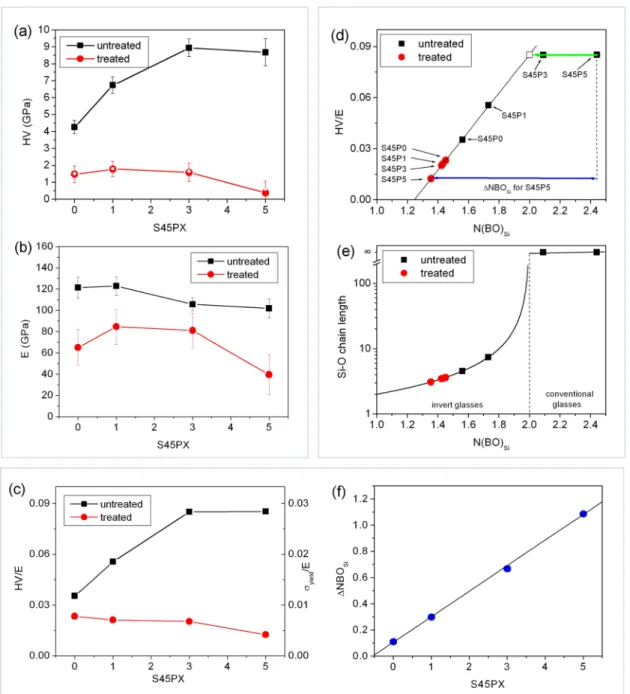
To visualize the concentration dependence of the mechanical pa- rameters, the average of both the HV and E values of each sample were calculated and plotted in Fig. 7a and b as a function of phosphorus content. Each average hardness value was calculated from 160 tests, while the average E values were obtained typically from less measure- ments, due to the difficulty to fit a positive slope linear function to the unloading part of the load-depth curves in some cases. The number of these tests with a negative slope were 4, 2, 3, and 83 for the treated S45Px (x =0,1,3,5) glass samples respectively, and was 0 in the un- treated samples. The large number of small HV values of the negative slope tests produce the peak of the HV distribution for HV <0.5 GPa in S45P5 (see the inset of Fig. 5b). The separation of the positive and negative slope measurements allowed to calculate two different average HVs, one from all the measurements and another from the measure- ments with only positive slope, for the treated samples. The average HVs from tests with positive slopes are indicated as hollow symbols in Fig. 7a and a visible difference between the two averages can only be seen for the S45P5 sample.
Strengthening of the untreated bulk glasses with increasing phos- phorus content is reflected by HV distribution data (Fig. 7a), however, the Young’s modulus of the untreated samples decreases slightly from 122±10 GPa to 102±9 GPa (Fig. 7b). It is well known that phosphorus Fig. 3. Back-scattered electron SEM images of the cross-sections of SBF treated surfaces of the S45P0, S45P1, S45P3, and S45P5 samples.
Fig. 4. Typical load-indentation depth curves before and after SBF treatment.
Z. Kov´acs et al.
dopant in silicate glasses has a key role in the bioactivity [13,15,47,48].
Also, a few mole percent of phosphorus alters significantly the bulk Si-Ca-Na glass structure by creating Ca-(Na)-P clusters with PO4 nuclei [20–23], and the number of nuclei increases with the overall phosphorus content of the glass [45]. These clusters contribute to the strengthening of the bulk network structure substantially by removing Ca from the environment of the SiOx polyhedra and thus reducing the number of Si-O-Ca non-bridging oxygens [45].
In principle, the Young’s modulus depends on the average of the bond strength, while the hardness of a sample is proportional to it’s Young’s modulus and also depends on the limit of plasticity (i.e. yield strain) of the sample. The plastic deformation in both crystalline and glassy materials reflects the availability of shearable structural defects of a given material.
Therefore, to separate the effects of these defects from the average bond strength, the average of HV/E was also calculated for the treated and untreated samples (Fig. 7c). In the case of the untreated glasses, the increase of HV/E from S45Px, x =0 to x =3 indicates the key role of P in the removal of structure defects. In solid materials, plastic deformation may occur also without the presence of mobile/soft structural defects, provided that the theoretical yield strength is reached. This occurs approximately when the yield strain of the material become higher than εyield >0.02–0.03, where εyield =σyield/E ≈HV/(3E) and σyield is the yield stress [49].
Therefore, for comparison, the approximate yield strain was also indicated in Fig. 7c. In silicate glasses, Si-O-Ca NBO sites comprise soft environments which can be considered as defects in the glass structure, as at these points the continuous network is broken by Ca and Na ions.
Fig. 5. Hardness distributions (a) before and (b) after SBF treatment. The inset show the distributions of the treated sample in a close view. Young’s modulus distributions (c) before and (d) after SBF treatment.
Table 1
Composition and network parameters of the studied glasses. For comparison, the same parameters are listed for Bioglass® [2] and some ternary glasses. (*in mole%,
**cation composition normalized to 100, ***composition data and bioactivity assessment from Lebecq et al. [27]).
SiO2 (%)* CaO (%)* Na2O (%)* P2O5 (%)* nSi** nCa** nNa ** nP** N(BO) for Si nNa/nSi nP/nSi Bio-activity
S45P0 45 25 30 0 34.6 19.2 46.1 0.00 1.56 1.33 0.00
S45P1 45 25 29 1 34.6 19.2 44.6 1.54 1.73 1.29 0.04
S45P3 45 25 27 3 34.6 19.2 41.5 4.62 2.09 1.20 0.13
S45P5 45 25 25 5 34.6 19.2 38.4 7.69 2.44 1.11 0.22
Bioglass® 46.1 26.9 24.2 2.6 36.4 21.2 38.2 4.11 2.12 1.05 0.11
A2*** 45 31.5 23.5 0 37.4 26.2 39.1 0.00 1.56 1.04 0.00 lowest
B2*** 45 27.5 27.5 0 36.9 22.5 45.1 0.00 1.56 1.22 0.00 lowest
C2*** 45 23.5 31.5 0 36.3 18.9 50.9 0.00 1.56 1.40 0.00 highest
Journal of Non-Crystalline Solids 581 (2022) 121416
As seen in Fig. 7c, the theoretical yield strength is reached for the S45P3 and S45P5 untreated glasses by the formation of Ca-(Na)-P clusters and parallel removal of NBO sites. The accompanying structural change is also visible in the N(BO)Si parameter, as it reaches N(BO)Si >2 (Fig. 7d), which indicates the formation of continuous -Si-O-Si- chains with infinite chain length throughout the corresponding glass sample. On contrary, the S45P0 and S45P1 untreated glasses are so called invert glasses [18] i.e. they contain more non-bridging than bridging oxygens (1 <N(BO)Si <2) and thus they have shorter silicate chains (Fig. 7e).
Chain lengths were calculated as 2/(2-N(BO)Si) from the number of bonding oxygen per Si atom. The number of strong interconnecting Si-O bonds between the -Si-O-Si- chains, i.e. the silicate network connectivity [26], increases with the N(BO)Si parameter, therefore, different shear deformation related phenomena, such as glass transition and plastic yielding, should correlate proportionally with the N(BO)Si and thus with the bioactivity of the glasses. Accordingly, in agreement with the Gibbs-DiMarzio equation [50], the glass transition temperature depends linearly on the number of interconnections between the -Si-O-Si- chains and, consequently, on the P content for the S45PX compositional series (see results in [45]). On other hand, the HV/E ratio may also increase proportionally with N(BO)Si (but only up to the theoretical yield strength) as indicated by black squares in Fig. 7d. These results emphasize the role of the silicate network connectivity in both shear deformation-related phenomena and biological activity of the bioactive glasses. Based on the N(BO)Si vs. HV/E relation of untreated samples, HV/E ratio proved to be a good parameter to experimentally charac- terize the N(BO)Si and the number of interconnections between the -Si-O-Si- chains in the 1 < N(BO)Si < 2 range. Furthermore, the approximate coincidence between N(BO)Si ≈2 and the maximum of the yield strength indicates that not only the presence of soft environments determines plastic behavior and yield strength of a glass, as widely accepted, but the soft atomic environments should separate the harder regions (i.e. the interconnected -Si-O-Si- chains) to have an effect on plastic deformation.
4.4. Quantitative description of the bioactive layer formation
Short, 30 min SBF treatments result in an approximately 30–90%
reduction of the HV and 20–50% reduction of the Young’s modulus of the different S45PX samples. This indicates that SBF treatment and subsequent drying of the samples reduce the average bond strength by
cutting about 20–50% of the bonds of the initial glass structure, pre- sumably by the formation of weaker Si-O-H bonds. HV/E ratio (see red dots in Fig. 7d) provides a quantitative estimation of the structural evolution and the accompanying change of the N(BO)Si for the treated samples. Fig. 7f shows ΔN(BO)Si, the difference of the number of bonding oxygens per Si atoms between the untreated and the treated states as determined from the HV/E ratio of the treated samples. Inter- estingly, this bioactivity parameter ΔN(BO)Si, exhibits a linear depen- dence on P content amid the more complicated HV/E dependence from which ΔN(BO)Si was derived, indicating a linear progression of bioactive layer formation with P content. In theory, the proposed method may also be capable to characterize in situ the structural evolution and bioactive layer formation in the initial transformation stage using nano- indentation tests. The initial stage of bioactive layer formation in bioactive glasses is related to the kinetics of ion diffusion into the solid glass matrix. The optimal values of 2.0 <N(BO)Si <2.6, 0.8 <nNa/nSi
<1.2 [26] imply that at least two characteristics of the glass structure have a strong effect on the bioactivity, namely, the silicate network connectivity and its connection to Na ions via NBOs. Altogether these two structural parameters maximize the soft/reactive atomic environ- ments of the -Si-O-Si- network, which act as an internal reactive surface having a key role in the diffusion process and so, in the bioactive layer formation.
5. Conclusions
Initial period of bioactive layer formation was investigated in a SiO2(45)CaO(25)Na2O(30-x)P2O5(x), x =0,1,3,5 compositional series.
The glass samples prepared by melt quenching were immersed into simulated body fluid (SBF) for 30 min. Scanning electron microscopy and X-ray diffraction measurements indicated structural changes in the surface layer with 2–4 μm thickness. Hardness (HV) and Youngs’s (E) modulus of the surface layer were characterized by nanoindentation before and after SBF treatment performing a large number of indenta- tion tests.
The dependence of the mechanical parameters on phosphorus con- centration was explained in terms of network structure parameters of the glasses. Change of the E and the HV/E ratio was discussed and the characteristics related to chemical bonding and plastic deformation were separated, accordingly. Variation of the P content in the untreated glasses resulted in minor change in the Young’s modulus. At the same time, severe P content dependent increase in the HV/E ratio was observed up to about 2–3 mol% concentration. At this composition N (BO)Si ≈2, which indicates that continuous -Si-O-Si- chains become interconnected in the glass. In parallel, the theoretical yield strength (HV/E ≈0.06 - 0.09), which is a general strength limit for solid mate- rials, is reached at the same composition. This coincidence indicates that (i) besides the amount of soft structural defects (Si-O-Ca/Na NBO sites), the formation of a strong continuous Si-O-Si network has a key role on the plastic behavior, and (ii) the HV/E ratio is a good parameter for quantitative characterization of the network structure through the -Si-O- Si- chains length in the 1 <N(BO)Si <2 range (up to the theoretical yield strength).
These considerations were applied to describe quantitatively the formation of the altered layers after SBF treatment as a function of the initial glass composition. Bioactive glass samples immersed into SBF showed a reduction of both the E modulus and the HV/E ratio. Quan- titative estimation of the structural evolution during SBF treatment was provided by the HV/E ratio which also serves as an alternative measure of bioactivity of the glasses in the very early stage of the reaction.
Author contributions
Zsolt Kov´acs: Conceptualization; Data curation; Formal analysis;
Investigation; Methodology; Resources; Validation; Visualization;
Roles/Writing - original draft; Writing - review & editing Margit Fig. 6. SEM BSE image intensity profile of the treated samples as a function of
the distance from the surface. The intensity curves were shifted to be equally separated. Dashed lines with signs show position and direction of concentration transients which indicate the boundary of surface layers.
Z. Kov´acs et al.
F´abi´an: Funding acquisition; Project administration; Resources; Writing - review & editing No´emi Szasz: Investigation Inna Sz´ ´ekacs: Resources; ´ Writing - review & editing Viktoria Kov´ acs Kis: Conceptualization; ´ Data curation; Formal analysis; Funding acquisition; Investigation;
Methodology; Project administration; Resources; Validation; Visualiza- tion; Roles/Writing - original draft; Writing - review & editing
Declaration of Competing Interest
The authors declare that they have no known competng fnancial interests or personal relatonships that could have appeared to influence the work reported in this paper.
Acknowledgments
This work was supported by the National Research, Development
and Innovation Fund Office, Hungary, grant number K-125100 and partly by center of Energy Research, Hungarian Academy of Sciences, under the Project ‘‘Investigation of biocompatible glasses for biomedical applications’’ (125/2017 and 109/2018) and the National Research, Development and Innovation Office (NKFIH) grant KKP 129936. Z.K.’s work was completed in the ELTE Institutional Excellence Program (TKP2020-IKA-05) financed by the Hungarian Ministry of Human Ca- pacities. Electron microscopy facility at center for Energy Research was granted by the European Structural and Investment Funds, grant no.
VEKOP-2.3.3–15–2016–0 0 0 02. The authors are grateful to Dr. P´eter Jenei (ELTE) for his help during XRD pattern acquisition.
References
[1] W. Cao, L.L. Hench, Bioactive materials, Ceram. Int. 22 (1996) 493–507, https://
doi.org/10.1016/0272-8842(95)00126-3.
Fig. 7. Average hardness (a) and average Young’s modulus (b) values of the treated and untreated samples as a function of phosphorus content. (c) Average of the Young’s modulus normalized hardness (HV/E) as a function of phosphorus content. (d) Scaling between HV/E and N(BO)Si. (e) Average Si-O chain length calculated from N(BO)Si for the studied compositions (f) Difference between the untreated and the calculated treated N(BO)Si.as a function of P content.
Journal of Non-Crystalline Solids 581 (2022) 121416 [2] L.L. Hench, The story of Bioglass®, J. Mater. Sci. 17 (2006) 967–978, https://doi.
org/10.1007/s10856-006-0432-z.
[3] J.R. Jones, Review of bioactive glass: from Hench to hybrids, Acta Biomater. 9 (2013) 4457–4486, https://doi.org/10.1016/j.actbio.2012.08.023.
[4] A.C. Profeta, C. Huppa, Bioactive glass in oral and maxillofacial surgery, Craniomaxillofac Trauma Reconstr. 9 (2016) 1–14, https://doi.org/10.1055/2Fs- 0035-1551543.
[5] F. Baino, C. Vitale-Brovarone, Three-dimensional glass-derived scaffolds for bone tissue engineering: current trends and forecasts for the future, J. Biomed. Mater.
Res. A 97 (2011) 514–535, https://doi.org/10.1002/jbm.a.33072.
[6] S.S. Danewalia, K. Singh, Bioactive glasses and glass–ceramics for hyperthermia treatment of cancer: state-of-art, challenges, and future perspectives, Mater. Today Bio. 10 (2021), 100100, https://doi.org/10.1016/j.mtbio.2021.100100.
[7] E. Wang, X. Li, Y. Zhang, L. Ma, Q. Xu, Y. Yue, W. Wang, Q. Li, J. Yu, Y. Chang, Multi-Functional Black Bioactive Glasses Prepared via Containerless Melting Process for Tumor Therapy and Tissue Regeneration, Adv. Funct. Mater (2021), 2101505, https://doi.org/10.1002/adfm.202101505.
[8] A.K. Solanki, F.V. Lali, H. Autefage, S. Agarwal, A. Nommeots-Nomm, A.
D. Metcalfe, M.M. Stevens, J.R. Jones, Bioactive glasses and electrospun composites that release cobalt to stimulate the HIF pathway for wound healing applications, Biomater. Res. 25 (2021) 1, https://doi.org/10.1186/s40824-020- 00202-6.
[9] J.N. Oliver, Y. Su, X. Lu, P. Kuo, J. Du, D. Zhu, Bioactive glass coatings on metallic implants for biomedical applications, Bioactive Mater. 4 (2019) 261–270.
[10] T. Kokubo, H. Takadama, How useful is SBF in predicting in vivo bone bioactivity?
Biomaterials 27 (2006) 2907–2915, https://doi.org/10.1016/j.
biomaterials.2006.01.017.
[11] M. Bohner, J. Lemaitre, Can bioactivity be tested in vitro with SBF solution?
Biomaterials 30 (2009) 2175–2179, https://doi.org/10.1016/j.
biomaterials.2009.01.008.
[12] L. Hupa, K.H. Karlsson, M. Hupa, H.T. Aro, Comparison of bioactive glasses in vitro and in vivo, Eur. J. Glass Sci. Technol. A 51 (2010) 89–92.
[13] O.H. Andersson, K.H. Karlsson, K. Kangasniemi, Calcium phosphate formation at the surface of bioactive glass in vivo, J. Non-Cryst. Solids 119 (1990) 290–296, https://doi.org/10.1016/0022-3093(90)90301-2.
[14] L.L. Hench, Bioceramics – from concept to clinic, J. Am. Ceram. Soc. 74 (1991) 1487–1510, https://doi.org/10.1111/j.1151-2916.1991.tb07132.x.
[15] C. Ohtsuki, T. Kokubo, T. Yammamuro, Mechanism of apatite formation on CaO- SiO2-P2O5 glasses in a simulated body fluid, J. Non-Cryst. Solids 143 (1992) 84–92, https://doi.org/10.1016/S0022-3093(05)80556-3.
[16] I. Rehman, L.L. Hench, W. Bonfield, R. Smith, Analysis of surface layers on bioactive glasses, Biomaterials 15 (1994) 865–870, https://doi.org/10.1016/0142- 9612(94)90044-2.
[17] J.M. Stevels, Neue Erkenntnisseüber die Struktur des Glases, Philips Techn.
Rundsch 9/10 (1960) 337–349.
[18] Z. Strnad, Role of the glass phase in bioactive glass-ceramics, Biomaterials 13 (1992) 317–321, https://doi.org/10.1016/0142-9612(92)90056-T.
[19] R. Hill, An alternative view of the degradation of bioglass, J. Mater. Sci. Lett. 15 (1996) 1122–1125, https://doi.org/10.1007/BF00539955.
[20] M.W.G. Lockyer, D. Holland, R. Dupree, NMR investigation of the structure of some bioactive and related glasses, J. NonCryst. Solids 188 (1995) 207–219, https://doi.
org/10.1016/0022-3093(95)00188-3.
[21] V. FitzGerald, D.M. Pickup, D. Greenspan, D.G. Sarkar, J.J. Fitzgerald, K.
M. Wetherall, R.M. Moss, J.R. Jones, R.J. Newport, A neutron and X-ray diffraction study of Bioglass with Reverse Monte Carlo modelling, Adv. Funct. Mater. 17 (2007) 3746–3753, https://doi.org/10.1002/adfm.200700433.
[22] F. Fayon, D.C. Due, T. Poumeyrol, M. Allix, D. Massiot, Evidence of nanometric- sized phosphate clusters in bioactive glasses as revealed by solid-state 31 P NMR, J. Phys. Chem. C 117 (2013) 2283, https://doi.org/10.1021/jp312263j. –228.
[23] R. Mathew, C. Turdean-Ionescu, B. Stevensson, I. Izquierdo-Barba, A. Garcia, D. Arcos, M. Vallet-Regi, M. Eden, Direct probing of the phosphate-ion distribution in bioactive silicate glasses by solid-state NMR: evidence for transitions between random/clustered scenarios, Chem. Mater. 25 (2013) 1877–1885, https://doi.org/
10.1021/cm400487a.
[24] V. Petkov, S.J.L. Billinge, S. Shastri, B. Himmel, Polyhedral units and network connectivity in calcium aluminosilicate glasses from high-energy X-ray diffraction, Phys. Rev. Lett. 85 (2000) 3436–3439, https://doi.org/10.1103/
PhysRevLett.85.3436.
[25] A. Tilocca, N.A. Cormack, N.H. Leeuw, The structure of bioactive silicate glasses:
new insight from molecular dynamics simulations, Chem. Mater. 19 (2007) 95–103, https://doi.org/10.1021/cm061631g.
[26] M. Eden, The split network analysis for exploring composition-structure correlations in multi-component glasses: I. Rationalizing bioactivity-composition trends of bioglasses, J. Non-Cryst. Solids 357 (2011) 1595–1602, https://doi.org/
10.1016/j.jnoncrysol.2010.11.098.
[27] I. Lebecq, F. D´esanglois, A. Leriche, C. Follet-Houttemane, Compositional dependence on the in vitro bioactivity of invert or conventional bioglasses in the Si-Ca-Na-P system, J. Biomed. Mater. Res. A 83 (2007) 156–168, https://doi.org/
10.1002/jbm.a.31228.
[28] W.A. Lanford, K. Davis, P. Lamarche, T. Laursen, R. Groleau, R.H. Doremus, Hydration of soda-lime glass, J. NonCryst. Solids 33 (1979) 249–266, https://doi.
org/10.1016/0022-3093(79)90053-X.
[29] G.N. Greaves, K.L. Ngai, Reconciling ionic-transport properties with atomic structure in oxide glasses, Phys. Rev. B 52 (1995) 6358–6380, https://doi.org/
10.1103/PhysRevB.52.6358.
[30] A.C. Silva, Structure and percolation of bioglasses, in: J. Marchi (Ed.), Biocompatible Glasses, from Bone Regeneration to Cancer Treatment, Springer, New York, 2016, pp. 49–84.
[31] M.D. O’Donnell, S.J. Watts, R.V. Law, R.G. Hill, Effect of P2O5 content in two series of soda lime phosphosilicate glasses on structure and properties–part I: NMR, J. NonCryst. Solids 354 (2008) 3554–3560, https://doi.org/10.1016/j.
jnoncrysol.2008.03.034.
[32] R. Mathew, B. Stevensson, A. Tilocca, M. Eden, Towards a rational design of bioactive glasses with optimal structural features: composition-structure correlations unveiled by solid-state NMR and MD simulations, J. Phys. Chem. B 118 (2014) 833–844, https://doi.org/10.1021/jp409652k.
[33] Y. Yu, R. Mathew, M. Eden, Quantitative composition–bioactivity relationships of phosphosilicate glasses: bearings from the phosphorus content and network polymerization, J. NonCryst. Solids 502 (2018) 106–117, https://doi.org/
10.1016/j.jnoncrysol.2018.07.060.
[34] X. Chen, D.S. Brauer, R.M. Wilson, R.V. Law, R.G. Hill, N. Karpukhina, Sodium is not essential for high bioactivity of glasses, Int. J. Appl. Glass Sci. 8 (2017) 428–437, https://doi.org/10.1111/ijag.12323.
[35] P.N. Gunawidjaja, I. Izquierdo-Barba, R. Mathew, K. Jansson, A. Garcia, J. Grins, D. Arcos, M. Vallet-Regi, M. Eden, Quantifying apatite formation and cation leaching from mesoporous bioactive glasses in vitro: a SEM, solid-state NMR and powder XRD study, J. Mater. Chem. 22 (2012) 7214–7223, https://doi.org/
10.1039/C2JM15066B.
[36] C. Turdean-Ionescu, B. Stevensson, J. Grins, I. Izquierdo-Barba, A. Garcia, D. Arcos, M. Vallet-Regi, M. Eden, Composition-dependent in vitro apatite formation at mesoporous bioactive glass-surfaces quantified by solid-state NMR and powder XRD, RSC Adv. 5 (2015) 86061–86071, https://doi.org/10.1039/C5RA13410B.
[37] H.X. Guo, B.T. Lu, J.L. Luo, Response of surface mechanical properties to electrochemical dissolution determined by in situ nanoindentation technique, Electrochem. Comm. 8 (2006) 1092–1098, https://doi.org/10.1016/j.
elecom.2006.04.020.
[38] C. Calahoo, X. Zhang, J.W. Zwanziger, Nanoindentation study of the surface of ion- exchanged lithium silicate glass, J. Phys. Chem. C 120 (2016) 5585–5598, https://
doi.org/10.1021/acs.jpcc.6b00733.
[39] D.R. Tadjiev, R.J. Hand, S.A. Hayes, Calibrating a nanoindenter for very shallow depth indentation using equivalent contact radius, Philos. Mag. 90 (2010) 1819–1832, https://doi.org/10.1080/14786430903571420.
[40] M. Finke, J.A. Hughes, D.M. Parker, K.D. Jandt, Mechanical properties of in situ demineralised human enamel measured by AFM nanoindentation, Surf. Sci. 491 (2001) 456–467, https://doi.org/10.1016/S0039-6028(01)01311-5.
[41] M.E. Barbour, D.M. Parker, G.C. Allen, K.D. Jandt, Human enamel dissolution in citric acid as a function of pH in the range 2.30<pH <6.30—A nanoindentation study, Eur. J. Oral Sci. 111 (2003) 258–262, https://doi.org/10.1034/j.1600- 0722.2003.00039.x.
[42] M.E. Barbour, R.P. Shellis, An investigation using atomic force microscopy nanoindentation of dental enamel demineralization as a function of undissociated acid concentration and differential buffer capacity, Phys. Med. Biol. 52 (2007) 899–910, https://doi.org/10.1088/0031-9155/52/4/003.
[43] F. Lippert, D.M. Parker, K.D. Jandt, In vitro demineralization and remineralization cycles at human tooth enamel surfaces investigated by AFM and nanoindentation, J. Colloid Interface Sci. 280 (2004) 442–448, https://doi.org/10.1016/j.
jcis.2004.08.016.
[44] J.A. Arsecularatne, M. Hoffman, An in vitro study of the microstructure, composition and nanoindentation mechanical properties of remineralizing human dental enamel, J. Phys. D Appl. Phys. 47 (2014), 315403, https://doi.org/10.1088/
0022-3727/47/31/315403.
[45] M. F´abian, Zs. Kov´acs, J.L. L´ab´ar, A. Sulyok, Z.E. Horv´ath, I. Sz´ek´acs, V.K. Kis, Network structure and thermal properties of bioactive (SiO2–CaO–Na2O–P2O5) glasses, J. Mater. Sci. 55 (2020) 2303–2320, https://doi.org/10.1007/s10853-019- 04206-z.
[46] W.C. Oliver, G.M. Pharr, Measurement of hardness and elastic modulus by instrumentated indentation: advances in understanding and refinements to methodology, J. Mater. Res. 19 (2004) 3–20, https://doi.org/10.1557/
jmr.2004.19.1.3.
[47] R.J. Newport, V. FitzGerald, D.M. Pickup, D. Greenspan, K.M. Wetherall, R.
M. Moss, J.R. Jones, An atomic scale comparison of the reaction of Bioglass® in two types of simulated body fluid, Phys. Chem. Glasses B 50 (2009) 137–143.
[48] M. Schumacher, P. Habibovic, S. van Rijt, Mesoporous bioactive glass composition effects on degradation and bioactivity, Bioactive Mater. 6 (2021) 1921–1931, https://doi.org/10.1016/j.bioactmat.2020.12.007.
[49] M.F. Ashby, A.L. Greer, Metallic glasses as structural materials, Scripta Mater. 54 (2009) 321–326, https://doi.org/10.1016/j.scriptamat.2005.09.051.
[50] J.H. Gibbs, E.A. DiMarzio, Nature of the glass transition and the glassy state, J. Chem. Phys. 28 (1958) 373–383, https://doi.org/10.1063/1.1744141.
Z. Kov´acs et al.