Applied Surface Science 573 (2022) 151543
Available online 14 October 2021
0169-4332/© 2021 The Authors. Published by Elsevier B.V. This is an open access article under the CC BY license (http://creativecommons.org/licenses/by/4.0/).
Contents lists available atScienceDirect
Applied Surface Science
journal homepage:www.elsevier.com/locate/apsusc
Full length article
Concordant element of the oxidation kinetics—Interpretation of ellipsometric measurements on Zr
Alekszej Romanenko
a,b, Emil Agócs
b, Zoltán Hózer
b, Peter Petrik
b,∗, Miklós Serényi
baDoctoral School of Chemistry, Eötvös Loránd University, Pázmány Péter sétány 1/A, H-1117 Budapest, Hungary
bCentre for Energy Research, Konkoly-Thege Rd. 29-33, 1121 Budapest, Hungary
A R T I C L E I N F O
Keywords:
Oxidation Ellingham Parabolic rate Zirconium Ellipsometry
A B S T R A C T
In this study we report on the growth of ZrO2films upon the gradual thermal annealing of Zr in the temperature range of 500–700 K. The thickness of the oxide was monitored by in-situ spectroscopic ellipsometry with temporal and thickness resolutions of a few seconds and a few nanometers, respectively. A remarkable feature of the process was that the growth of the oxide can be terminated immediately when decreasing the temperature by a few K. This suggests that, in addition to the driving force, a built-in control adjusts the final thickness determined only by the temperature in sync with the formation and growth of dense oxide films.
The derived phenomenological model includes the concept of a ‘depletion layer’ known from semiconductor physics. The validity of the model and the pressure dependence of oxidation is discussed.
1. Introduction
The first of oxide growth models originate from Wagner’s assump- tion that metal oxidation takes place by diffusion of charged particles and is valid for thick film growth (𝑥 >1 μm) at high temperatures [1].
By raising a linear diffusion equation, which incorporates the electric field across semiconducting passive oxides, Wagner found that the film growth is parabolic [2]. Cabrera and Mott developed another approach where an electric field (Mott potential) controls the diffusion of ionic point defects necessary for oxidation [3]. They suggested in 1949 that thin film growth was directly dependent on the migration of interstitial cations where the rate limiting step is cation injection at the metal/film interface. Cabrera and Mott’s solution for thin film growth at low temperatures has an inverse logarithmic law of growth.
Afterwards, the oxidation kinetics of Cu thin films in the temperature range of 100–300◦C for film thicknesses between 20 and 150 nm was investigated and found to follow a linear rate law, which indicates that the oxidation process is surface reaction controlled [4]. The oxidation of thin films of other metals, e.g. Ni, Cr, Co, Al, and Si, typically exhibit a parabolic growth rate for similar oxidation conditions, characteristic for a diffusion-controlled oxidation process [5]. There have been nu- merous studies conducted on Zr [6–8]. In many cases, these resulted in the determination of material parameters, such as the diffusion coefficient [9–11].
∗ Corresponding author.
E-mail addresses: alekszej@list.ru(A. Romanenko),agocsemil@gmail.com(E. Agócs),hozer.zoltan@ek-cer.hu(Z. Hózer),petrik.peter@energia.mta.hu (P. Petrik),serenyi.miklos@energia.mta.hu(M. Serényi).
URL: https://www.ellipsometry.hu/(P. Petrik).
Most studies deal with either the initial [12–14] or final [11,15]
stages of the Zr oxidation. The initial stage of oxidation starting from a clean crystalline surface in ultra-high vacuum studied by a combination of in-situ spectroscopic ellipsometry (SE) and X-ray photoelectron spec- troscopy (XPS) is a well-defined and well-controlled process that allows the in-depth understanding of the growth of the first few nanome- ters [4,16–18]. The final stage [11] that leads to the peel-off [19] of the layer has a significance for material degradation in the nuclear power plant technology. The different stages of Zr oxidation have phenomeno- logically been characterized by subsequent linear [12], parabolic [11]
and cubic phases terminated by a final linear phase [9] that may lead to breakaway [19–21], depending on the alloy composition [11,15]. The pioneers of Zr oxidation have been followed by many investigations dominated by gravimetry [8,11,19] for the characterization of the amount of growing oxide in the thickness range from a few micrometers to hundreds of micrometers [10].
There were only a few studies, including our group [22,23] that have dealt with the optical thickness measurements of the oxide, but they mainly used ex-situ characterizations on thin films [24], with some exceptions including measurements during electrochemistry [25,26].
Furthermore, all the above studies are on thicknesses up to a few nanometers, or in the micrometer range. The range between a few nanometers and a few hundred nanometers is unexplored, especially using in-situ optical characterization. Ex-situ optical investigations are
https://doi.org/10.1016/j.apsusc.2021.151543
Received 13 August 2021; Received in revised form 24 September 2021; Accepted 5 October 2021
including nuclear technology [19] and microelectronics [32].
2. Material and methods 2.1. Sample preparation
Zr plates in sizes of approximately 20 mm by 10 mm made of an E125 alloy (2.45% Nb, 0.035% Fe and 0.069% O [33]) have been prepared. The samples have been polished with diamond paste to such an extent that only a few nanometers of residual oxide was observed by ellipsometric spectra.
2.2. Annealing
The Zr samples were annealed in an isolated quartz tube shown in Fig. 1A. Argon and Ar/O2gas mixtures with O2 partial pressures of 0, 1.25, 5 and 20% were flowed at atmospheric pressure. A ceramic plate is mounted in the tube so that the surface of the samples placed on the ceramic plate coincides with the axis of the tube. This configuration enables the ellipsometry measurement to be performed at any angles of incidence that is allowed by the equipment (45–90◦). The heat cell was placed at the stage of the ellipsometer. The standard alignment proce- dure can be performed also through the tube that makes an automatic sample alignment possible. The measurement spot was focused to make sure that the beam enters the tube perpendicular to its surface over the whole spot which has a diameter of approximately 3 mm outside of the tube, and a spot of approximately 0.3 mm×1.0 mm on the surface of the sample.
The plate can be heated up to 873 K. The precision of the tempera- ture control is approximately 0.1 K. In this experiments the temperature was increased at a rate of 10 K/min and it was kept at given tem- peratures until a nearly saturated thickness was reached. Then the temperature regulator was turned off for 30 s to drop the heat level.
By doing so the growth of the oxide layer immediately stops. These extra steps were added to support our assumptions about the kinetics of layer growth. After that a new ramp up was started to the next temperature. The thickness was determined by ellipsometry in real-time during annealing, to have a precise control of the annealing times.
2.3. Measurement
The optical measurements were made by a Woollam M-2000DI rotating compensator spectroscopic ellipsometer at the angle of inci- dence of 70◦with temporal resolutions of a few seconds and thickness resolution under 1 nm.𝛹 and𝛥spectra were recorded and evaluated real-time in every 10 s during annealing, where the complex reflection coefficient is𝜌=|tan𝛹|exp(𝑖𝛥). Typical spectra measured on a sample oxidized at 700 K is shown inFig. 1(B). Multiple-angle measurements were made before annealing to help building a precise optical model used during the real-time investigations. The measurement through the tube makes no aberration of the SE spectra, which was verified by the characterization of thermal oxide-covered reference Si wafers.
The 10 s cycle of data acquisition was selected to be large enough to decrease noise, but small enough to precisely follow the changes during measurement.
in equilibrium, and under a certain time the reaction provides the final product (ZrO2). However, because the anions move to the metal surface and take part in the reaction, they leave a positively charged region behind. This process continues until the region has an electrical charge large enough to repulse the cations to enter the vicinity of the oxide-metal interface. Eventually, a state of equilibrium will occur producing a ‘‘potential barrier’’ zone. Since no free anion can rest in a potential barrier zone, the region becomes completely depleted, and the oxidation process is stopped. This area is called the ‘‘depletion layer’’
known from semiconductor physics, and the thickness (𝑤) of the layer is proportional to the square of the potential [34].
Based on the above considerations, several sufficient assumptions should be made to create a reasonable model: (i) No diffusion of cations and electrons in the oxide film are considered. (ii) The diffusion of atomic oxygen in the oxide film happens via the vacancy and interstitial mechanism. (iii) Dissociation and ionization mechanism of oxygen molecules is not involved. (iv) The existence of a few nm oxide layer is assumed, i.e., the oxide growth is considered to be in the form of an additional layer.
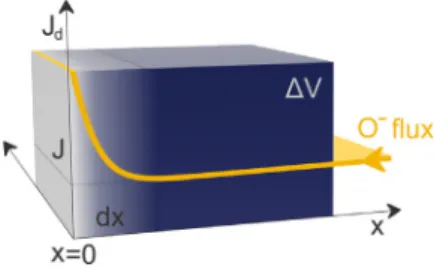
In the initial equations, we take into account two observations by ellipsometry. First, the growth process can be stopped by reducing the temperature by a few degrees. This condition appears to be stable according to the observations. It means that a given flux (𝐽) delivering O-at a concentration of𝑐can provide anions in a quantity sufficient to develop (presumably stoichiometric) oxide in a volume of𝛥𝑉 during the time 𝜏. This flux penetrates the previously formed oxide with practically no modification of the layer. Therefore, the dependence on the oxide thickness at the O-inflow side (𝑥,Fig. 2) does not need to be assumed. If the flux𝐽 (in units of mol/(nm2s)) enters the cross section of𝐴during a time period of𝜏, the following equation holds:
𝜏𝐽 𝐴=𝑐 𝛥𝑉 , (1)
where𝛥𝑉denotes the volume. During the oxidation process ZrO2forms with a reaction rate coefficient of𝑘𝑒𝑥𝑝detected during the experiment, and an oxygen concentration of𝑐0 = 9.13⋅10−19 mol/nm3. At this point, we can assume that the reaction proceeds according to the law of Arrhenius. Consequently, it has the form of𝑘𝑒𝑥𝑝=𝑘0exp(−𝐸𝑎∕(kB𝑇)).
Here, kBand𝐸𝑎denote Boltzmann’s constant and the activation energy of the process, respectively, and 𝑘𝑒𝑥𝑝 can be determined from the experiment:
𝜏𝑘𝑒𝑥𝑝=𝑐0𝛥𝑉 . (2)
Combining the two equations the flux takes the temperature dependent form of
𝐽=𝐽0exp (
− 𝐸𝑎 kB𝑇
)
(3) with
𝐽0=𝑘0 𝐴⋅ 𝑐
𝑐0. (4)
The second observation from the heat treatment experiment is that the thickening of the oxide continues at a new, higher temperature.
Thus, the oxide layer can be constructed gradually from practically microscopically thin layers. We can suppose that there must be a sudden change in the oxide concentration at the metal oxide transition.
Fig. 1. (A) The heat cell constructed for multiple-angle SE measurements in controlled ambient and temperature. (B) Typical measured (solid lines) and fitted (dashed lines) SE spectra on the sample oxidized at 700 K for 18000 s. The inset shows the optical model used for the evaluation of the SE spectra. The different components of the EMA layer were determined from different stages of the oxidation: the initial native zirconium oxide (yellow), a B-spline-3 fitted after the third heat-step 618 K (light blue) and a B-Spline-4 fitted after the fourth-final 700 K step (dark blue).
Fig. 2. Schematic diagram of the kinetic model. The yellow curve shows the anion flux (𝐽𝑑) as a function of depth. The𝑥= 0position corresponds to the interface between the oxide and the substrate.
According to Fick’s first law, the flux is proportional to the negative of the concentration gradient at each point; this results practically in a singular value of the anion flux. We specify an identical area, 𝐴, on each plane of𝑑𝑥inFig. 2, and we can calculate the number of oxygen atoms that are added to the volume between the two planes during an increment of time, d𝑡:
(𝐽𝑑−𝐽)𝐴d𝑡=𝑐0𝐴d𝑥. (5)
Here,𝐽𝑑 is considered to be the charge carrier transport, analogous to that used in calculations for semiconductors. It depends on the mobility (𝜇) and the electric field (𝐸):
𝐽𝑑=𝑐0𝑣𝑑=𝑐0𝜇𝐸, (6)
where the velocity of the anions is𝑣𝑑=𝜇𝐸.
𝐸(𝑥)can be determined in a way similar to the physics of semi- conductor p–n junctions (using the Boltzmann limit instead of the Bose–Einstein statistics), assuming 𝑐(𝑥) = c0𝑥∕𝑤 at the metal-oxide interface. In order to determine𝐽𝑑(𝑥), we are searching for𝐸(𝑥), which can be expressed as a function of the potential (𝑈):
𝐸= −𝑒𝜕𝑈
𝜕𝑥, (7)
where𝑒denotes the elementary charge. Recalling the laws of statistical mechanics, we can write the concentration of oxygen anions near the 𝑥= 0transition:
𝑐(𝑥) c0 =exp
(
−𝑒𝑈 kB𝑇
)
, (8)
𝑈(𝑥)can be expressed as
−𝑒𝑈=kB𝑇ln (𝑐(𝑥)
c0 )
, (9)
the derivative of which is 𝑒𝜕𝑈
𝜕𝑥 = −kB𝑇
𝑥 . (10)
Substituting𝐸= −𝑒𝜕𝑈∕𝜕𝑥into Eq.(6),𝐽𝑑can be expressed as 𝐽𝑑=c0𝜇𝐸=c0𝜇kB𝑇
𝑥 = c0𝐷 𝑥 = 𝐿
𝑥. (11)
In this formalism𝑣𝑑 = 𝜇kB𝑇∕𝑥is the drift velocity, and𝐷 = 𝜇kB𝑇 is the Stokes–Einstein formula for the Brownian motion. Also note that kB𝑇∕𝑥is the force (in N) applied to the anions by the electric field. The mobility (𝜇), which is the inverse of the friction constant, is related to the fluctuation of the velocity of the Brownian motion, being a manifestation of the fluctuation–dissipation theorem [35]. The mobility (𝜇) in the diffusion coefficient (𝐷) is a function of the temperature, and here interstitial diffusion can also be taken into account if we arbitrarily supplement it with the usual exponential formula:
𝐿=c0𝜇kB𝑇exp (
−𝐸𝑑 kB𝑇
)
. (12)
Substituting the results into Eq.(4), taking into account the direction of flow regarding the coordinate system ofFig. 2:
𝐿
𝑥−𝐽 =𝐾d𝑥
d𝑡. (13)
Here, instead of concentration c0, we introduce a parameter 𝐾, suggesting that in general cases it may be a nonstoichiometry value.
The integration of Eq.(13)from 0 to t results in 𝑡= −𝑥𝐾
𝐽 −𝐿𝐾 𝐽2 ln(
1 −𝑥𝐽 𝐿 )
. (14)
Eq.(14)describing the time dependence of oxide growth contains an important statement; the numerous of the logarithm function can only be interpreted in the range0and𝑥= 𝐿
𝐽, which means that the layer thickness approaches a𝛿value at a given temperature, where 𝛿= 𝐿
𝐽. (15)
Also the Eq.(14)can be simplified using a series expansion at𝑥≃ 0as follows:
𝑡= 𝐾
2𝐿𝑥2, (16)
4. Results
4.1. Model of the optical measurements
To build proper SE models, the experience and result from previous investigations [22,23] were utilized. The choice was settled on a one- layer model, which was used with an effective medium approximation (EMA) model for the surface layer, whereas the substrate was described by Lorentz oscillators. In the EMA layer the dielectric function of the surface layer (parameterized by the B-Spline model [36,37]) at different stages of the oxidation were mixed: the initial native oxide, a B-spline-3 fitted after the third 618 K heat-step and a B-Spline-4 fitted after the fourth-final 700 K step, as shown inFigs. 1(B) and3.
The kinetic curves ofFigs. 4and5described by Eq.(14)were fitted using Eq.(15)and the following substitution:
𝐾
𝐽 =𝛼, (17)
Using this notations, Eq.(13)takes the normalized form of 𝛿
𝑥− 1 =𝛼d𝑥
d𝑡. (18)
The Eq.(18) expresses that the oxide stops growing at the thickness of𝑥=𝛿. The𝛼parameter illustrates the reciprocal of the growth rate of the oxide layer. The value of this and the 𝛿thickness can be well matched in the range of 300–600 K based on the measurement results:
𝛼= 16.4exp (0.96
kB [1
𝑇 −1 𝜃
])
(19) in unit of s/nm, where𝜃= 666K is included in the formula to remind us of the range of validity of the formula,
𝛿= 0.47𝑇 exp (−0.47
kB [1
𝑇 −1 𝜃
])
(20) in unit of nm.
The oxidation process described by the equation takes place under extremely strictly defined conditions. It should first be mentioned that the variable𝑥in the equation is only interpreted at positive values. It ignores the processes (thus diffusion of metal ions) within the metal surface. All this is consistent with the fact that our goal in this study is to demonstrate the interpretation of the data measured by ellipsometry.
Second, we emphasize that the equation describes the process such that each O-anion incorporates into the solid oxide. This incorporation takes place only at the metal oxide interface (𝑥= 0). The fact that there is always enough oxygen in atomic form is due to the thermodynamic description of the equilibrium of metal oxidation. The model assumes that the growth rate determined and measured by the reaction constant 𝑘𝑒𝑥𝑝 receives sufficient replenishment from the flux 𝐽. If the drift velocity𝑣𝑑is less than the growth rate, the growth of the oxide layer will be stopped. This experiment proves that with a small decrease in temperature, the growth breaks off immediately.
5. Discussion
The in-situ measurement demonstrated that the observed relation of the oxide growth agrees well with our formulas in the temperature range of 300–600 K. Measurements taken up to 600 K can be fitted in an acceptable accuracy, but the form of the growth profile recorded at 700 K is surprisingly different from the others. We are not aware of such a rapid, phase-transition-like change within a given system, so we try to provide the explanation with the model itself. To do this, we first interpret the flux𝐽 as follows. By substituting𝑥=𝛿∕2into Eq.(18)we obtain
1 =𝛼d𝑥
d𝑡, (21)
or using Eq.(17) 𝐽0exp
(−𝐸𝑎 kB𝑇 )
=𝐾d𝑥
d𝑡. (22)
oxide layer. Thus, the incoming flux demands𝐽 of the oxidation at temperature𝑇 reaching a thickness of𝑥=𝛿∕2an essential feature of the process.
Furthermore, consider how much flux𝐽𝑜𝑥produces depending on the partial pressure of oxygen in the environment. Under our conditions of temperature and pressure, oxygen behaves qualitatively like an ideal gas, thus a very rough estimation can be made of the particle flux𝐽𝑜𝑥 reaching the surface of the oxide boundary is
𝐽𝑜𝑥= 𝑝 2√
3kB𝑇 𝑚0
, (23)
where𝑝denotes the partial pressure in Pascal and 𝑚0 stands for the mass of oxygen atoms (no dissociation was considered). It can be seen from the table that at normal pressure and low temperature the number of available oxygen atoms exceeds𝐽, which determines the oxidation process. The oxygen demand of the system can be characterized by a pressure value𝑝∗. This is determined from the equality of𝐽 and𝐾 disregarding all kinds of dissociation efficiencies and diffusion losses:
𝐽0 exp (−𝐸𝑎
kB𝑇 )
= 𝑝∗ 2√
3kB𝑇 𝑚0
, (24)
It can be seen that as the temperature increases, the number of avail- able oxygen atoms decreases. In contrast, the flux demand𝐽 required for oxidation increases exponentially. At least a thousand times𝑝∗is required to run the oxidation kinetics accordingly to the models. This is the estimated value to satisfy the singular oxygen demand at the beginning of the oxidation process. If this is not fulfilled, the growth profile describing the oxidation process will be distorted.
In the case where not enough anions are available, the value of 𝐽𝑑 could not increase many times of 𝐽. It can be assumed that non- stoichiometric oxide can grow in the anion-deficient section; Eq.(13) remains valid if𝐾 < 𝑐0. We can also make a rough estimation that the value of𝐾increases linearly over a period of𝛿∕𝑛(𝑛= 2,3 …) growth until it reaches the value of𝑐0. Substituting in Eq.(3), we get a third degree expression at𝑥≈ 0:
𝐿
𝑥−𝐽 =𝑐0 𝑥 𝛿∕𝑛
d𝑥
d𝑡. (25)
Integrating and returning to the normalized from of Eq.(18):
𝑡(3)=𝑡(2)−𝛼𝑛 𝛿𝑥2+3
2𝛼𝑛𝛿, 0< 𝑥 <𝛿
𝑛. (26)
Approaching at𝑥≈ 0:
𝑡(3)=𝑛 3 𝛼
𝛿2𝑥3. (27)
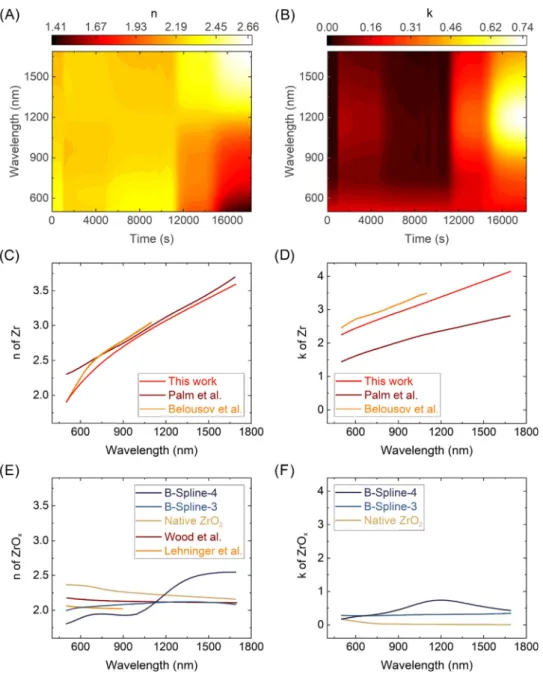
This cubic dependence (𝑡(2)and𝑡(3)denote parabolic (Eq.(16)) and cubic dependences, respectively) appears in the initial stage of heat treatment at 700 K. When the growth reaches a stage such that𝐽 < 𝐽𝑜𝑥, a stoichiometric layer grows according to Eq. (14). All this can be observed by the refractive index values (Figs. 5and6). It seems to be proven that if the heat treatment persists for the time predictable as𝛼𝛿, in the second half of the annealing process the excess oxygen could be involved in the oxidation of the zirconium excess in the non- stoichiometric range. For the heat treatment at 700 K, Eq.(27) can be fitted by choosing 𝑛 ≈ 500. This means that the thickness of the transient layer is approximately 1 nm — thus, the change from Zr to
Fig. 3. Refractive index,𝑛, (A) and extinction coefficient,𝑘, (B) (spectra plotted along the vertical axes) as a function of time during the oxidation.𝑛and𝑘spectra of the substrate (Zr, (C) and (D)) and the layer (ZrO2, (E) and (F)) measured in frame of this study, together with a few relevant references from the literature [32,38–40].
Fig. 4. Steps of thickness increase as a function of time under the influence of the increasing temperature values.
fully stoichiometric dioxide is rather abrupt. Our approximation seems to be absurd, but by treating the equations numerically we could get a more realistic value. On the other hand, Eq.(26)describing the final stage of the heat treatment process can be fitted with𝑛≈ 0.15, which can be considered as𝑡(2)=𝑡(3) identity — no transient layer is present.
This is not the only pressure-dependent effect that can affect the oxidation process. The pressure- and temperature-dependence can be analyzed by considering the standard free energy (𝛥𝐺) with a term corresponding to the so-called activity given in Ref. [43].
Fig. 5. (A) Optical models at different stages (1–4) of the oxidation process. (B) Photographs of≈2 cm×2 cm E125 alloy samples to demonstrate the change of color due to the different thicknesses of the oxides grown at various oxygen/argon ratios [23]. (C–F) Time versus thickness for different O2concentrations at different temperatures, determined from the optical model shown in (A). The solid dark-gray lines show the curves fitted using Eq.(14). In case of 700 K Eq.(26)was used instead.
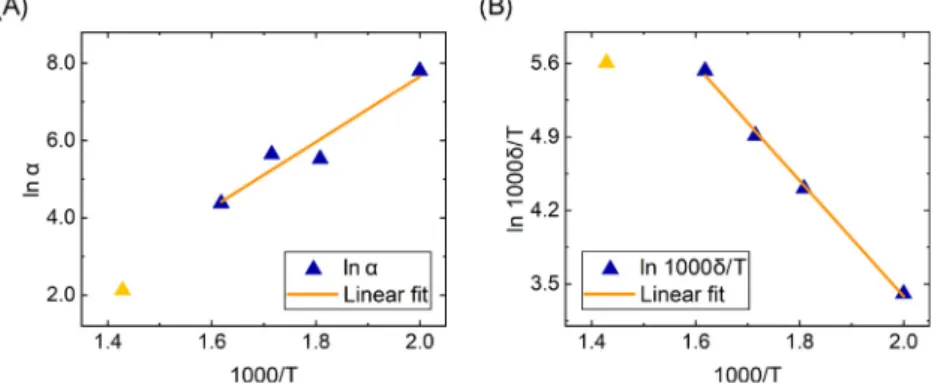
Fig. 6. Arrhenius plots of𝛼(A) and𝛿∕𝑇 (B). The yellow triangles belong to the temperature of 700 K, which is already outside of the defined 666 K upper limit defined, it can be seen that they do not fit well on the fitted lines.
The condition of chemical equilibrium is that the sum of the chem- ical potentials weighted by stoichiometric coefficients is zero. The oxygen pressure at which the oxidation starts can be calculated or used from the work of Ref. [44]. Based on the Ellingham diagram, about 𝑝= 10−86bar for𝑝was estimated at𝑇= 600K.
The validity of the proposed model decreases with increasing thick- nesses due to the vertical inhomogeneity of the oxide layer and the fluctuations in𝜇(the region of increasing deviation of the experimental and fitted curves in Fig. 5). Here, both the optical and the kinetic models have to be changed, possibly involving numerical methods. In
this region 𝜇 is not a single value anymore, but a spectrum and a function of the depth.
6. Conclusions
A simple phenomenological model was developed that attempts to relate the parameters of the transport properties of the atomic oxygen (anions) to the results of kinetics measured by ellipsometry in a thickness range (from a few nanometers to a few hundred nanometers) that has not yet been studied in detail. We have shown that the kinetic behavior can fenomenologically be described by the approach used for the analysis of p–n junctions in semiconductor physics. The equations postulate that the oxide thickness approaches a value determined by temperature. The resulting oxide is stoichiometric when the growth occurs in an oxygen-rich environment. Stoichiometry is temporarily impaired in an oxygen-deficient environment, but if the heat treatment time is long enough for𝛼⋅𝛿, it becomes complete by the excess oxygen present in the final stage of the process. The driving force introduced into our phenomenological model based on ellipsometric measurements determines the kinetics of growth in a consistent and concordant way.
CRediT authorship contribution statement
Alekszej Romanenko:Data curation, Formal analysis, Investiga- tion, Visualization, Review editing.Emil Agócs:Data curation, Formal analysis, Investigation, Software. Zoltán Hózer: Conceptualization, Methodology, Review editing. Peter Petrik: Conceptualization, Data curation, Formal analysis, Funding acquisition, Investigation, Method- ology, Writing of original draft, Review editing, Supervision. Miklós Serényi:Conceptualization, Formal analysis, Methodology, Writing of original draft, Review editing.
Declaration of competing interest
The authors declare that they have no known competing finan- cial interests or personal relationships that could have appeared to influence the work reported in this paper.
Acknowledgments
Support from National Development Agency, Hungary grants of OTKA K131515 and 2019-2.1.11-TET-2019-00004 is gratefully ac- knowledged. Fruitful discussions with C. Frigeri and R. Schiller are greatly acknowledged.
Appendix A. Constants used in the calculations
•kB= 8.62⋅10−5eV/K, Boltzmann constant;
•𝑐0= 9.13⋅10−19mol/nm3, O−concentration in ZrO2;
•𝐾=𝑐0in units of mol/nm3;
•𝜃= 666K.
Appendix B. Temperature dependence of parameters SeeTable B.1.
•𝜇= 2.07⋅103exp(−1.44
kB
[1
𝑇−1
𝜃
])m/(N⋅s), mobility;
•𝐷 = 𝜇kB𝑇 = 2.86𝑇⋅10−2exp(−1.44
kB
[1
𝑇 −1
𝜃
])nm2/s, diffusion coefficient;
•𝐽= 5.56⋅10−20exp(
−0.96 kB
[1 𝑇 −1
𝜃
])
mol/nm2s;
•𝐿= 2.61𝑇⋅10−20exp(−1.44
kB
[1
𝑇 −1
𝜃
])mol/(nm s K);
•𝛼= K
J = 16.4exp(0.96
kB
[1
𝑇 −1
𝜃
])s/nm;
•𝛿=𝐿
𝐽 = 0.47𝑇exp(−0.48
kB
[1
𝑇−1
𝜃
])nm.
Table B.1
Calculated parameters of the kinetic curves at different temperatures.𝑣driftis provided for𝑥=𝛿∕2.
𝑇(K) 𝑝∗(Pa) 𝛿(nm) 𝑤(nm) 𝐸(V/nm) 𝑣drift(nm/s)
666 2.580 313 11.0 2.9⋅10−3 6.08⋅10−2
618 0.680 156 9.5 2.8⋅10−3 1.65⋅10−2
553 0.076 27 6.2 2.5⋅10−3 1.97⋅10−3
500 0.008 15 5.0 2.3⋅10−3 2.31⋅10−4
References
[1] Y.L. Yao, Thermodynamics of parabolic time rate law of oxidation of metals, J.
Chem. Phys. 43 (1965) 3050–3051.
[2] C. Wagner, Theoretical analysis of the diffusion processes determining the oxidation rate of alloys, J. Electrochem. Soc. (1952) 369–380.
[3] N. Cabrera, N.F. Mott, Theory of the oxidation of metals, Rep. Progr. Phys. 12 (1949) 163–184.
[4] Y. Unutulmazsoy, C. Cancellieri, M. Chiodi, S. Siol, L. Lin, L.P.H. Jeurgens, In situ oxidation studies of Cu thin films: Growth kinetics and oxide phase evolution, J. Appl. Phys. 127 (2020) 065101.
[5] A. Atkinson, Transport processes during the growth of oxide films at elevated temperature, Rev. Modern Phys. 57 (1985) 437–470.
[6] B. Cox, A Method for Calculating the Transient Oxidation of Zircaloys, Technical Report AECL–6784, Atomic Energy of Canada Ltd., 1980.
[7] E.A. García, Diffusion in a semi-infinite system with a moving interface at con- stant temperature for application to𝛼-zirconium oxidation at high temperature, J. Nucl. Mater. 92 (1980) 249–256.
[8] V. Renčiuková, J. Macák, P. Sajdl, R. Novotný, A. Krausová, Corrosion of zirconium alloys demonstrated by using impedance spectroscopy, J. Nucl. Mater.
510 (2018) 312–321.
[9] A. Denis, E. Moyano, E.A. Garcia, Model to simulate high temperature oxidation kinetics of zircaloy-4: Parabolic and linear behaviour, J. Nucl. Mater. 110 (1982) 11–19.
[10] L. Zhang, L.-Y. Chen, C. Zhao, Y. Liu, L.-C. Zhang, Calculation of Oxygen diffusion coefficients in oxide films formed on low-temperature annealed Zr alloys and their related corrosion behavior, Metals (2019) 850.
[11] H.-I. Yoo, B.-J. Koo, J.-O. Hong, I.-S. Hwang, Y.-H. Jeong, A working hypothesis on oxidation kinetics of Zircaloy, J. Nucl. Mater. 299 (2001) 235–241.
[12] A. Lyapin, L.P.H. Jeurgens, P.C.J. Graat, E.J. Mittemeijer, Ellipsometric and XPS study of the initial oxidation of zirconium at room temperature, Surf. Inter. Anal.
(2004) 989–992.
[13] A. Lyapin, L.P.H. Jeurgens, P.C.J. Graat, E.J. Mittemeijer, The initial, ther- mal oxidation of zirconium at room temperature, J. Appl. Phys. 96 (2004) 7126–7135.
[14] A. Lyapin, L.P.H. Jeurgens, E.J. Mittemeijer, Effect of temperature on the initial, thermal oxidation of zirconium, Acta Mater. (2005).
[15] D.L. Douglass, Carl Wagner, The oxidation of Oxygen-deficient Zirconia and its relationship to the oxidation of Zirconium, J. Electrochem. Soc. 113 (1966) 671.
[16] L.P.H. Jeurgens, A. Lyapin, E.J. Mittemeijer, The mechanism of low-temperature oxidation of zirconium, Acta Mater. (2005) 4871–4879.
[17] L.P.H. Jeurgens, A. Lyapin, E.J. Mittemeijer, The initial oxidation of zirconium—oxide-film microstructure and growth mechanism, Surf. Inter. Anal.
38 (2006) 727–730.
[18] G. Bakradze, L.P.H. Jeurgens, T. Acartürk, U. Starke, E.J. Mittemeijer, Atomic transport mechanisms in thin oxide films grown on zirconium by thermal oxidation, as-derived from 18o-tracer experiments, Acta Mater. 59 (2011) 7498–7507.
[19] E. Perez-Feró, T. Novotny, A. Pintér-Csordás, M. Kunstár, Z. Hózer, M. Horváth, L. Matus, Experimental results on the breakaway oxidation of the E110 cladding alloy under high-temperature isothermal conditions, Prog. Nucl. Energy 93 (2016) 89–95.
[20] T. Ahmed, L.H. Keys, The breakaway oxidation of zirconium and its alloys a review, J. Less Common Metals 39 (1975) 99–107.
[21] S. Leistikow, G. Schanz, Oxidation kinetics and related phenomena of zircaloy-4 fuel cladding exposed to high temperature steam and hydrogen-steam mixtures under PWR accident conditions, Nucl. Eng. Des. 103 (1987) 65–84.
[22] P. Petrik, A. Sulyok, T. Novotny, E. Perez-Feró, B. Kalas, E. Agocs, T. Lohner, D. Lehninger, L. Khomenkova, R. Nagy, J. Heitmann, M. Menyhard, Z. Hózer, Optical properties of Zr and ZrO2, Appl. Surf. Sci. 421 (2017) 744–747.
[23] P. Petrik, A. Romanenko, B. Kalas, L. Péter, T. Novotny, E. Perez-Feró, B.
Fodor, E. Agocs, T. Lohner, S. Kurunczi, M. Stoica, M. Gartner, Z. Hózer, Optical properties of oxidized, hydrogenated, and native Zirconium surfaces for wavelengths from 0.3 to 25μm - A study by ex situ and in situ spectroscopic ellipsometry, Phys. Status Solidi A (2019) 1800676.
[24] S. Zhao, F. Ma, K.W. Xu, H.F. Liang, Optical properties and structural characterization of bias sputtered ZrO2 films, J. Alloys Compd. 453 (2008) 453–457.
[31] H.H. Hsieh, W. Kai, R.T. Huang, M.X. Pan, T.G. Nieh, Effect of Zr-content on the oxidation and phase transformation of Zr-base amorphous alloys in air, Intermetallics 12 (2004) 1089–1096.
[32] D. Lehninger, L. Khomenkova, C. Roder, G. Gartner, B. Abendroth, J. Beyer, F. Schneider, D.C. Meyer, J. Heitmann, Ge nanostructures embedded in ZrO2 dielectric films for nonvolatile memory applications, ECS Trans. 66 (2015) 203–212.
[33] V.A. Markelov, V.V. Novikov, N.S. Saburov, A. Gusev, V.F. Kon’kov, M. Peregud, A.B. Dolgov, B.Yu. Volkov, V. Andersson, Irradiation test under advanced PWR conditions in the Halden reactor and post-irradiation examination of fuel rod claddings from different zirconium alloys, in: Presented on TopFuel 2018, 30 September – 4 October 2018, Prague, Czech Republic, 2018.
[40] D.L. Wood, K. Nassau, Refractive index of cubic zirconia stabilized with yttria, Appl. Opt. 21 (16) (1982) 2978–2981,http://dx.doi.org/10.1364/AO.21.002978.
[41] C. Krug, G. Lucovsky, Spectroscopic characterization of high k dielectrics:
Applications to interface electronic structure and stability against chemical phase separation, J. Vacuum Sci. Technol. A 22 (2004) 1301–1308.
[42] S. Zhao, F. Ma, Z. Song, K. Xu, Thickness-dependent structural and optical properties of sputter deposited ZrO2 films, Opt. Mater. 30 (2008) 910–915.
[43] L.B. Pankratz, Thermodynamic Properties of Elements and Oxides, U.S.Department of the Interior, Bureau of Mines, 1982.
[44] H.J.T. Ellingham, Reducibility of oxides and sulphides in metallurgical processes, J. Soc. Chem. Indus. 63 (1944) 125–160.