Case Studies in Thermal Engineering 25 (2021) 100966
Available online 31 March 2021
2214-157X/© 2021 The Author(s). Published by Elsevier Ltd. This is an open access article under the CC BY-NC-ND license
(http://creativecommons.org/licenses/by-nc-nd/4.0/).
Experimental verification of thermal properties of the aerogel blanket
Akos Lakatos ´
a,*, Attila Csík
b, Istv ´ an Csarnovics
caUniversity of Debrecen, Faculty of Engineering, Department of Building Services and Building Engineering, 4028, Debrecen, Otemet´ ˝o Str 2-4, Hungary
bInstitute for Nuclear Research, Bem T´er 18/c, H-4026, Debrecen, Hungary
cUniversity of Debrecen, Faculty of Science and Technology, Institute of Physics, Department of Experimental Physics, Bem T´er 18/a, H-4026, Debrecen, Hungary
H I G H L I G H T S
•Temperature and external load can cause significant change in thermal conductivity of aerogel, while thickness should not.
•Changes in Cp, λ and ρ indicates changes in thermal properties, a temperature conversion coefficient was presented.
•Limited contribution in fire of aerogel was showed, with about 7.5 MJ/kg gross heat of combustion.
•SEM images indicate shrinkage after burning with a residue.
•Raman spectroscopy shows the evaporation of organic compounds while inorganics remain in the residue.
A R T I C L E I N F O Keywords:
Aerogel
Thermal conductivity Specific heat capacity Thermal diffusivity
A B S T R A C T
Decreasing the energy loss both by buildings and by vehicles perhaps one of the most important efforts to protect our environment and energy resources. An option to achieve this is to apply thermal insulations moreover, of super insulation materials (such as aerogel) are becoming increasingly justified. However, these are relatively new materials. The main aim of this paper is to present research results based on case studies of a spaceloft type aerogel once to see the temperature, load and thickness effects in the thermal conductivity, secondly to present results of the measurements regarding the two most important calorific parameters as the specific heat and the combustion heat. These results should be very useful for both designers and researchers.
Measurements were executed by Netzschh 446 heat flow meter and Cal2 Eco bomb calorimeter.
Moreover, calculation results executed on the thermal properties reached from the measured values will be reported. From the measurements, we showed that temperature and external load should affect a significant change in the thermal conductivity of materials, while the thickness should cause only a slight change. Moreover, the gross combustion heat of the aerogel was measured. Changes in the aerogel before and after combustion was investigated by Scanning Electron Microscopy, as well as with Raman microscopy.
* Corresponding author.
E-mail address: alakatos@eng.unideb.hu (A. Lakatos). ´
Contents lists available at ScienceDirect
Case Studies in Thermal Engineering
journal homepage: http://www.elsevier.com/locate/csite
https://doi.org/10.1016/j.csite.2021.100966
Received 29 January 2021; Received in revised form 18 March 2021; Accepted 23 March 2021
1. Introduction
Over the years, the structures of the buildings had to comply with the current energy regulations, which limited the amount of heat transfer coefficient of each structural element. In the beginning, these values were higher, so the heat transfer capacity of the structures was higher, thus more energy input was needed to maintain the energy balance of the building [1]. Thermal insulation of buildings in a general sense is the inhibition of heat transfer between two spaces having different temperatures (e.g. outdoor and indoor), typically with a structure with high thermal resistance. Thus, for example, in the climatic conditions of the central European region, in winter, it is required to prevent the outflow of heat to outside from inside; to reduce the heat loss of heated rooms [2]. In the absence of adequate thermal insulation, the heat loss of a building can be very high. This means that heat flows from the higher temperature medium to the lower temperature medium. The heat loss of buildings can be quite different depending on the presence or condition of the insulation [3]. The value of heat loss is usually as follows: a) 30–40% through the walls, b) 20–30% through the roof, c) 15–25% through the windows, d) 10–15% through the floor and ceiling. Thermal insulation of the house would not be such an important task if we did not have to save on our primary energy sources or pay more attention to our pollutant emissions, especially carbon dioxide. Thermal insulation is one of the conditions for creating a healthy living environment, as a pleasant climate of the living space cannot be created without it. Increased carbon emissions pose a serious threat to the Earth’s climatic conditions, so proper thermal insulation is of great importance. Benefits of thermal insulation: significantly reduce heating costs, external insulation of the facade significantly reduces thermal fluctuations in the walls, which increases the service life of masonry and reduces the negative impact of thermal bridges in wall structures. Moreover, their application by refrigerator cars as well as electric vehicles is also significant [4]. The most applied insu- lation materials are the: 1. expanded polystyrene foam sheet (EPS), 2. graphite polystyrene foam sheet (graphite EPS), 3. extruded polystyrene foam sheet (XPS), 4. rock wool (mineral wool), 5. glass wool, 6. polyurethane foam (PUR foam), 7. wood wool board and some not typical as cork, cotton, coconut, hemp, wood fiber, cellulose-based materials. It has become increasingly necessary to develop thermal insulations with the lowest possible thermal conductivity and in a relatively thin layer. To achieve these goals, the use of nanostructured materials became widespread [5]. Nowadays they have become the so-called super thermal insulation materials, by which one means vacuum panel thermal insulation and modern porous materials such as aerogels. Their market presence justified the launch in 2013 of the IEA-EBC Annex 65 (EBC =Energy in Buildings and Community) program [6]. The primary goal of the program was to investigate only super thermal insulation materials. So, the annex summarizes the most important physical and chemical properties of the materials. Thermal insulations can be grouped according to their thermal conductivity. The thermal conductivity (Symbol: λ; Unit: W/m * K) is one of the most important characteristics of thermal insulation materials, which determines the thermal conductivity of a given material [7,8]. The lower this value, the more advantageous it is for us because the thermal conductivity coefficient shows the amount of thermal energy dissipated per unit of insulation per unit time. These days are causing tremendous technological and economic growth in many industrial sectors [9]. Nanomaterials are expected to become a cornerstone in, for example, microelectronics, textiles, energy, healthcare, pharmacy and cosmetics. Nano-technological applications result in cleaner energy production, lighter and more durable materials and lead to medical applications such as smart medicines and diagnostics. Over the past decade, nano-ceramics have revolutionized the design of conventional materials in many applications by customizing the properties of the atomic scale through structural control. The most commercially significant nano-ceramic constituents are simple metal oxides such as silica and alumina oxides. Thermal insulation materials based on nanotechnology generally have better thermal insulation properties than the above-mentioned conventional materials. In a conservative thermal insulation material, three types of
Nomenclature
λ Thermal conductivity W/mK
Q Heat G
P Heat flow W
t Time s
A Area m2 d Thickness cm T Temperature oC
cp Specific heat capacity J/kgK GCH Gross Combustion Heat MJ/kg ρ Density kg/m3
m Mass g
Ceff Volumetric heat capacity J/Km3 α Diffusivity m2/s
e Effusivity [J/m2Ks1/2] R Thermal resistance m2K/W I Inertia [1/s1/2]
x, y, z coordinates
FT Temperature conversion factor fT Temperature conversion coefficient
heat transfer are possible: heat conduction (vibration of molecules within cell walls and air particles), heat convection (between air particles enclosed in cells), and heat radiation. In nanotechnology-based thermal insulation materials, one or more modes of heat transfer are obstructed and inconvenient. As the porosity of the material increases, the heat conduction through the solid skeleton decreases because a large amount of pores limits the propagation of the phonons in the aerogel backbone [10–14]. Many thermal insulation materials contain nanoparticles e.g.: aerogel is used for either opaque or transparent insulation of building structures as well as nanoparticle-based vacuum insulation panels [15,16]. In recent papers, it was reported that the laboratory tests of both individual and multi-layered wall structures are very significant for the correct design of the buildings [17–22]. We will present experimental results executed once with Netzsch 446 Heat flow meter and Cal2 Eco bomb calorimeter on a fibrous silica aerogel insulation.
Moreover, we present the results of calculations executed on the thermal properties reached from the measured values. The possible morphological changes in the samples after the calorific measurements (burning) were followed by Scanning Electron Microscope (SEM) measurements. Afterward, changes in both the structural and physical properties were revealed by Raman spectroscopy [23].
Besides the investigation of thermal conductivity and specific heat capacity, the measurement of the heat combustion of building materials is also significant. To test the combustibility or non-combustibility of building materials is very significant from a fire-safety point of view. However, some of the building and insulation materials cannot be burned entirely, but harmful or toxic fumes or gases (e.g.: Volatile Organic Compounds) can be released during the burning. Since the analysis of the residue is very important. Aerogel thin layers can be applied in places where only a few thicknesses are available and should be placed between two layers, e.g. by an external shell of airplanes or as insulating the roof s of electric vehicles. For this, it is necessary to know how the thermal performance changes of the sample if we press them with unconventional forces. Moreover, another aim of this paper is to investigate the thermal con- ductivity of aerogel during compressing it. Based on the measurement results we can state that the outcome of our results is gap filling.
We will present new and novel results once in the variation of thermal conductivity by the density and the temperature. Secondly, we will present a new temperature conversion coefficient for the thermal conductivity of the aerogel, moreover, we will also reveal the fire safety properties of this material.
1.1. Heat transfer
However, one of the main topics of the paper is to present laboratory measurement results of thermal properties of aerogel insulation, we have to make a theoretical bypass by analyzing the heat transfer. Generally, heat is transferred in three basic forms as conduction, convection and radiation. Authors, in Ref. [12and18] presents the thermal conductivity of the insulation materials. They presented, that the thermal conductivity of the porous materials arises from, the conduction of both the solid skeleton and the gas, the radiation and heat conduction. Authors in Ref. [24] present a method for an inverse boundary design problem of combined natural convection–radiation. They also presented a step-like enclosure with a gray wall and transparent media. Moreover, Mosavati with colleagues presented a modeling method for reaching the specular reflectivity insulated surfaces [25]. It should be mentioned that Monte-Carlo based simulation is an efficient method to also necessary and needed for solving the above-mentioned problem [26].
Fig. 1. The preparation methods of the different aerogels and the analyzed sample.
2. Materials and methods 2.1. The tested material
The selected thermal super insulation material (SIMs) we would like to present is the aerogel belonging to the advanced porous materials (APM) group of SIMs presented in Fig. 1 (bottom left corner). Before turning to aerogel materials, in particular, it is important to first describe exactly what APM is. In fact, by this abbreviation, we mean materials that are nano-sized and consist of open-pore structures. Their porosity can be as high as 97%, but most often, this ratio is between 90 and 94%. Their average density is 50–250 kg/m3. Consequently, since aerogels are also such materials, they also have these properties. The aerogel is known by several names, inspired primarily by its special appearance. The best known of these are the names of frozen smoke, solid smoke, and last but not least, blue smoke [27].
Fig. 1 further, presents the preparation methods of the aerogel, xerogel and cryogel. The most important difference among the three types are arises from different drying (supercritical, ambient, or freeze-dried) methods. As a first step, the preparation of the silica sol will be required for the solvent-containing gel. Initially, the gels fill the cavities of the three-dimensional dendritic network instead of air [5,28–31]. Two basic processes of gelation are distinguished: hydrolysis and condensation. During these processes, nanoparticles are formed by the formation of Si–O–Si bonds. The structure of elementary particles is primarily determined by pH. In an acidic medium, the process of hydrolysis is faster and the process of condensation is slower, but in a basic medium, the reverse takes place, if we embed the sol-gel to a fiber net can reach an aerogel blanket. Aerogel insulation blankets are one of the most common types of thermal insulation in the construction industry. The quilts are mechanically flexible and have a very low thermal conductivity (λ) of such as 15 mW/m K. Table 1 reports the declared contaminants of the tested material.
2.2. Thermal conductivity and specific heat capacity measurements
Both thermal conductivity and specific heat capacity measurements were executed in a Netzcsh 446 small equipment after desiccating the test specimens in a Venticell 111 type drying equipment to constant weight. In a heat flow meter (HFM), the sample is positioned between two heated plates to reveal the amount of heat flowing through the probe. The sample thickness corresponds to the actual sample dimension or matches the preferred thickness of a sample may be after compression. The heat flow through the sample is measured by two calibrated heat flux transducers covering a base area (20 cm ×20 cm) (see Table 2). For reaching the thermal conductivity the average heat flux and the thermal resistance is used, following Fourier’s Law (Eq. (1)).
λ =Q ×d/A ×ΔT ×t (Eq. 1) The dual heat flux transducers monitor the heat flow to and from the specimen [18]. Signals from the transducers are electronically coupled to account for most edge losses from the specimen. For the determination of the specific heat capacity, the hardware and software of the equipment are allowed to measure and determine the specific heat capacity. This apparatus measures specific heat capacity by heating the sample on a step-by-step basis while the two plates are maintained precisely at the same temperature. At each step, the total heat entering or leaving the specimen is portrayed as the integral of the heat-flux sensor signal. Thereby, the specific heat capacity of the plates also affects; its contribution is of course also taken into consideration. By using this equipment we can declare that the uncertainty of the measurements is about 5% due to the user manual. The instrument was calibrated with a calibration standard. The uncertainty result of each measurement covers the relative standard uncertainty of the thermal conductivity, the relative standard uncertainty of the thermal resistance, the estimated relative uncertainty of the calibration factor, the estimated relative uncertainty of the heat flux meter, the estimated relative uncertainty of the thickness transducer and the estimated relative uncertainty of the temperature difference across the specimen. For each thermal conductivity and specific heat capacity measurements three individual samples were used as the ISO 10456 standard (Building materials and products; Hygrothermal properties; Tabulated design values and procedures for determining declared and design thermal values) requires.
2.3. Measuring the combustion heat of the sample with Cal2 ECO bomb calorimeter
Bomb calorimetry is a technique to determine the heat of the burning of materials that are combusted. It has relevance because insulation materials should be fire retardant, and must stand high temperatures. The Gross Combustion Heat (GCH) of a substance is measured by burning it in a well-ordered high purity oxygen gas (30 bars). The pure oxygen and high pressure guarantee the complete
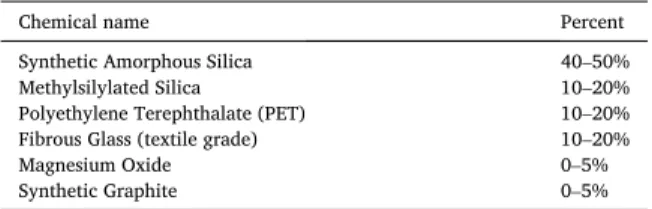
Table 1
The contaminants of the spaceloft aerogel insulation.
Chemical name Percent
Synthetic Amorphous Silica 40–50%
Methylsilylated Silica 10–20%
Polyethylene Terephthalate (PET) 10–20%
Fibrous Glass (textile grade) 10–20%
Magnesium Oxide 0–5%
Synthetic Graphite 0–5%
burning of the organic content of the material. Measurement of the burning heat of insulation materials is from the fire safety point of view. For these measurements, five individual samples were used. The results were averaged and both the absolute deviances and the standard deviances from the mean values were calculated. With this equipment, the GCH value with about ±6% uncertainty can be reached.
2.4. Visualization with scanning electron microscope
To obtain surface morphology information of the as-prepared and combusted samples a Scanning Electron Microscope (LV-SEM, JEOL IT500HR) has been used. Applying such low acceleration voltage the charging effect can be avoided in a high manner, the beam penetration depth typically in the range from tens to hundreds of nm achieved depending on the type of the material. In the case of SiO, this depth is typically in the range of 100 nm. Relatively low penetration depth allowed us to collect more information regarding the surface of the sample. Topographic contrast imaging of the samples was performed by secondary electron (SE) detection with nanometer lateral resolution. To avoid charge accumulation, the microscope was operated at 3 kV acceleration voltage. Composition analysis was also performed by applying a JEOL Energy Dispersive X-ray (EDS) system with a detection threshold of 0.1 at.%. During the EDS measurements, the acceleration voltage has been increased up to 15 kV.
2.5. Raman spectroscopy
Structural changes were further followed by Horiba Labram Nano Microscope, with a green laser diode, which operation wave- length was 532 nm, with a cooled CCD detector and a grating with 1800 lines/mm. For taking the spectra about 20X was fixed to the objective, and it results on the surface in a focused laser spot. Moreover, the laser power was about 1.5 mW/cm2. The measurement was performed with a 200 μm slit width, the acquisition time was 15 s. For the better signal-to-noise ratio, the number of accumulation was 5. The calibration and other settings of the measurements are presented in Ref. [32]. The measured spectra were analyzed and baseline corrected using the LabSpec 6. The accuracy of the peak positions is estimated to be at least ±1.5 cm-1.
3. Results and discussion
3.1. Measurement results of the thermal conductivity with Netzsch 446 equipment 3.1.1. Temperature dependency of the thermal conductivity between 0 and 65 ◦C
Firstly, thermal conductivity measurements were executed on an aerogel sample with a heat flow meter. For measuring the temperature dependency of the thermal conductivity, the mean temperatures were fixed to 0, 10, 20, 25, 30, 40, 50, and 65 ◦C. Fig. 2 reports the linear correlation between thermal conductivity and temperature.
Table 2
The geometrical parameters of the tested sample.
As received density, ρ (kg/m3) 131.0 Mass (g) 54.00
Thickness (entered) (cm) 1.0000
Width (cm) 20.3 Depth (cm) 20.3
Fig. 2. The temperature dependency of the thermal conductivity.
3.2. The temperature conversion coefficient
ISO 10456 standard gives a method to estimate the temperature conversion of the thermal conductivity of insulation materials between two temperatures (T0 and T1) by using the downer equations (Eq. (2)):
λT =λ0 ×FT (Eq. 2)
FT =exp(fT ×(T1-T0)) (Eq. 3) where FT a conversion factor, while fT is conversion coefficient.
If one divides the thermal conductivities measured at different temperatures by the value measured at 0 ◦C (in this case T0 = 0.01821±4E-4) reaches a linear. Moreover, if one takes the natural logarithm of these values, a temperature conversion coefficient can be reached. In this case, it was found to 0.0027, in the function of the temperature. We have to emphasize that this temperature conversion coefficient is a very useful and gap-filling value because neither in the standard nor in the literature can be found such a value for aerogel.
3.2.1. Measurement results of the specific heat capacity with Netzsch 446 equipment
Table 3. reports both settings and results of the cp value executed with the HFM’s in-built cp kit.
A temperature range from 0 to 65 ◦C was chosen for evaluating the specific heat capacity. This value is a key parameter of the materials from the selection point of view of the insulation materials. The tested material is fibrous insulation, made from nano-porous aerogel having a significant amount (about 99%) of air since its specific heat capacity is in the same order of magnitude as the cp value of the air at the same temperature (~1010 J/kg k). But, it is worthy to emphasize that an increase in the specific heat capacity was deduced, while at 50 ◦C the cp value slightly falls back.
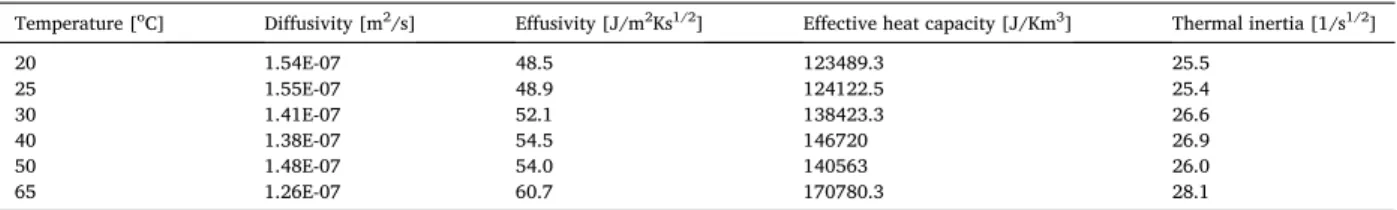
3.3. Evaluation of the calculated thermal properties
We have used the above-presented measurement results as the basis of calculation and examination of other key thermal pa- rameters, as diffusivity, effusivity, and thermal inertia. These thermal properties are well known in heat transfer, but now we would like to introduce them in brief.
3.3.1. Fourier 2nd law for the heat conduction and the diffusivity
If the volume heat source inside a specimen (solid body) is taken as zero (Q0 =0), Fourier II. equation (or diffusion equation Eq. (4)) is obtained, which takes the following form on a homogeneous, isotropic medium, furthermore as the multiplication of the density and the specific heat capacity one can reach the so-called volumetric heat capacity [23,30].
∂T/∂t =λ/(ρ ×cp) ×ΔT =α ×(∂2T/∂x2+∂2T/∂y2+∂2T/∂z2) (Eq. 4)
α =λ/Ceff (Eq. 5)
Besides the thermal conductivity in transient cases diffusivity, effusivity or inertia are also key thermal parameters either for in- dividual or for multi-layered wall systems. The thermal diffusivity is the determining factor for the temporal and spatial changes of the temperature and the speed of temperature equalization. Thermal diffusivity is transient, while thermal conductivity characterizes steady heat transfer processes. The thermal diffusion factor, commonly known as temperature conductivity factor (also known as thermal diffusivity) is a material constant that results from inequality in the spatial and temporal distribution of temperature and affect the value of heat flux density. In the case of high thermal diffusivity, the temperature change occurs slowly [23].
3.3.2. Thermal effusivity
This parameter describes the temperature at the interface of two (solid) media.
e=(ρ ×cp ×λ)0.5 (Eq. 6)
Table 3
The measurement results of the specific heat capacity tests.
Step Step Temperatures Point cp Abs. dev. ±
Start End
(◦C) (◦C) (◦C) (J/(kg∙K)) (J/(kg∙K))
1 17.5 22.5 20.0 943 26
2 22.5 27.5 25.0 948 38
3 27.5 32.5 30.0 1057 18
4 33.8 46.3 40.1 1120 29
5 46.3 58.8 52.6 1073 29
6 58.8 71.3 65.1 1304 63
Thermal effusivity (e) or thermal reactivity are determined from a material such as the square root of the product of the material’s thermal conductivity and volumetric heat capacity (Ceff). The thermal inertia of a material is defined by Eq. (7). where d is the thickness of the tested material in our calculations we fixed it to 1 cm [23,33–35].
I =R ×e=(d/λ) ×e (Eq. 7) By using equations (3)–(7) we have reached some calculated thermal properties. Table 4 reports both measurement and calculated results. Once it is showed that with decreasing thermal conductivity and with decreasing temperature an increasing diffusivity can be reached. Noteworthy that with increasing temperature an increasing effusivity was showed. Table 4 presents are further statements that there was no remarkable increase for the thermal inertia in contrast to the important change of the effective heat capacity in the function of the temperature.
3.4. Thickness dependency of the thermal conductivity between 1 and 5 cm
Fig. 3 reports the measured thermal conductivity at 30 ◦C mean temperature with 20 ◦C delta. Thermal conductivity in the function of the thickness in cm. In this case to check the possible thermal size effect of the sample, moreover to reveal the possible measurement limits of the equipment. Here the measurements were executed as follows: two, three, four, and five aerogel samples with approxi- mately 1 cm (~0.95 cm) thickness of each, were placed on each other and their thermal conductivities were measured together, while the density was fixed, and the thickness was measured by the in-built electronic caliper of the equipment. As one can see the thermal conductivity between 1 and 4 cm is nearly the same their small difference fits in with the 5% accuracy of the Netzsch HFM equipment.
Noteworthy, which the average of measured values for five cm thickness is jumping out. It has to be also mentioned that the accuracy of the HFM equipment is decreasing with the increasing resistance, in this case with the increasing thickness. As ISO 8301 declares, that for the best accuracy the thickness of the samples should be no larger than the 1/8th part of the surface of the plates (here 20 cm).
Consequently, the change in measured thermal conductivity cannot be recognized as a real dependence on the thickness of the sample, it should be an artificial effect caused by the measurement limit of the equipment. It should be a side effect of thickness on the measurement method [36]. Even if in theory a change in the λ as a function of thickness should not be supposed, but a similar effect was deduced not only by us but by Gnip for EPS and by Tang for aerogels, too [37,38]. In the literature it is called to gaseous diffusion effect.
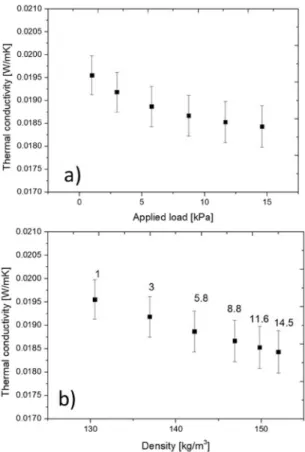
3.5. Load vs thermal conductivity
Thermal insulations might be used in cases where they are compressed or exposed to an external load. Since it is extremely important to know how their thermal performance behaves in these situations. Netzsch HFM can vary the applied on the material from 0.7 to 15 kPa with the accuracy of -/+0.7 kPa, this value is about 1.9 to 2.4 as default. By increasing the applied load (plate pressure) on the sample during the measurements, it can cause a change in both the thickness (decreases) and the density (increases), possibly affect the thermal conductivity. Some real insulating cases where the samples are pressed between two layers might cause a change in the thermal resistance. If one measures the thermal conductivity under different loads can yield a correlation between them and can plan with better confidence. For this case, we have executed thermal conductivity measurements with varying loads from 1 to 15 kPa and reached the following curves. Fig. 4a reports that the increasing applied load decreases the measured thermal conductivity of the sample. It is further presented that the thickness of the sample is also decreasing. By applying about 15 kPa load on the sample, compresses with about 17%.
Fig. 4b reports the thermal conductivity in the function of the compression resulted density change. In the graph, the applied load is also presented.
We can further state that 15 kPa as applied load by the plates, results in about a 15% change in the density (from 130 kg/m3 to 152 kg/m3). The explanation is the following: the tested aerogel sample is glass fiber reinforced one, containing a remarkable amount of air among the fibers. By applying the load on the sample this air content is removed. The fibers get closer to each other resulting decrease in the measured effective thermal conductivity. This result is very significant from the point of view of thermal insulation capability or performance.
For clarification and possible comparison of our results, we have calculated changes in the thermal conductivity caused by once the temperature by the thickness and the applied load. For this Fig. 5 was created and it reports that 5 cm in the thickness results in about 4% change in the thermal conductivity while increasing the temperature up to 30 ◦C results in less than 10% change, at 65 ◦C it results Table 4
The measured and calculated thermal properties.
Temperature [oC] Diffusivity [m2/s] Effusivity [J/m2Ks1/2] Effective heat capacity [J/Km3] Thermal inertia [1/s1/2]
20 1.54E-07 48.5 123489.3 25.5
25 1.55E-07 48.9 124122.5 25.4
30 1.41E-07 52.1 138423.3 26.6
40 1.38E-07 54.5 146720 26.9
50 1.48E-07 54.0 140563 26.0
65 1.26E-07 60.7 170780.3 28.1
in about 18% change in the thermal conductivity. Fig. 5 reports another gap-filling result where it shows about 6% decrease in the thermal conductivity if we compress the sample with about 15 kPa load.
3.6. Measurement results of the combustion heat experiments
Because aerogel samples are relatively new materials another gap-filling measurement row was executed. One part of building or insulation materials are involved in combustion and play a role or contribute heat in a fire while other materials do not. Standard EN 13501-1 organizes materials into seven marks (A (A1, A2), B, C, D, E and F). Due to the declared fire-safety category (EN 13501-1) of the tested sample, as C – s1 - d0, in detail: it has limited but visible participation in the fire, it emits a medium dense smoke and does not drip during the combustion. It was also gap-filling to get to know the burning processes of this material. For testing the burning process of the material an acceptable experiment was executed. A small amount (~0.5 g) from the aerogel sample was prepared for measuring
Fig. 3. The thermal conductivity vs. thickness.
Fig. 4. Thermal conductivity vs. Applied load (a) and vs. density (b).
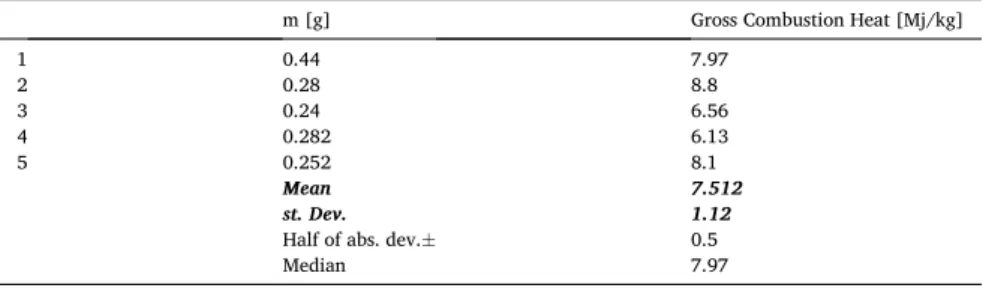
the combustion heat of the material executed with the Cal2 ECO bomb calorimeter. Five measurements were executed on the aerogel sample with the bomb calorimeter. The test results are reported in Table 5. Furthermore, the mean values, variances, and standard deviation were estimated by box chart analysis of the origin software. This table is also showing the mean value of gross heat of combustion of about 7.5 MJ/kg. It has to be mentioned that, in this case, we have determined the gross heat of combustion, which might contain the heat of combustion of possible volatile contents, as well as might contain the latent heat of water, since it is a maximal (higher) heating value. Fangrat in Ref. [39] reports about 15 MJ/kg gross heat of combustion for aerogel blanket, which is double of the value reached by us. It is worthy to mention that there was not identified what type of aerogel was tested. In the market several forms of aerogel blankets are available, having a better fire safety category than “C”. Moreover, it was reported that plastic-based foams (graphite expanded polystyrene (EPS)) having about 35 MJ/kg calorific value after complete burning [40]. It can be stated that more energy is released during the combustion of graphite EPS since its application is much more dangerous. It is further mentionable that EPS materials are combustible and ignitable. In Ref. [41] Wakili et al. Presented a firing test on aerogel containing ceramic fiber insulation, besides DSC and TGA measurements. They found aerogel to be suitable insulation from a fire exposure point of view.
3.6.1. Scanning Electron Microscopy images before and after firing
Before and after the calorimetry tests morphological as well as composition analysis were executed on the samples with a scanning electron microscope. From pair of images (see Fig. 6a and b), it is observable that, the initial form of the sample is a fibrous material covered aerogel grains and particles. However, after burning them, the fibrous structure disappears and the material shrinks together, leaving a solid residue. In recent papers was showed that Scanning Electron Microscope was a very good choice to reveal the micros- structure as well as the structural changes of materials [42].
SEM analysis of as-prepared samples (see Fig. 6a) shows typical images of the fibrous thermal insulation covered with aerogel particles. By the analysis of the burned sample’s image (see Fig. 6b) melted particles have been observed, with inside of a large number of cavities. The composition analysis of the samples shows Ca, Mg, Si, Al and oxygen contents. Analyzing the outer part and the cross- section of the molten particles, it can be stated that Ca, Al and Mg are mostly found on the surface of the particles, it has a good correlation with the declared contaminants of the tested material, presented in Table 1.
3.6.2. Results by Raman spectroscopy
To reveal the possible structural changes that occurred in the sample after and before burning, Raman spectra were registered.
Fig. 7. reports the detailed Raman spectra of both samples. It is necessary to identify both spectra: the red dashed sign belongs to the sample before burning, while the black continuous sign belongs to the sample after burning.
Fig. 5. Calculation results of the changes.
Table 5
Statistical analysis of the measured calorific values - gross heat of combustion.
m [g] Gross Combustion Heat [Mj/kg]
1 0.44 7.97
2 0.28 8.8
3 0.24 6.56
4 0.282 6.13
5 0.252 8.1
Mean 7.512
st. Dev. 1.12
Half of abs. dev.± 0.5
Median 7.97
During the measurement, counts were registered from 250 to 3600 1/cm wavenumbers. The changes of the main peaks, Raman bands are shown in Table 6.
It was revealed that after burning the intensity of peaks of C–O–C, C–O, Si–O, O–Si–O, Mg–Si–O is increased, which is resulted by the oxidation phenomenon of the samples due to their burning in high purity oxygen. We have identified, a few new peaks in the Raman spectra, which belong to the fused silica gel bands, CO symmetric stretching band and SiO4 tetrahedral. The intensity of other peaks is decreased or even disappeared, which is connected with the organic (methyl groups, CH, C–O, C–N, S–H, CH2, CH3,-CL, COOH vibration bands), the OH groups. It is further mentionable that the intensity of some peaks remained the same or not essentially changed, which are connected with the silica aerogel’s simple structural units. The peaks become broad, so the structure amorphized due to the annealing process, while the methyl group’s bending vibration is disappeared. The peaks attributed to the stretching vi- brations –OH also decreasing, even disappeared. Besides, the sharp 980 1/cm feature due to Si vs OH stretching is decreased, even disappeared. The 1465 1/cm feature due to the CH3 deformation is also decreased, disappeared. The 478 1/cm feature has been
Fig. 6a.SEM images and composition analysis before burning the sample.
weakened but is not absent. It might be assigned to eight-membered (4-SiO) surface rings, which are broken down upon burning, and a possible higher energy ring could be formed we revealed that the height of this peak is decreased. At the same time, the intensity of the peaks Si–O–Si increases as well. The spectrum of the untreated silica aerogel shows a weak broad featureless OH-stretching contour at 3230 1/cm. The intensity of this peak is decreased after burning. Signs at 237, 845 and 980 1/cm belonging to OH bonds in the structure, which weakened by the burning, possibly disappear. Moreover, it was also showed that soot was observed, during the analysis of the residue. From the results, we further showed, that most of the organic compounds are disappear and these can be harmful to health. It has to be emphasized that the results of the Raman measurements has also a good correlation with the declared contaminants of the tested material, presented in Table 1.
3.7. Possible applications of the fibrous aerogel insulation
Before describing the results of the research in detail, we would present possible applications of the tested material. It should be Fig. 6b.SEM images and composition analysis after burning the sample.
CaseStudiesinThermalEngineering25(2021)100966
12
Fig. 7. Raman spectra of the as-deposited and annealed (burned) sample.
Lakatos et al.
emphasized the application of such materials as:
a) As floor insulation, a 10 mm layer eliminates the thermal bridge in the substrate. It must be laid directly on the subgrade concrete.
Also for wooden floors can be used with a suitable separating layer;
b) it is a good choice for internal insulation of walls, in a case where conventional insulation thicknesses would be taken away from the valuable habitat. Finished surfaces are plasterboard but with gluing or dowel fastening, using fiberglass to the wall can also be plastered.;
c) as external insulation of walls, it is worth choosing it even in the case of traditional outdoor insulation is not possible to apply the thickness, vapor permeability ability. It can be lime-plastered, also with acrylic and mineral-based plasters. Traditional outdoor insulation systems used in places where thin sections are also required, e.g. for window and doorcases, and where the overhang is minimal;
d) as insulation of thermal bridges, it could be the right choice, and it is perfect at the junctions of the steel structure, by the steel beams for trained thermal bridges, window and doorcases, etc. [27,30,31].
Additionally, Authors in Ref. 15 present a case study of using aerogels in monuments and historical building protection, and they stated that it is suitable for renovation projects. The thin spaceloft creates an opportunity for people specializing in monument pro- tection to improve thermal insulation without the building character would be affected in any way. Moreover, the Authors in Ref. [80]
Table 6
Identification of the signs in Raman spectra.
Peak position, 1/cm Vibration mode After burning
210 Chloroform (monomeric) in acetone [43] Disappeared
237 Mg–OH2 [44] Disappeared
249, 265, 286 Mg–Si–O [45] Appeared, increased
278 Dichloromethane (Cl bending) [46] Disappeared
288 SiO4 tetrahedral’s vibration modes [47] Increased
320 Amorphous silicon’s Longitudinal acoustic (LA) mode [48] Decreased
330 O=N–N–Cl - bending vibration [49] Decreased
373 C6H14 band [50] Disappeared
474 4SiO rings, eight-membered [51] Increased
490 Fused silica gel defect band [52] Appeared
571 COOH bending mode [53] Disappeared and decreased
606 Fused silica gel defect band [452] Appeared
632 peak of Si–C [54], vibration band of Si–H [55] Disappeared
700 SiO4 tetrahedral [56] Disappeared
730 Methionine [57]
Si–N [58] Disappeared
792 SiO quartz, Si–O [59] Slightly changed
845 MgOH’s OH deformation modes [60] Disappeared
850 stretching of Si vs OCH3 [51] Disappeared
858 sign of symmetric stretching vibration
of SiO4 [61] Disappeared
980 Si vs OH stretching vibration [62,63] Decreased - not found
990 sequential stretching Si–O mode of SiO4 tetrahedral vibration [64,65] Increased
1054 CO symmetric stretching band [66]
SiO4 tetrahedral [67] Appeared
1095 antisymmetric stretching mode of O–Si–O [47] Disappeared
1116 stretching of C–O–C and stretching mode of Si–O–Si [68]
[69] Increased
1187 vibration band of -Si-O-Si- [70] Slightly changed
1280 twisting vibrations of CH2–CH2 [71] Decreased
1290 C–O bond’s vibration bands belonging to polyoxyethylene as well as symmetric twisting vibrations
[71] Decreased
1313 CH2–CH2 twisting vibrations as well as vibration bands of polyoxyethylenes (symmetric) [71] Not found
1370 Bending of Aliphatic C–H [72] Disappeared
1418 Polyethylene’s CH2 bonds [73] Disappeared
1440 molten amorphous chains of CH2 bending methods [74] Disappeared
1460 fashions of amorphous chains of CH2 bending [75] Decreased
1518 stretching vibration of C––C [76] Disappeared
1612 stretching vibration of symmetric C––N–N––C [50] Slightly changed
1725 carboxyl group C––O stretching vibration [77] Disappeared
2430 stretching vibrations of C–N groups [78] Disappeared
2523 vibration band of S–H [79] Disappeared
2626 symmetric stretching vibration of CH [79] Disappeared
2815, 2910, 2968 and
3002 symmetric and anti-symmetric stretching vibrations of CH, CH2 or CH3 groups [79] Disappeared 3080 and 3230 stretching vibrations of (O–H) and (NH2) groups with [79]
stretching modes of OH [79] Decreased, partly
disappeared
presents results about EFFESUS project. The authors present, the experimental tests of an aerogel-based insulation material. The material was blown-in insulation developed through the mentioned EU project, they presented their good and useable results through real applications in Glasgow. Ganobjak et al., presents their research as a possible application of the new aerogel based renders for possible refurbishment applications for cultural heritage buildings [81]. This paper further presents several heritage structures that are possible buildings to be insulated with aerogel.
3.8. A case study for possible application
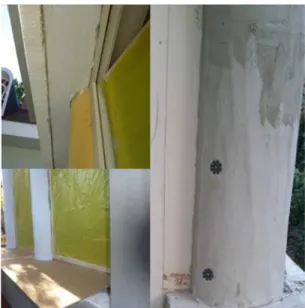
A possible application of aerogel is presented, too. The door and windows of a family house were changed, and shutter blinds were installed outside. But, after a heating period mold formed under the shadings. So, two possibilities were found to solve the thermal bridging effect. The complete change of the shades or the use of thermal insulation, however, the available place was only a few centimeters under the shades (see Fig. 8). After comparing the specific prices of the complete change to the cost of the application of supplementing insulation, the use of the aerogel was concluded. Moreover, the pillars were also covered with aerogel insulation to reduce the thermal bridges. It can be seen in Fig. 8, aerogel as supplementary insulation.
4. Conclusions
Aerogel super insulation material has many application possibilities. Since continuous and better and better laboratory tests should be executed on these materials, as they are relatively new. As a result of our research, the following main statements can be concluded:
•We have investigated the temperature dependency of the thermal conductivity of the aerogel samples between 0 and 65 ◦C, and we found about 18% change.
•Besides, the thermal conductivity, the temperature affected alteration in the specific heat capacity from 0 to 65 ◦C was also deduced. From the measured thermal conductivity and specific heat capacity we have calculated the thermal diffusivity, thermal effusivity, and thermal inertia, moreover the effective heat capacity, too. It should be concluded that in this temperature range, only the effective heat capacity has changed remarkably. The specific heat capacity presented an increasing trend in the function temperature, while at 50 ◦C, it slightly decreased.
•As a result, it was also presented that the thickness might have only a slight (negligible) effect on the measured thermal con- ductivity, which could be also artificial measurement results.
•Additionally, another gap-filling result was given, where we showed about a 6% decrease in the thermal conductivity if we compress the sample with about 15 kPa load. Since the applicability limit of the material can be extended with these results.
•A very new temperature conversion coefficient (fT =0.0027) was presented for aerogel insulation materials.
•Besides these ordinary building material tests, another measurement row was executed, focusing on the gross combustion heat of the aerogel sample. From the measurement row, we found the gross heat of combustion of about 7.5 MJ/kg.
•The changes after burning the samples were followed by a Scanning Electron Microscope, where we deduced a shrinkage of the material, while with Raman spectra we have shown some structural changes. With the scanning electron microscope equipment, we have reached, that after analyzing the outer part and the cross-section of the molten particles, it can be stated that calcium, aluminum, and magnesium are mostly found on the surface of the particles.
•Raman spectroscopy results indicate that the melted sample went through oxidation. At the same time, the intensity of the peaks of Silicon–Oxygen–Silicon increases as well. Moreover, it was also showed that soot was observed, during the analysis of the residue.
From the results, we further showed, that most of the organic compounds are disappear and these can be harmful to health. These fumes can contain Volatile Organic Compounds.
•A case study was also presented to show the possible application of the aerogel.
As further plans, we would continue with the research and would extend our measurements on other aerogel-type insulation materials such as slentex and pyrogel. The use of aerogels in various fields of the industry so it is necessary to involve other materials in the research. Slentex is a new type of spaceloft, while pyrogel is an aerogel-based material for high-temperature applications. We would also test these materials with hot box method, too.
Contributions
Conceptualization and supervision: Akos Lakatos ´ Methodology: Akos Lakatos ´
Writing—original draft preparation: Akos Lakatos ´
Writing—review and editing: Akos Lakatos, Istv´ an Csarnovics, Attila Csík ´
Investigation: Akos Lakatos (Thermal conductivity, specific heat capacity, combustion heat), Istv´ ´an Csarnovics (Raman spectros- copy), Attila Csík (SEM measurements)
Measurements: Akos Lakatos (Thermal conductivity, specific heat capacity, combustion heat), Istv´ ´an Csarnovics (Raman spec- troscopy), Attila Csík (SEM measurements)
Declaration of competing interest
The authors declare that they have no known competing financial interests or personal relationships that could have appeared to influence the work reported in this paper.
Acknowledgments
The research was supported by the Thematic Excellence Programme (TKP2020-IKA-04) of the Ministry for Innovation and Technology in Hungary. This paper was supported by the J´anos Bolyai Research Scholarship of the Hungarian Academy of Sciences.
The authors would say gratefully thanks to G´abor H´ever for taking photos of the application of aerogel insulator material.
References
[1] K. Sudhakar, M. Winder, S. Shanmuga Priya, Net-zero building designs in hot and humid climates: a state-of-art, Case.Stud.Therm. Eng. 13 (March 2019) 100400, https://doi.org/10.1016/j.csite.2019.100400.
[2] M. Khoukhi, A. Hassan, S. Al Saadi, S. Abdelbaqi, The impact of employing insulation with variant thermal conductivity on the thermal performance of buildings in the extremely hot climate, Case.Stud.Therm. Eng. 16 (December 2019) 100562, https://doi.org/10.1016/j.csite.2019.100562.
[3] I. Nardi, E. Lucchi, T. de Rubeis, D. Ambrosini, Quantification of heat energy losses through the building envelope: a state-of-the-art analysis with critical and comprehensive review on infrared thermography, Build. Environ. 146 (2018) 190–205, https://doi.org/10.1016/j.buildenv.2018.09.050.
[4] M. Khoukhi, A. Hassan, S. Al Saadi, S. Abdelbaqi, A dynamic thermal response on thermal conductivity at differenttemperature and moisture levels of EPS insulation, Case.Stud.Therm. Eng. 14 (September 2019) 100481, https://doi.org/10.1016/j.csite.2019.100481.
[5] H.P. Ebert, Thermal properties of aerogels, in: A. Aegerter, N. Leventis, M. Koebel (Eds.), Aerogels Handbook, Springer, New York, NY, USA, 2011, pp. 537–564, https://doi.org/10.1007/978-1-4419-7589-8_23.
[6] Ebc Executive Committee Support Services Unit, Long-Term Performance of Super-insulating Materials in Building Components and Systems – EBC ANNEX 65, International Energy Agency, Energy in Buildings and Communities Program, 2019, 65th Annex. 2020.
[7] B.P. Jelle, Traditional, state-of-the-art and future thermal building insulation materials and solutions—properties, requirements and possibilities, Energy Build.
43 (2011) 2549–2563, https://doi.org/10.1016/j.enbuild.2011.05.015.
[8] M. Koru, Determination of thermal conductivity of closed-cell insulation materials that depend on temperature and density, Arabian J. Sci. Eng. 41 (2016) 4337–4346, https://doi.org/10.1007/s13369-016-2122-6.
[9] L. T¨or¨ok, Industry 4.0 from a few aspects, in particular, in respect of the decision making of the Management/Will the new industrial revolution change the traditional management functions, Int. Rev. Appl. Sci. Eng. 11 (2020) 140–146, https://doi.org/10.1556/1848.2020.20020.
[10] M. Ibrahim, E. Wurtz, P.H. Biwole, P. Achard, H. Salle, Hygrothermal performance of exterior walls covered with aerogel-based insulating rendering, Energy Build. 84 (2014) 241–251, https://doi.org/10.1016/j.enbuild.2014.07.039.
[11] Stahl, Th S. Brunner, S., Zimmermann, M., Ghazi Wakili, K.G. Thermo-hygric properties of a newly developed aerogel based insulation rendering for both exterior and interior applications, Energy Build., 44, 114-117., https://doi.org/10.1016/j.enbuild.2011.09.041.
[12] U. Berardi, R.H. Nosrati, Long-term thermal conductivity of aerogel-enhanced insulating materials under different laboratory aging conditions, Energy 147 (2018) 1188–1202, https://doi.org/10.1016/j.energy.2018.01.053.
[13] T. Ihara, B.P. Jelle, T. Gao, A. Gustavsen, Aerogel granule aging driven by moisture and solar radiation, Energy Build. 103 (2015) 238–248, https://doi.org/
10.1016/j.enbuild.2015.06.017.
[14] E. Lucchi, F. Roberti, T. Alexandra, Definition of an experimental procedure with the hot box method for the thermal performance evaluation of inhomogeneous walls, Energy Build. 179 (2018) 99–111, https://doi.org/10.1016/j.enbuild.2018.08.049.
[15] K. Ghazi Wakili, Th Stahl, E. Heiduk, M. Schuss, R. Vonbank, U. Pont, C. Sustr, D. Wolosiuk, D. Mahdavi, High performance aerogel containing plaster for historic buildings with structured façades, En. Proc. 78 (2015) 949–954, https://doi.org/10.1016/j.egypro.2015.11.027.
[16] Alfonso Capozzoli, Stefano Fantucci, Fabio Favoino, Marco Perino, Vacuum insulation panels: analysis of the thermal performance of both single panel and multilayer boards, Energies 8 (2015) 2528–2547, https://doi.org/10.3390/en8042528.
Fig. 8.Insulation of the place of the shades and pillars. (For interpretation of the references to colour in this figure legend, the reader is referred to the Web version of this article.)
[17] Koˇcí Jan, Robert cerný special issue “recent developments in building physics”, Energies 13 (23) (2020) 6356, https://doi.org/10.3390/en13236356.
[18]A. Lakatos, Stability investigations of the thermal insulating performance of aerogel blanket, Energy Build. 139 (2019) 506´ –516, https://doi.org/10.1016/j.
enbuild.2018.12.029.
[19] D.F. Mu˜noza, B. Anderson, J.M. Cejudo-L´opeza, A. Carrillo-Andr´es, Uncertainty in the thermal conductivity of insulation materials, Energy and Buildings 42 (11) (November 2010) 2159–2168, https://doi.org/10.1016/j.enbuild.2010.07.006.
[20] J. Cha, J. Seo, S. Kim, Building materials thermal conductivity measurement and correlation with heat flow meter, laser flash analysis and TCi, J. Therm. Anal.
Calorim. 109 (2012) 295–300, https://doi.org/10.1007/s10973-011-1760-x.
[21] Y. Huibin, G. Shiyuan, C. Zhuodi, H. Wang, L. Dai, Y. Xu, J. Liu, H. Li, Experimental and numerical study on thermal protection by silica aerogel based phase change composite, Energy Rep. 6 (2020) 1788–1797, https://doi.org/10.1016/j.egyr.2020.06.026.
[22] F. Orsini, P. Marrone, F. Asdrubali, M. Roncone, G. Grazieschi, Aerogel insulation in building energy retrofit. Performance testingand cost analysis on a case study in Rome, Energy Rep. 6 (2020) 56–61, https://doi.org/10.1016/j.egyr.2020.10.045.
[23]A. Lakatos, A. Trník, Thermal diffusion in fibrous aerogel blankets, Energies 13 (2020) 823, https://doi.org/10.3390/en13040823. ´
[24] B. Mosavati, M. Mosavati, F. Kowsary, Solution of radiative inverse boundary design problem in a combined radiating-free convecting furnace, Int. Commun.
Heat Mass Tran. 45 (2013) 130–136, https://doi.org/10.1016/j.icheatmasstransfer.2013.04.011.
[25] B. Mosavati, M. Mosavati, F. Kowsary, Inverse boundary design solution in a combined radiating-free convecting furnace filled with participating medium containing specularly reflecting walls, Int. Commun. Heat Mass Tran. 76 (2016) 69–76, https://doi.org/10.1016/j.icheatmasstransfer.2016.04.029.
[26] M. Mosavati, F. Kowsary, Mosavati, A novel, noniterative inverse boundary design regularized solution technique using the backward Monte Carlo method, J. Heat Tran. 135/042701 (APRIL 2013), https://doi.org/10.1115/1.4022994.
[27]http://www.aerogelszigeteles.hu/system/files/Spaceloft_DS_1.1.pdf. (Accessed 21 March 2019).
[28] L. An, J. Wang, D. Petit, J. Armstrong, C. Li, Y. Hu, Y. Huang, Z. Shao, S. Ren, A scalable crosslinked 514 fiberglass-aerogel thermal insulation composite, Appl Mater Today 21 (2020) 100843, https://doi.org/10.1016/j.apmt.2020.100843.
[29] G. Reichenauer, Structural characterization of aerogels, in: M.A. Aegerter, N. Leventis, M.M. Koebel (Eds.), Aerogels Handbook: Advances in Sol-Gel Derived Materials and Technologies, Springer, New York, NY, USA, 2011, pp. 449–498, https://doi.org/10.1007/978-1-4419-7589-8_21.
[30] J. Fricke, E. Hummer, H.J. Mprper, P. Scheuerpflug, Thermal properties of silica aerogels, J. Phys. Colloq. 24 (1989) 87–97, https://doi.org/10.1051/jphyscol:
1989414.
[31] U. Berardi, A. Lakatos, Thermal bridges of metal fasteners for aerogel-enhanced blankets, Energy Build. 185 (2019) 307´ –315, https://doi.org/10.1016/j.
enbuild.2018.12.041, 2017.
[32]A. Lakatos, I. Csarnovics, Influence of thermal annealing on structural properties of silica aerogel super insulation material, J. Therm. Anal. Calorim. 142 (1) ´ (2020) 321–329, https://doi.org/10.1007/s10973-019-09043-5.
[33] A. Salazar, On thermal diffusivity, Eur. J. Phys. 24 (2003) 351–358, https://doi.org/10.1088/0143-0807/24/4/353.
[34] G. Wei, X. Zhang, F. Yu, K. Chen, Thermal diffusivity measurements on insulation materials with the laser flash method, Int. J. Thermophys. 27 (2006), https://
doi.org/10.1007/s10765-006-0023-8, 1 235-243.
[35] I. Boulaoued, I. Amara, A. Mhimid, Experimental determination of thermal conductivity and diffusivity of new building insulating materials, Int. J. of Heat and Techn. 34 (2016), https://doi.org/10.18280/ijht.340224, 2 325-331.
[36]ISO (International Organization for Standardization), Thermal Insulation – Determination of Steady-State Thermal Resistance and Related Properties – Heat Flow Meter Apparatus, Standards ISO 8301, ISO, Gen`eve, 1991.
[37] I. Gnip, S. Vejelis, S. Vaitkus, Thermal conductivity of expanded polystyrene (EPS) at 10 ˙ ◦C and its conversion to temperature within interval from 0 to 50 ◦C, Energy Build. 52 (2012) 107–111, https://doi.org/10.1016/j.enbuild.2012.05.029.
[38] G.H. Tang, C. Bi, Y. Zhao, W.Q. Tao, Thermal transport in nano-porous insulation of aerogel: factors, models and outlook, Energy 90 (1) (2015) 701–721, https://doi.org/10.1016/j.energy.2015.07.109. October 2015.
[39] J. Fangrat, On non-combustibility of commercial building materials, Fire Mater. 41 (2017) 99–110, https://doi.org/10.1002/fam.2369.
[40]A. Lakatos, I. De´ ´ak, U. Berardi, Thermal characterization of different graphite polystyrene, Int. Rev. Appl. Sci. Eng. 9 (2) (2018) 163–168, https://doi.org/
10.1556/1848.2018.9.2.12.
[41] K. Ghazi Wakili, A. Remhof, Reaction of aerogel containing ceramic fibre insulation to fire exposure, Fire Mater. 41 (2017) 29–39, https://doi.org/10.1002/
fam.2367.
[42] X. Yang, Y. Sun, D. Shi, J. Liu, Experimental investigation on mechanical properties of a fiber-reinforced silica aerogel composite, Mater. Sci. Eng., A 528 (2011) 4830–4836, https://doi.org/10.1016/j.msea.2011.03.013.
[43]Frank S. Parker, Applications of Infrared, Raman and Resonance Raman Spectroscopy in Biochemistry, Plenum Press, 1983.
[44] N.N. Greenwood, Spectroscopic Properties of Inorganic and Organometallic Compounds, vol. 7, The Chemical Society Burlington House, London, W1V 0BN, 1973, https://doi.org/10.1039/9781847554901.
[45] Q. Williams, R. Jeanloz, Vibrational spectrum of MgSiO3 perovskite zero-pressure ramand and mid-infrared spectra to 27 GPa, J. Geophys. Res. 92 (1987) 8116–8128, https://doi.org/10.1029/JB092iB08p08116.
[46] S.R. Ellis, D.P. Hoffman, M. Park, R.A. Mathies, Difference bands in time-resolved femtosecond stimulated Raman spectra of photoexcited intermolecular electron transfer from chloronaphthalene to tetracyanoethylene, J. Phys. Chem. 122 (14) (2018 Apr 12) 3594–3605, https://doi.org/10.1021/acs.
jpca.8b00318.
[47] K. Ishikawa, N. Fujima, H. Komura, Firstorder Raman scattering in MgO microcrystals, J. Appl. Phys. 57 (1985) 973, https://doi.org/10.1063/1.334701.
[48] Zhixun MA, LlAO. Xianbo, Guanglin Kong, Junhao Chu, Raman scattering of nanocrystalline silicon embedded in SiOz, SCIENCE IN CHINA (Series A) 43 (NO. 4) (2000) 414–420, https://doi.org/10.1007/BF02897165.
[49]D.N. Sathyanarayana, Vibrational Spectroscopy, Theory and Applications, New age international publishers, 2005.
[50] K.N. Galkin, N.G. Galkin, Silicon overgrowth atop low-dimensional Mg2Si on Si(111): structure, optical and thermoelectrical properties, Physics Procedia 11 (2011), https://doi.org/10.1016/j.phpro.2011.01.013, 55-4.
[51]Dalmay Lin-Vien, B. Colthup Norman, G. Fateley William, Jeannette G. Grasselli, The Handbook of Infrared and Raman Characteristic Frequencies of Organic Molecules, Academic Press, 1991.
[52] C.A.M. Mulder, A.A.J.M. Damen, The origin of the "defect" 490 cm−1 Raman peak in silica gel, J. Non-Cryst. Solids 93 (1987) 387–394, https://doi.org/
10.1016/S0022-3093(87)80183-7.
[53] S.M. Rolfe, M.R. Patel, I. Gilmour, K. Olsson-Francis, T.J. Ringrose, Defining multiple characteristic Raman bands of α-amino acids as biomarkers for planetary missions using a statistical method, Orig. Life Evol. Biosph. 46 (2016) 323–346, https://doi.org/10.1007/s11084-015-9477-7.
[54] H. Richter, Z.P. Wang, L. Ley, The one phonon Raman spectrum in mimrystalline silicon, Solid State Commun. 39 (1981) 625, https://doi.org/10.1016/0038- 1098(81)90337-9.
[55] Reinhard Kaindl, Daniel M. Tobbens, HaefeKeR. Udo, Quantum-mechanical calculations of the Raman spectra of Mg- and Fe-cordierite, Am. Mineral. 96 (2011) ¨ 1568–1574, https://doi.org/10.2138/am.2011.3845.
[56] H. Rücker, M. Methfessel, B. Dietrich, K. Pressel, H.J. Osten, Phys. Rev. B 53 (1996) 1302, https://doi.org/10.1103/PhysRevB.53.1302.
[57]Hari Singh Nalwa, Silicon-based Materials and Devices, Properties and Devices, vol. 1, Academic Press, 2001.
[58] M. Wang, J. CHeng, M. Li, F. He, Physica B 406 (2011) 3865, https://doi.org/10.1016/j.physb.2011.07.014.
[59] B. Sjoberg, S. Foley, B. Cardey, M. Enescu, An experimental and theoretical study of the amino acid side chain Raman bands in proteins, Spectrochim. Acta. A. ¨ Mol. Biomol. Spectrosc. 128 (2014) 300–311, https://doi.org/10.1016/j.saa.2014.02.080.
[60] J. Bandet, B. Despax, M. Caumont, Nitrogen bonding environments and local order in hydrogenated amorphous silicon nitride films studied by Raman spectroscopy, J. Appl. Phys. 85 (1999) 7899, https://doi.org/10.1063/1.370604.