General Physiology and Biophysics Revised manuscript #2
Title: Laser induced calcium oscillations in fluorescent calcium imaging Running title: Laser induced Ca2+ oscillations
Create date: 2018-03-16
Name Affiliations
Dr János Almássy 1. Department of Physiology, Faculty of Medicine, University of Debrecen, Debrecen, Hungary
Dr Janos Vincze 1. Department of Physiology, Faculty of Medicine, University of Debrecen, Debrecen, Hungary
Nikolett Geyer 1. Department of Physiology, Faculty of Medicine, University of Debrecen, Debrecen, Hungary
Dr Gyula Diszházi 1. Department of Physiology, Faculty of Medicine, University of Debrecen, Debrecen, Hungary
Prof László Csernoch 1. Department of Physiology, Faculty of Medicine, University of Debrecen, Debrecen, Hungary
Prof Tamás Bíró 1. Department of Immunology, Faculty of Medicine, University of Debrecen, Debrecen, Hungary
Dr István Jóna 1. Department of Physiology, Faculty of Medicine, University of Debrecen, Debrecen, Hungary
Dr Beatrix Dienes 1. Department of Physiology, Faculty of Medicine, University of Debrecen, Debrecen, Hungary
Corresponding author: Dr János Almássy <almassy.janos@med.unideb.hu>
Abstract
Phototoxicity is the most common problem investigators may encounter when performing live cell imaging. It develops due to excess laser exposure of cells loaded with fluorophores and can lead to often overlooked but significant artifacts, such as massive increase of intracellular Ca2+
concentration, which would make data interpretation problematic. Because information about laser- and dye-related changes in cytoplasmic calcium concentration is very limited, we aimed to describe this phenomenon to help investigators using laser scanning confocal microscopy in a non-invasive way. Therefore, in the present study we evaluated fluorescent fluctuations, which evolved in Fluo- 3/4/8 loaded mouse pancreatic acinar cells during very low intensity laser excitation. We
demonstrate that after standard loading procedure (2 µM Fluo-3/4/8-AM, 30 min @ room
temperature), applying 488 nm laser at as low as ca. 10 µW incident laser power (0.18 µW/µm2) at 1 Hz caused repetitive, 2-3 fold elevations of the resting intracellular fluorescence. The first latency and the pattern of the fluorescence fluctuations were laser power dependent and were related to Ca2+-release from intracellular stores, as they were abolished by BAPTA-AM treatment in Ca2+- free medium, but were not diminished by the ROS scavenger DMPO. Worryingly enough, the qualitative and quantitative features of the Ca2+-waves were practically indistinguishable from the responses evoked by secretagogue stimulation. Since using similar imaging conditions, a number of other cell types were reported to display spontaneous Ca2+ oscillations, we propose strategies to
Keywords: calcium imaging; Fluo-4; phototoxicity Changelog
WE ACCEPT ALL THE CHANGES MADE IN THE MANUSCRIPT AND WE CORRECTED IT AS REQUESTED:
1. Please, correct citations in the whole text. Instead of a reference number, include the name of the first author, et al. and the year of issue. (e.g.: Milla et al. 2012). In the case, there are only two authors of one article, please, write instead of et al. both author names (e.g.: Fiebig and Dill instead of Fiebig et al).
CORRECTED (PLEASE FIND THE REFERENCES IN THE TEXT IN BLUE COLOUR)
2. In the list of References, please check and correct consistently all references accordance with our Instructions for authors: http://www.gpb.sav.sk/in.htm
CORRECTED ACCORDINGLY
3. In all figures, correct please unit at axis y, instead sec give only s.
CORRECTED
4. Figure 4 is in color. We would like inform you that one color printed page in the journal costs approx. 100 Euros. If you decide to publish the figure in color, please give to us your
confirmation.
WE WOULD LIKE TO GET IT PRINTED BLACK AND WHITE.
The requested changes were directly made into the corrected manuscript.
Supplementary files S1 - download S2 - download
DOI: 10.4149/gpb_2017054 1
2
Laser induced calcium oscillations in fluorescent calcium imaging 3
4
János Vincze1,*, Nikolett Geyer1,*, Gyula Diszházi1, László Csernoch1, Tamás Bíró2, István 5
Jóna1, Beatrix Dienes1 and János Almássy1 6
7 8
1 Department of Physiology, University of Debrecen, Faculty of Medicine, 98. Nagyerdei krt., 9
Debrecen 4012, Hungary 10
2 Departments of Immunology, University of Debrecen, Faculty of Medicine, 98. Nagyerdei 11
krt., Debrecen 4012, Hungary 12
13 14
jnsvncz@gmail.com 15
geyer.nikoletta@med.unideb.hu 16
17 18
Correspondence to: János Almássy, Department of Physiology, University of Debrecen, 19
Faculty of Medicine, 98. Nagyerdei krt., Debrecen 4012, Hungary 20
E-mail: almassy.janos@med.unideb.hu 21
22 23 24
* These authors contributed equally to this work.
25 26
Abstract. Phototoxicity is the most common problem investigators may encounter when 27
performing live cell imaging. It develops due to excess laser exposure of cells loaded with 28
fluorophores and can lead to often overlooked but significant artifacts, such as massive 29
increase of intracellular Ca2+ concentration, which would make data interpretation 30
problematic. Because information about laser- and dye-related changes in cytoplasmic 31
calcium concentration is very limited, we aimed to describe this phenomenon to help 32
investigators using laser scanning confocal microscopy in a non-invasive way. Therefore, in 33
the present study we evaluated fluorescent fluctuations, which evolved in Fluo-3/4/8 loaded 34
mouse pancreatic acinar cells during very low intensity laser excitation. We demonstrate that 35
after standard loading procedure (2 µM Fluo-3/4/8-AM, 30 min at room temperature), 36
applying 488 nm laser at as low as ca. 10 µW incident laser power (0.18 µW/µm2) at 1 Hz 37
caused repetitive, 2–3 fold elevations of the resting intracellular fluorescence. The first 38
latency and the pattern of the fluorescence fluctuations were laser power dependent and were 39
related to Ca2+-release from intracellular stores, as they were abolished by BAPTA-AM 40
treatment in Ca2+-free medium, but were not diminished by the reactive oxygen species 41
(ROS) scavenger DMPO. Worryingly enough, the qualitative and quantitative features of the 42
Ca2+-waves were practically indistinguishable from the responses evoked by secretagogue 43
stimulation. Since using similar imaging conditions, a number of other cell types were 44
reported to display spontaneous Ca2+ oscillations, we propose strategies to distinguish the real 45
signals from artifacts.
46 47
Abbreviations: [Ca2+], intracellular calcium concentration; BSA, bovine serum albumin; cch, 48
carbachol; CICR, calcium induced calcium release; ER, endoplasmic reticulum; IP3R, inositol 49
trisphosphate receptor; ROI, region of interest; ROS, reactive oxygen species; RyR, ryanodine 50
receptor; SERCA, sarco-endoplasmic reticulum calcium ATP-ase; SOCE, store operated 51
calcium entry.
52 53 54
Introduction 55
56
Ca2+ is an important second messenger in the cell, which controls many cellular functions 57
such as muscle contraction, exocytosis, gene expression, proliferation and cell death. In order 58
to fulfill its mission, it is essential to maintain intracellular Ca2+ concentration ([Ca2+]i) low at 59
rest, but to allow it rapidly and transiently rise during excitation. For example, in pancreatic 60
acinar cells [Ca2+]i is elevated by Ca2+-release from the endoplasmic reticulum (ER) through 61
inositol trisphosphate receptors (IP3R) and ryanodine receptors (RyR) upon secretagogue 62
stimulation to trigger exocytosis of zymogen containing vesicles (Straub et al. 2000, Petersen 63
et al. 2007, Leite et al. 2002, Williams et al. 1978, Habara et al. 1994). Sustained stimulation 64
leads to ER depletion and the activation of store operated calcium entry (SOCE) to support 65
prolonged Ca2+ signals and ER reload (Lewis et al. 2007, Smyth et al. 2010, Putney et al.
66
2007). Afterwards, [Ca2+]i is restored by the sarco-endoplasmic reticulum Ca2+-ATP-ase 67
(SERCA) and the plasma membrane Ca2+ pump (PMCA). They are also responsible for 68
keeping [Ca2+]i stable and low (ca. 100 nM) in unstimulated cells (Yule 2010).
69
Certainly, biomedical researchers are particularly interested in measuring the changes 70
of [Ca2+]i because of its critical influence on the cell’s fate. Their scientific ambition is 71
supported by the development of fluorescent Ca2+ imaging techniques in the past few decades.
72
The simplest and most popular Ca2+ imaging tools are the Ca2+ indicator fluorescent dyes 73
from the Fluo family (Fluo-3/4/8) (Minta et al. 1989, Gee et al. 2000). These dyes are also 74
available in acetoxymethylester (AM)-conjugated form which easily cross the plasma 75
membrane, but inactive (does not bind Ca2+). The dye attains activity after the AM group is 76
enzymatically hydrolyzed by intracellular esterases, which also makes the resulting dye water 77
soluble to prevent the dye escaping from the cell.
78
An important problem of fluorescent imaging is that exposure of the fluorophore to 79
high intensity focused light is required for excitation and subsequent fluorescent emission;
80
however, the illuminating light itself is the source of two undesirable consequences:
81
phototoxicity and photobleaching (Pawley et al. 2006, Hoebe et al. 2007, Rohrbach et al.
82
2005, Collins et al. 2014, Bootman et al. 2013). Photobleaching (fading) is mainly due to 83
classic photodestruction, whereas phototoxicity is due to the photochemical reaction of the 84
excited fluorophore with molecular oxygen, which produces reactive oxygen species (ROS).
85
ROS oxidize cellular components that results in cell damage (phototoxicity), and also react 86
with the fluorophore, which contributes to fluorescent signal loss (photobleaching) (Pawley et 87
al. 2006, Hoebe et al. 2007, Rohrbach et al. 2005, Collins et al. 2014, Bootman et al. 2013).
88
The major complication of phototoxicity during live cell imaging is not the reduced cell 89
viability itself, but the unusual behavior of the damaged cell, which can contaminate the 90
detected signal and deceive the investigator (Pawley et al. 2006, Hoebe et al. 2007, Rohrbach 91
et al. 2005, Collins et al. 2014, Bootman et al. 2013).
92
An example of such an artifact is light induced Ca2+ elevation in cells loaded with 93
Fluo- calcium sensitive dyes. While this issue could affect most of the confocal microscopy 94
users who perform Ca2+ imaging, its literature is limited to only a couple of papers 95
(McDonald et al. 2012, Knight et al. 2003). These reports describe light- induced Ca2+
96
transients in Fluo-3 AM-loaded smooth muscle cells and in Fluo-4 AM-loaded cultured 97
chondrocytes during epifluorescent imaging using light emitting diodes and during laser- 98
scanning confocal microscopy, respectively. In the present paper repetitive, laser activated 99
Ca2+-release events were evaluated in Fluo-loaded pancreatic acinar cells and other cell types 100
using laser scanning confocal microscopy to help investigators identify light-related artifacts.
101
Moreover, strategies to overcome the problem are also offered.
102 103
Materials and Methods 104
105
Chemicals 106
Fluo-3/4/8-AM and Fura-Red-AM was purchased from Molecular Probes (ThermoFisher 107
Scientific). All other materials were purchased from Sigma, unless otherwise specified.
108 109
Pancreatic acinar cell isolation 110
Experiments were performed in accordance with EU (86/609/EEC) guideline under a license 111
obtained from the Scientific Committee on Animal Health and Welfare of the University of 112
Debrecen. Pancreatic acinar cells were freshly isolated from mouse pancreas as described 113
previously. Briefly, 2–4 months old NMRI mice of both genders were euthanized by cervical 114
dislocation and the pancreas was rapidly removed. The tissue was injected with F12/DMEM 115
medium containing 100 U/ml collagenase P (Roche), 0.1 mg/ml trypsin inhibitor and 2.5 116
mg/ml BSA and then incubated in this solution for 30 minutes in a 37°C shaking water bath.
117
The media were continuously gassed with carbogen. The tissue was dissociated by pipetting 118
4–6 times using a 5 ml serological pipette. The cell clumps then were filtered through mesh 119
#60 (150 µm). The filtrate was layered on the top of 400 mg/ml BSA and washed through the 120
medium by gentle centrifugation. The cell pellet was resuspended and collected by 121
centrifugation. Acinar cell clumps were gently resuspended in F12/DMEM medium and kept 122
gassed at room temperature until use (Geyer et al. 2015).
123 124
Cell cultures 125
HEK293 cells and HaCaT keratinocytes were cultured in DMEM medium supplemented with 126
10% fetal bovine serum (FBS) at 37° in a CO2 thermostat (Geyer et al. 2015). Cells were 127
allowed to grow to 60–70% confluence.
128
Intracellular Ca2+ imaging 129
Acinar cell clumps and other cell cultures were loaded with 0.5–2 µM Fluo-4-AM Ca2+- 130
sensitive dye for 30 minutes at room temperature (exact concentrations used are indicated in 131
the text). Cells were plated on glass coverslips and mounted on a perfusion chamber. After 132
perfusion with Tyrode’s solution containing (in mM): 140 NaCl, 5 KCl, 2 MgCl2 and 10 133
HEPES, pH = 7.2 with or without 1.8 CaCl2, fluorescence was monitored in time series 134
measurements using a Zeiss LSM 5 LIVE confocal microscope equipped with a 40× oil 135
immersion objective for most experiments or a Zeiss LSM 510 META confocal microscope 136
with a similar objective for some experiments. Fluo-4 was excited at 488 nm and the emitted 137
light was collected through a 500–525 nm band-pass filter. The pinhole was set to correspond 138
to ca. 5 μm tissue section widths (Geyer et al. 2015). In some experiments Fluo-4-AM was 139
co-loaded with Fura-Red AM (2 and 6 μM respectively). In these experiments, both 140
fluorophores were excited with the 488 nm argon laser, the emitted light was divided by a 635 141
nm beamsplitter and detected simultaneously after filtered with a 500–525 nm bandpass filter 142
for the green channel or no filter for the red channel. In some experiments, cells were treated 143
with 20 μM BAPTA AM for 20 minutes or 2 mM tetracaine (tetracaine was also included in 144
the perfusion solution). To test the role of ROS, 500 μM 5,5-dimethyl-pyrroline N-oxide 145
(DMPO) was included into the bath solution (pH = 7.2). Fluorescence emission data of single 146
cells was analyzed and F/F0 ratio was calculated after background subtraction using Zeiss 147
ZEN 2009 and Microsoft Excel software, respectively. Spatio-temporal analysis of Ca2+
148
waves was performed using high frequency line-scan imaging (500 lines/s).
149 150
Statistics 151
Averages are expressed as mean ± SEM (standard error of the mean). Statistical analysis was 152
performed using Student’s t-test. Threshold for statistically significant differences as 153
compared to the respective control was set at * p < 0.01.
154 155
Results 156
157
Spontaneous Ca2+ oscillations observed in x-y imaging mode 158
The data presented here were obtained in enzymatically isolated mouse pancreatic acinar cell 159
clumps of various sizes (ca. 10–30 cells) using a Zeiss LSM 5 LIVE line-scanning confocal 160
microscope. The cells showed retained polarized morphology, characterized by apical 161
granules. The cell clumps maintained typical acinar architecture. No obvious signs of cell 162
damage (e.g. blebbing) were observed either before or after the experiments (Figure 1A).
163
Importantly, we intended to avoid phototoxicity by optimizing the dye loading conditions so 164
the resting fluorescence fell above the lowest measurable intensity. Using 1 mW laser power 165
output, the resting intracellular fluorescence (872 ± 72 arbitrary unit, AU) was only 3 fold 166
higher than the background fluorescence (288 ± 14 AU). Notably, this laser intensity 167
corresponds to only 1% of the maximum power output of our argon laser, which is a typical 168
setting for confocal imaging of live cells. In this case, due to various losses in the imaging 169
system, 10 μW laser power is transmitted through the objective and the power density of the 170
light is 0.18 μW/µm2 and the dwell time is 972 µs.
171
Acinar cells were loaded with 2 μM Fluo-4-AM for 30 minutes and mounted on 172
coverslips of a perfusion chamber. Cells were washed with physiological saline solution and 173
were excited repetitively with a 488 nm laser beam at 1 mW, 1 Hz using the x-y scan mode.
174
Because unstimulated acinar cells should exhibit stable basal [Ca2+]i (Petersen et al. 2007), we 175
were surprised to observe robust, repetitive fluctuations of intracellular fluorescence in most 176
of the cells, which appeared within 3 minutes after the first frame and rapidly expanded in the 177
whole cell. Fluorescence seemed to increase in most cells of the specimen. An example of 178
such a fluorescence oscillation is shown in Figure 1B.
179
Although, a number of cell types (Wang et al. 2006, Vukcevic et al. 2010, Fedoryak et 180
al. 2004, Johnston et al. 2005) were shown to display physiologically relevant spontaneous 181
Ca2+ oscillations, resting oscillatory behavior is not the intrinsic property of acinar cells, 182
which suggest that what we have seen was a light- induced artifact. One would expect light- 183
induced artifacts to be dependent on exciting light intensity and other imaging conditions. In 184
contrast, if our oscillations were due to spontaneous, intrinsic biological activity of the cell, it 185
wouldn’t be laser power dependent. Therefore, we aimed to find out how this phenomenon 186
could have triggered and to test its light dose-response relationship.
187
The oscillations apparently had a dye-related origin, as they had earlier onset and higher 188
amplitude at higher dye concentrations and could be completely prevented by using lower 189
extracellular Fluo-4-AM concentrations. Also, our experiments using different laser powers 190
demonstrated that the qualitative features of the fluorescence highly depended on the laser 191
exposure. In comparison with 1 mW, at 3 mW (ca. 30 μW incident light, 0.54 µW/µm2 power 192
density) we detected long-lasting elevations of the fluorescence with depressed oscillatory 193
behavior and earlier onset, but similar spiking frequency (0.99 ± 0.03/min vs. 0.95 194
± 0.08/min, Figure 1B–F). The first peak latency of fluorescence was 237±6 sec for 1 mW 195
and 140 ± 13 s for 3 mW (Figure 1E). Although, most of the cells responded to both laser 196
intensities, the ratio of active cells varied between specimens, with >90% in some cases.
197
However, when cells were imaged using lower laser power (0.5 mW laser output = 5 μW 198
incident light power and 0.09 µW/µm2 power density) at 0.5 Hz, fluorescence was stable 199
during the 12 minutes recording time except for the insignificant, but continuous reduction of 200
basal fluorescence, because of photobleaching (Figure 1D). Very similar oscillatory behavior 201
was demonstrated in Fluo-3 and Fluo-8 loaded pancreatic acinar cells, too (supplementary 202
Figure S1.).
203
Our biggest concern about the phenomenon was that the light-activated oscillatory behavior 204
was practically indistinguishable from the activity elicited by the parasympathic 205
neurotransmitter acetylcholin-analogue carbachol (cch), which we often use to test pancreatic 206
acinar cell function. This is demonstrated in Figure 1G, which shows a typical response of 207
acinar cells to 100 and 200 nM cch under “non-invasive” imaging conditions (i.e. 0.5 mW 208
laser power, 0.5 Hz). These original records clearly show that the signal amplitude and the 209
oscillation frequency were very similar for the cch and the laser-induced signals.
210
To exclude the possibility that the oscillations can be only elicited by our Zeiss LSM 5 211
LIVE line-scanning high-speed confocal microscope, similar experiments were performed 212
using a Zeiss LSM 510 META microscope. Similar spontaneous repetitive fluorescence 213
spikes could have been also observed (supplementary Figure S2.).
214 215
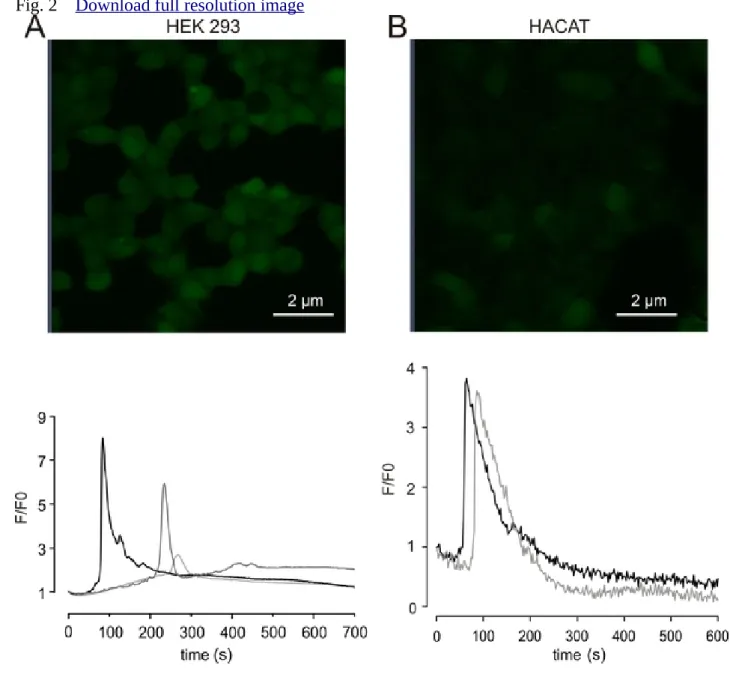
Ca2+ oscillations in HEK293 cells and HaCaT keratinocytes 216
In order to determine whether this artefact is restricted to pancreatic acinar cells or occurs in 217
other cell types too, we performed similar experiments using Fluo-4-AM loaded HEK293 218
cells and HaCaT keratinocytes. Both cell types showed similar spontaneous transient 219
elevation of [Ca2+]i (Figure 2A and B). Interestingly, no transients could be triggered again on 220
the same cells using the same imaging conditions.
221 222
Detailed investigation and prevention of spontaneous Ca2+ oscillations in pancreatic acinar 223
cells 224
Next, in order to prevent the spontaneous calcium oscillations, we aimed to learn more about 225
them. In previous studies, ROS production was shown to be responsible for phototoxicity 226
(Bootman et al. 2013, Knight et al. 2003, Dixit and Richard 2003, Grzelak et al, 2001);
227
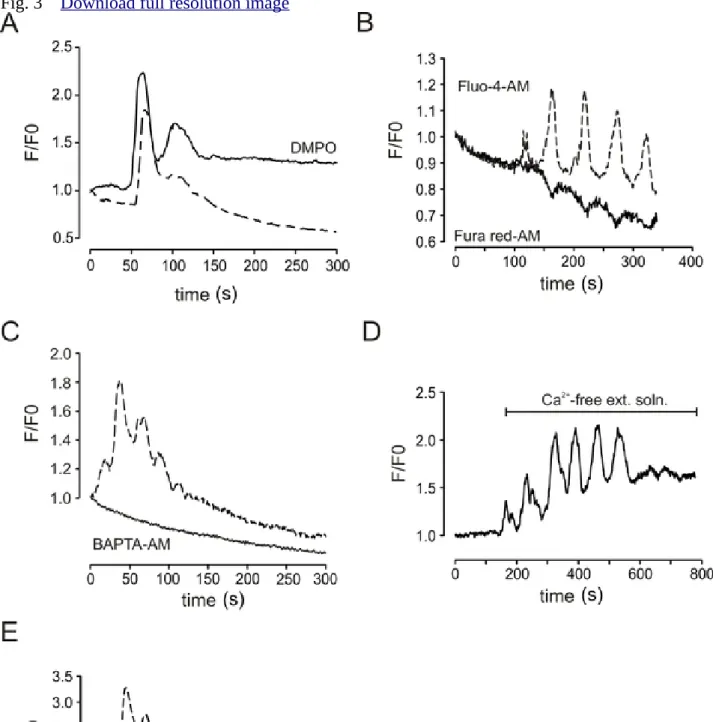
therefore, we tested the role of ROS in laser-induced fluorescent oscillations by using the 228
ROS scavenger DMPO. Acinar cells were treated with the reagent for 10 minutes before the 229
experiment and cells were continuously perfused with physiological saline solution 230
supplemented with the reducing agent during imaging. Surprisingly, the treatment did not 231
suppress the fluorescent fluctuations, which implies that ROS is not required to generate the 232
oscillatory signal (Figure 3A). This result argues against the hypothesis that ROS mediates 233
fluorescent fluctuations in Fluo-4 loaded cells (Knight et al. 2003).
234
To clarify whether the laser-induced fluorescence change was really due to [Ca2+]i
235
fluctuations, another Ca2+ indicator was also used for signal detection. For this purpose Fura- 236
Red was chosen because it allows simultaneous Fluo-4 recordings (see Materials and methods 237
for details) but has very different photochemical properties than Fluo-4. Fura-Red is a Ca2+
238
quenching fluorophore, which means that the increase in [Ca2+]i is reported by a decrease in 239
its emission when excited at 488 nm (Thomas et al. 2000). Moreover, it is less susceptible to 240
photobleaching and Fura-Red loaded cells show weaker phototoxicity (Rohrbach et al. 2005).
241
Because of these very different optical and chemical characteristics, we assumed that if the 242
oscillations observed in the Fluo-4 signal were not due to changes in the intracellular Ca2+
243
concentration, Fura-Red should not have reported the change either (Lipp and Niggli 1993).
244
Consequently, if typical Fura-Red responses during laser excitation were detected, it would 245
rather be attributable to changes in [Ca2+]i. To test this, cells were co-loaded with Fluo-4 and 246
Fura-Red and the emissions were detected simultaneously (Lipp and Niggli 1993). A 247
representative record of such an experiment is displayed in Figure 3B, showing that the 248
increase in Fluo-4 fluorescence was tightly associated with the decrease in Fura-Red 249
emission.
250
More importantly, loading cells with the cell permeable Ca2+ chelator BAPTA-AM 251
prevented the fluorescent events (Figure 3C). These results imply that the observed 252
fluorescence fluctuation was due to repetitive changes of [Ca2+]i. 253
Next, experiments were designed to identify the source of Ca2+. Exchanging the bath 254
to Ca2+-free saline neither influenced the amplitude, nor the shape of the spikes, whereas 255
spiking was abolished by 2 mM tetracaine (Figure 3D and E), which inhibits Ca2+-release 256
channels in this concentration. These results strongly suggest that Ca2+ was released from the 257
258 ER.
259
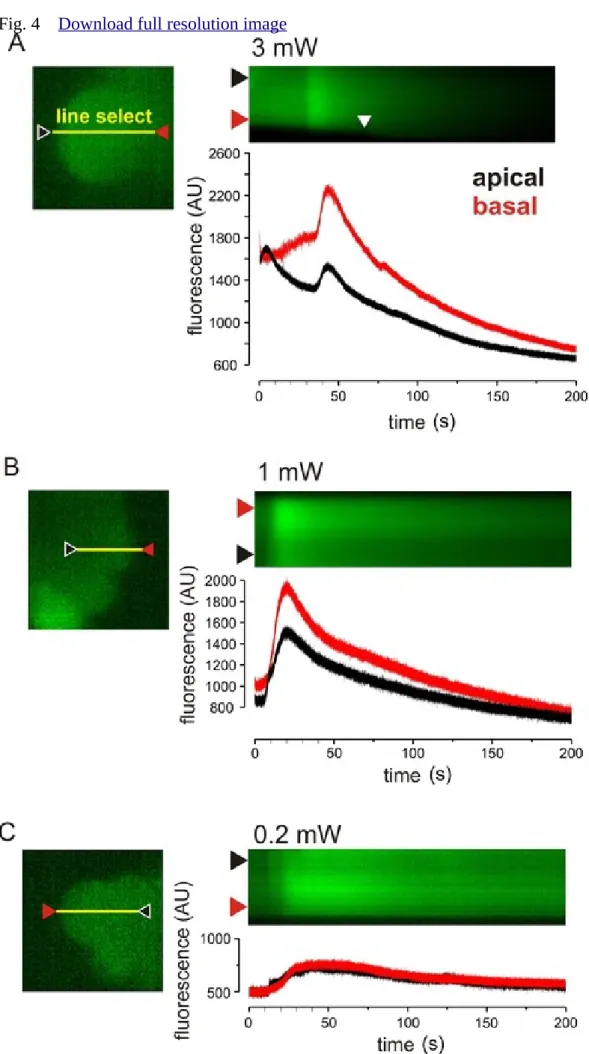
Ca2+ oscillations on line scan images 260
Because the spatio-temporal characteristics of Ca2+ signals are often visualized in line-scan 261
mode, we investigated whether Ca2+-release can be provoked in this mode too, when a single 262
pixel line is excited repetitively at the rate of 500 times per second, at laser intensities ranging 263
from 0.2 mW to 3 mW (2–30 µW). In Figure 4A–C, representative time series line-scan 264
recordings and plots are shown. The scanning line was set across the cell in the apico-basal 265
direction (Figure 4A, B, C, left side, yellow lines). The frames used for the selection of the 266
line were always taken using 0.2 mW laser power output to prevent spontaneous Ca2+ release 267
during the line selection process. Brightness and contrast of the “line select” images were 268
improved after measurement to allow better visibility.
269
When the line was excited using 3 mW laser power (Figure 4A), a robust apico-basal 270
Ca2+ wave developed immediately (Figure 4, black line), which was followed by a second 271
one. Importantly, cell morphology only changed (i.e. blebbing developed) 75 s (37500 line 272
scans) after imaging started (Figure 4A, white arrowhead), much later than the Ca2+- 273
oscillations appeared. In order to prevent obvious signs of phototoxicity and to find the lowest 274
laser power required to elicit the oscillations, laser power was gradually decreased (Figure 275
4B, C). Although, excitation using 0.2 mW laser power setting did not cause measurable 276
photobleaching or cell damage, it still elicited significant Ca2+ release (Figure 4C). It has to be 277
mentioned that the 0.2 mW setting is the lowest possible laser emission setting and the 500 278
FPS is the lowest possible line scanning rate for the model of microscope used and both fell 279
below the typically used settings.
280
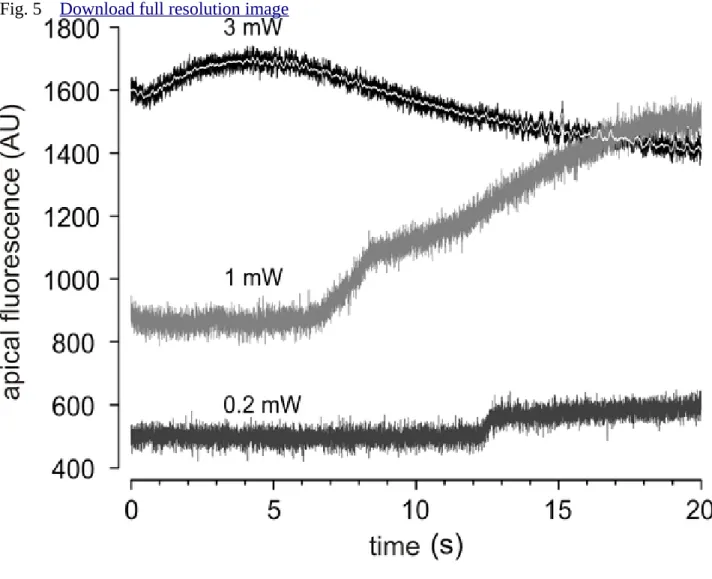
Line scan recordings at high temporal resolution of the apical region of the cells (Figure 5), 281
revealed proportional relationship between the laser power output and the onset of the Ca2+
282
signal.
283 284
Discussion 285
286
Overall, we report an uncommon, but significant methodological problem that exciting laser 287
radiation after conventional Fluo-4-AM loading protocol and microscope settings causes 288
intracellular Ca2+ release. Whilst earlier studies have shown that high illumination levels or 289
sustained illumination can lead to various cytotoxic effects (including Ca2+ transients) (Smyth 290
et al. 2010, Putney 2007), we have demonstrated that in case of our cells even very low levels 291
of excitation and dye-concentration may cause calcium oscillations. We wish to highlight that 292
these setting are well below the range normally considered safe for imaging (10–30 μW).
293
Notably, Knight et al. showed that 488 nm laser of similar power (15–30 μW) induced Ca2+- 294
oscillations in chondrocytes (Knight et al. 2003).
295
Based on our current data we propose that laser exposure of Fluo-4 or other dyes in the Fluo- 296
family produces an unknown derivative, which causes Ca2+-release from the ER by activating 297
IP3Rs. We found the that the changes in Fluo-4 fluorescence were due to changes in 298
intracellular Ca2+ levels and the source of Ca2+ was shown to be intracellular, because 299
removing extracellular Ca2+ did not suppress the Ca2+ waves. We have also shown that the 300
amplitude and calcium release kinetics of the laser-induced oscillations in mouse pancreatic 301
acinar cells are comparable to those triggered by 100 or 200 nM carbachol. The only major 302
intracellular compartment capable of such Ca2+ release is the ER. Although, RyRs are also 303
involved in the Ca2+ release process in pancreatic acinar cells, we tend to blame IP3Rs as a 304
culprit to initiate the oscillations, because skeletal muscle fibers that are poor in IP3Rs but 305
very rich in RyRs, (Fill and Copello 2002) do not show similar laser-induced events 306
(Csernoch 2007). In addition, HEK293 cells were reported to lack endogenous RyR channels, 307
but express IP3Rs (Tong et al. 1999, Alzayady et al. 2016).
308
Ca2+-wave expansion in our cells requires the dynamic cooperation of both, unevenly 309
distributed, but connected parts of the main intracellular Ca2+ compartment, the ER. IP3Rs are 310
primarily located in the apical ER, whereas RyRs can be found throughout the ER, but most 311
abundantly in the supranuclear-basal region. Therefore, physiological secretagogue 312
stimulation causes Ca2+ waves that are always initiated by IP3R activation on the apical side 313
of the ER and propagate towards the basal end via CICR (Petersen 2005, Petersen and 314
Tepikin 2008, Petersen 2014). The intracellular Ca2+ dynamics of laser-induced oscillations 315
are very similar to those of secretagogue-induced responses, further suggesting the major role 316
of IP3Rs in the process. The apico-basal propagation of calcium signal suggests the 317
involvement of IP3Rs in the initiation of the light-activated calcium signal. In Figure 5, the 318
stepwise increase of Ca2+-level on the apical side of cells triggered by 0.2 and 1 mW laser 319
power suggests that the waves might be formed by a multi-step process. This can be explained 320
by the sequential opening of Ca2+ channels or the exhaustion of Ca2+-buffering capacity of the 321
apical portion of the cell.
322
The current study initially investigated the mechanism of light induced artifacts in mouse 323
pancreatic acinar cells, but later revealed that the problem is not limited to this cell type and 324
looks to be a general phenomenon.
325
It should be highlighted that decreasing Fluo-loading may not offer an adequate 326
strategy to avoid laser-induced Ca2+ release in all cells because it compromises the signal to 327
noise ratio (the resting fluorescence at 1 mW was already only 3 times higher than the 328
background). Instead, we suggest finding the balance by minimizing both the level of dye 329
loading and the cumulative incident light intensity by using low imaging rate with the lowest 330
light intensity and dwell time possible. It must also be noted that in case of line-scan imaging 331
we could not prevent the formation of light- induced Ca2+ release even at the lowest possible 332
excitation level and lowest dye-loading.
333
In conclusion, during laser-scanning microscopy possible artifacts due to laser 334
excitation should be taken into account, even when low power settings are used and in some 335
cases laser scanning methods may not be useable for calcium imaging.
336 337
Acknowledgements. This work was supported by a grant provided to JA from the Hungarian 338
Scientific Research Fund (OTKA PD 112199). This research was supported by the European 339
Union and the State of Hungary, co-financed by the European Social Fund in the framework 340
of TÁMOP-4.2.4.A/2-11/1-2012-0001 ‘National Excellence Program’ (JV). JA is supported 341
by the Janos Bolyai Research Scholarship of the Hungarian Academy of Sciences and the 342
Lajos Szodoray Scholarship of the University of Debrecen.
343 344
References 345
Alzayady KJ, Wang L, Chandrasekhar R, Wagner LE, Van Petegem F, Yule DI (2016):
346
Defining the stoichiometry of inositol 1,4,5-trisphosphate binding required to initiate Ca2+
347
release. Sci Signal. doi: 10.1126/scisignal.aad6281 348 349
Bootman MD, Rietdorf K, Collins T, Walker S, Sanderson M (2013): Ca2+ sensitive 350
fluorescent dyes and intracellular Ca2+ imaging. Cold Spring Harb Protoc.
351
doi:10.1101/pdb.top066050 352
353
Collins T, Walker S, Sanderson M (2014): Ca2+-Sensitive Fluorescent Dyes and Intracellular 354
Ca2+ Imaging, In: MD Bootman, K Rietdorf (Eds.), Calcium techniques: A laboratory manual.
355
Cold Spring Harbor Laboratory Press. 42–46 356
357
Csernoch L (2007): Sparks and embers of skeletal muscle: the exciting events of contractile 358
activation. Pflugers Arch. 454, 869–878 359
360
Dixit R, Richard C (2003): Cell damage and reactive oxygen species production induced by 361
fluorescence microscopy: effect on mitosis and guidelines for non-invasive fluorescence 362
microscopy. The Plant Journal. 36, 280–290 363 364
Fedoryak OD, Searls Y, Smirnova IV, Burns DM, Stehno-Bittel L (2004): Spontaneous Ca2+
365
oscillations in subcellular compartments of vascular smooth muscle cells rely on different 366
Ca2+ pools. Cell Research. 14, 379–388 367
368
Fill M, Copello JA (2002): Ryanodine Receptor Calcium Release Channels. Phys Rev. 82, 369
893–922 370
371
Gee KR, Brown KA, Chen WN, Bishop-Stewart J, Gray D, Johnson I (2000): Chemical and 372
physiological characterization of fluo-4 Ca2+-indicator dyes. Cell Calcium. 27, 97–106 373
Geyer N, Diszházi G, Csernoch L, Jóna I, Almássy J (2015): Bile acids activate ryanodine 374
receptors in pancreatic acinar cells via a direct allosteric mechanism. Cell Calcium. 58, 160–
375 376 170 377
Grzelak A, ej Rychlik B, Bartosz G (2001): Light-dependent generation of reactive oxygen 378
species in cell culture media. Free Radical Biology and Medicine. 30, 1418–1425 379
380
Habara Y, Kanno T (1994): Stimulus-Secretion Coupling and Ca2+ Dynamics in Pancreatic 381
Acinar Cells. Gen Pharmac. 25, 843–850 382 383
Hoebe RA, van Oven CH, Gadella TWJ, Dhonukshe PB, van Noorden CJF, Manders EMM 384
(2007): Controlled light-exposure microscopy reduces photobleaching and phototoxicity in 385
fluorescence live-cell imaging. Nature Biotechnology. 25, 249–253 386
387
Johnston L, Sergeant GP, Hollywood MA, Thornbury KD, McHale NG (2005): Calcium 388
oscillations in interstitial cells of the rabbit urethra. J Physiol. 565, 449–461 389
390
Knight MM, Roberts SR, Lee DA, Bader DL (2003): Live cell imaging using confocal 391
microscopy induces intracellular calcium transients and cell death. Am J Physiol Cell Physiol.
392
284, 1083–1089 393 394
Leite MF, Burgstahler AD, Nathanson MH (2002): Ca2+ waves require sequential activation 395
of inositol trisphosphate receptors and ryanodine receptors in pancreatic acini.
396
Gastroenterology. 122, 415-427 397 398
Lewis RS (2007): The molecular choreography of a store-operated calcium channel. Nature.
399
446, 284–287 400 401
Lipp P, Niggli E (1993): Ratiometric confocal Ca2+-measurements with visible wavelength 402
indicators in isolated cardiac myocytes. Cell Calcium. 5, 359–372 403 404
McDonald A, Harris J, MacMillan D, Dempster J, McConnell G (2012): Light- induced Ca2+
405
transients observed in widefield epi-fluorescence microscopy of excitable cells. Biomed Opt 406
Express. 3, 1266–1273 407 408
Minta A, Kao JP, Tsien RY (1989): Fluorescent indicators for cytosolic calcium based on 409
rhodamine and fluorescein chromophores. J Biol Chem. 264, 8171–8178 410 411
Papp H, Czifra G, Lázár J, Gönczi M, Csernoch L, Kovács L, Bíro T (2003): Protein kinase C 412
isozymes regulate proliferation and high cell density-mediated differentiation in HaCaT 413
keratinocytes. Exp Dermatol. 12, 811–824 414
415
Pawley J (2006): Handbook of Biological Confocal Microscopy. Springer. 362–3658 416
417
Petersen OH (2005): Ca2+ signaling and Ca2+-activated ion channels in exocrine acinar cells.
418
Cell Calcium. 38, 171–200 419
420
Petersen OH (2014): Calcium signalling and secretory epithelia. Cell Calcium. 56, 282–289 421
422
Petersen OH, Tepikin VA (2007): Polarized calcium signaling in exocrine gland cells. Annu 423
Rev Physiol. 70, 273–299 424 425
Petersen OH, Tepikin AV (2008): Polarized calcium signaling in exocrine gland cells. Annu 426
Rev Physiol. 70, 273–299 427 428
Putney JW (2007): New molecular players in capacitative Ca2+ entry. Journal of Cell Science.
429
120, 1959–1965 430
431
Rohrbach P, Friedrich O, Hentschel J, Plattner H, Fink RHA, Lanzer M (2005): Quantitative 432
calcium measurements in subcellular compartments of Plasmodium falciparum- infected 433
erythrocytes. J Biol Chem. 280, 27960–27969 434 435
Smyth JT, Hwang SY, Tomita T, DeHaven WI, Mercer JC, Putney JW (2010): Activation and 436
regulation of store-operated calcium entry. J Cell Mol Med. 14, 2337–2349 437 438
Straub SV, Giovannucci DR, Yule DI (2000): Calcium Wave Propagation in Pancreatic 439
Acinar Cells. Functional Interaction of Inositol 1,4,5-Trisphosphate Receptors, Ryanodine 440
Receptors and Mitochondria. J Gen Physiol. 116, 547–560 441
442
Thomas D, Tovey SC, Collins TJ, Bootman MD, Berridge MJ, Lipp P (2000): A comparison 443
of fluorescent Ca2+ indicator properties and their use in measuring elementary and global Ca2+
444
signals. Cell Calcium. 28, 213–223 445
446
Tong J, Du GG, Chen SR, MacLennan DH (1999): HEK-293 cells possess a carbachol- and 447
thapsigargin-sensitive intracellular Ca2+ store that is responsive to stop-flow medium changes 448
and insensitive to caffeine and ryanodine. Biochem J. 343, 39–44 449 450
Yule DI (2015): Ca2+ Signaling in Pancreatic Acinar Cells. Pancreapedia: Exocrine Pancreas 451
Knowledge Base. DOI: 10.3998/panc.2015.24 452 453
Vukcevic M, Zorzato F, Spagnoli G, Treves S (2010): Frequent Calcium Oscillations Lead to 454
NFAT Activation in Human Immature Dendritic Cells. J Biol Chem. 285, 16003–160010 455
456
Wang T, Zhou C, Tang A, Wang S, Chai Z (2006): Cellular mechanism for spontaneous 457
calcium oscillations in astrocytes. Acta Pharmacologica Sinica. 27, 861–868 458
459
Williams JA, Korc M, Dormer RL (1978): Action of secretagogues on a new preparation of 460
functionally intact isolated pancreatic acini. Am J Physiol. 235, 517–524 461 462
463
Figure legends 464
Figure 1. Features of laser induced changes of Fluo-4 fluorescence in pancreatic acinar cells.
465
A. Bright-field microscopy image of a pancreatic acinar cell clump. B. C. D. Representative 466
time series fluorescent records of Fluo-4 loaded single acinar cells using 1, 3 and 0.5 mW 467
laser power settings, respectively. E. Laser power dependence of the latency of the first 468
fluorescence peak (* p < 0.01). F. Laser power dependence of the frequency of fluorescent 469
oscillation. G. Carbachol (cch)-induced Ca2+ oscillations in single pancreatic acinar cells.
470 471
Figure 2. Laser induced fluorescent oscillations in HEK293 cells and HaCaT keratinocytes.
472
A. B. Fluorescent images of Fluo-4 loaded (2 µM, 30 min) HEK293 cells and HaCaT 473
keratinocytes are shown before imaging (top). Representative fluorescent records using 1%
474
(for HaCaT) and 3% (for HEK293) laser settings. Different curves represent examples of 475
fluorescence of different cells.
476 477
Figure 3. The laser induced fluorescent oscillation is due to Ca2+-release from the ER.
478
Control representative curves are shown with dashed lines and treatments (of different cells) 479
are shown with solid lines. Each line is a representative fluorescence intensity curve of a cell 480
from a run. 3 runs (treatments) were performed for each condition on different groups of cells.
481
A. Fluorescent emissions recorded in pancreatic acinar cells under control conditions and in 482
the presence of the ROS scavenger DMPO. B. Fluorescent oscillations recorded in a cell, 483
which was co-loaded with Fluo-4-AM and Fura-Red-AM. C. The oscillations are abolished 484
by BAPTA-AM treatment. D. Replacing Ca2+ containing extracellular solution to Ca2+-free 485
medium did not influence the oscillatory pattern. E. Tetracaine diminished the laser-induced 486
Ca2+-release.
487 488
Figure 4. Spatio-temporal characteristics of laser-induced Ca2+-waves in line scan mode. A.
489
B. C. Line scan representative records and plots of cells using 3, 1 and 0.2 mW laser outputs, 490
respectively. The scanning line was placed across the cells in the apico-basal direction, as 491
indicated by the yellow lines. The apical regions of the cells are shown by black, whereas the 492
red arrowheads show the basal regions. The fluorescence changes of these regions are shown 493
by black and red curves, respectively.
494 495
Figure 5. High-resolution plot of the initial response to various levels of laser excitation in 496
line scan mode. The first 20 seconds of apical line scan representative records of Figure 4, 497
where laser power outputs of 3 mW (black with white centerline), 1 mW (dark grey) and 0.2 498
(ligh grey) mW were used.
499 500
Figure S1. Laser emission-evoked fluorescent oscillations in Fluo-4 AM-loaded pancreatic 501
acinar cells.
502
503
Figure S2. Laser emission-evoked fluorescent oscillations in Fluo-3 and 8 AM-loaded 504
pancreatic acinar cells.
505
Fig. 1 Download full resolution image
Fig. 2 Download full resolution image
Fig. 3 Download full resolution image
Fig. 4 Download full resolution image
Fig. 5 Download full resolution image