RESEARCH PAPER
Subnanoliter precision piezo pipette for single‑cell isolation and droplet printing
Barbara Francz1 · Rita Ungai‑Salánki2 · Éva Sautner1 · Robert Horvath3 · Bálint Szabó1,2
Received: 12 September 2019 / Accepted: 26 December 2019 / Published online: 16 January 2020
© The Author(s) 2020
Abstract
Although microliter-scale liquid handling with a handheld pipette is a routine task, pipetting nanoliter-scale volumes is challenging due to several technical difficulties including surface tension, adhesion and evaporation effects. We developed a fully automated piezoelectric micropipette with a precision of < 1 nanoliter, improving the efficiency of imaging-based single-cell isolation to above 90%. This improvement is crucial when sorting rare or precious cells, especially in medical applications. The compact piezoelectric micropipette can be integrated into various (bio)chemical workflows. It eliminates plastic tubes, valves, syringes, and pressure tanks. For high-quality phase-contrast illumination of the sample, e.g., cells or tiny droplets, we constructed rings of LEDs arranged concentrically to the micropipette. The same device can be readily used for single-cell printing and nanoliter-scale droplet printing of reagents using either fluorescent or transparent illumination on a microscope. We envision that this new technology will shortly become a standard tool for single-cell manipulations in medical diagnostics, e.g., circulating tumor cell isolation.
Keywords Nanoliter · Piezoelectric · Single cell · Droplet
1 Introduction
Liquid handling on the milliliter (ml) or microliter (µl) scale is a routine task in laboratories, e.g., with handheld pipettes. However, handling volumes under 0.1 µl is chal- lenging. Dynamics of tiny droplets is dominated by surface tension over gravity if the size of the droplet is smaller than the capillary length. For the interface between water and air at standard temperature and pressure, the capillary length is ~ 2 mm. Adhesion force between the small droplet and the solid surface of the pipette is also crucial on this
length scale. Quick evaporation of the small water droplet is a further difficulty. In fluidic systems, sealing keeps the fluid inside the tubes or channels. In most cases, the seal- ing is made from soft elastic materials: a variety of rub- bers or PTFE. As the fluid is encompassed partly by elastic materials, the control of its volume on the microscopic scale is cumbersome. However, when the volume of reagents is limited, e.g., in single-cell measurements, nanoliter (nl) - or picoliter (pl) -scale liquid handling is a major advantage.
Microfluidic chips A straightforward solution to handle tiny volumes of fluids is to use microfluidics with microme- ter-sized channels to conduct aqueous solutions. Integration of microfluidics into complex chips is very promising with a major goal of realizing lab-on-a-chip systems. Droplet- based microfluidics (Guo et al. 2012; Köster et al. 2008;
Agresti et al. 2010; Brouzes et al. 2009; Leung et al. 2012) works with subnanoliter water droplets suspended in an oil environment. However, a number of technical drawbacks of currently available microfluidics have appeared (Leung et al.
2012). These chips are very sensitive to the solid contamina- tion of the medium. Special and expensive oils with appro- priate surfactants are needed to maintain a stable emulsion.
In most cases, it is challenging to achieve the proper stability of the flow rate, not to mention transient effects before and
Electronic supplementary material The online version of this article (https ://doi.org/10.1007/s1040 4-019-2317-8) contains supplementary material, which is available to authorized users.
* Bálint Szabó
balintszabo1@gmail.com
1 CellSorter Company for Innovations, Erdőalja út 174, Budapest 1037, Hungary
2 Department of Biological Physics, Eötvös University, Budapest, Hungary
3 Nanobiosensorics Laboratory, Institute for Technical Physics and Materials Science, Centre for Energy Research, Hungarian Academy of Sciences, Budapest, Hungary
after establishing the required stationary flow. Single cells captured inside droplets can be separately DNA-barcoded, pooled and subsequently sequenced (Lee et al. 2016). How- ever, the phenotypic information of the individual cells is lost in this process. Thus, the DNA/RNA sequence cannot be correlated with the role of the specific cell in a tumor or developing tissue.
Piezo-dropping systems can inject nl- or pl-sized droplets through a micropipette (http://scien ion.com/; http://cyten a.com). Piezo-actuator in the injector generates a pressure wave injecting a drop out from the capillary. The injector cannot pull and deposit small volumes in the same cycle as a handheld pipette. This solution works only in air. Piezo- injector robots can be used for printing, but not for the pl–nl- scale sampling of fluids.
Microinjectors and FluidFM Microinjection down to femtoliter-scale precision using a glass micropipette is a well-known technology in cell biology (Takagi et al. 2007).
Microinjection can be also carried out with a microfluidic atomic force microscope (FluidFM) (Meister et al. 2009).
However, microinjectors cannot pull and inject the same fluid with high precision. Because of the long, macroscopic elastic tubing and sealing, these devices work with a large hysteresis, when they switched to inject after pulling the fluid.
SODA robot The error of the pull-and-inject process was minimized in a robot (Zhu et al. 2013) applying a 1-µl Ham- ilton syringe controlled by a syringe pump and connected to a glass micropipette with a 1-cm Tygon tube. However, such a state-of-the-art setup is hard to be routinely applied.
Even in this specialized system, the pull-and-deposit cycle could be realized with nanoliter precision only. Thermal volume fluctuations are also significant in the SODA robot.
Further disadvantage of the SODA robot is the inherently short, 1 cm tubing between the Hamilton syringe and the capillary, resulting in a hard to handle setup. Speed of this device is limited by the speed of the syringe pump. Ultimate precision of the SODA robot is also limited by the Hamilton syringe and syringe pump.
Single-cell isolation using a micropipette to pick cells on the basis of the microscopic image is a well-established method (Kurimoto et al. 2006; Hosokawa et al. 2009).
To increase the throughput and improve efficiency, semi- automated techniques applying motorized microscopes and micromanipulator emerged in the past few years (Sch- neider et al. 2008; Yoshimoto et al. 2013; Környei et al.
2013). Liquid handling precision of commercially available micropipette-based methods is limited by the long (~ 1 m) plastic tube connecting the micropipette to the vacuum tank (Környei et al. 2013; Salánki et al. 2014a; Ungai-Salánki et al. 2016). The elasticity of the tube causes hysteresis in the fluid flow on the nanoliter scale. The flow in the micropipette is affected by the elastic expansion of the tube, not only by
the vacuum or overpressure in the pressure tank. Although this limitation can be handled in research laboratories to achieve results in single-cell RNA sequencing (Kozlov et al.
2017; Ngara et al. 2018), circulating tumor cell (CTC) iso- lation (Winter et al. 2018), protein engineering (Piatkevich et al. 2018) or single-cell adhesion experiments (Salánki et al. 2014b; Sándor et al. 2016; Ungai-Salánki et al. 2019), it hinders their routine application in medical diagnosis.
Still, the simplicity and flexibility of the valve-controlled fluidic system have several advantages including its abil- ity to apply constant, stable and high vacuum, and thus high hydrodynamic force. The fluid volume picked up by the micropipette can set to be high (several µl), if needed.
This is useful when isolating strongly adherent cells or for measuring the cellular adhesion force. The background of the current development is the valve-controlled CellSorter instrument (http://singl ecell picke r.com/valve -contr ol) work- ing on a motorized microscope. A vacuum tank and an over- pressure tank are connected to the vertical micropipette via two high-speed fluid valves. After scanning the sample in a Petri dish and detecting the cells with computer vision or manually, the micropipette picks up the selected cells one by one by opening the valve between the micropipette and the vacuum tank. Then the single cell is deposited into a PCR tube by opening the valve between the overpressure tank and the micropipette (Környei et al. 2013; Salánki et al. 2014a).
In the current work, we optimized and applied a micropi- pette-based device to minimize its pickup volume and maxi- mize its precision. We developed a fully automated, com- pact piezoelectric micropipette combining high-resolution imaging with < 1 nl liquid handling accuracy (CellSorter Kft (2019) Piezoelectric micropipette PCT patent applica- tion HU 2019/000002), (http://singl ecell picke r.com/piezo -head). It eliminates plastic tubes, valves, syringes, and pressure tanks. It can isolate sensitive or rare cells or cells with > 90% efficiency. It can be applied for nl-scale droplet printing including single-cell printing.
2 Methods
Calibration of the piezo-actuator After opening the piezo pipette and fixing the piezo-head on a microscope (Zeiss), we measured the displacement of the free end of the piezo-actuator (PI Ceramic P-885.11) as a function of voltage starting from 0 V until + 100 V and then from + 100 V back to 0 V. Voltage steps between adjacent meas- urement points were applied in 50 ms linear ramps. We captured images of the actuator after each applied voltage step and compared all images to the first picture captured at 0 V voltage to calculate the displacements. We fitted the full data with a linear curve: y = 0.0727 ± 0.0055 [μm/V]
x + 0.9502 μm; R2 = 0.9008. The resulting 7.3 μm/100 V was in the range specified by the supplier (PI Ceramic).
Calibration of the piezo micropipette To quantify the liquid handling precision of the piezo micropipette, first, we generated a water droplet in 2 ml mineral oil in a hydro- phobic 35-mm Petri dish (Greiner). For the larger voltages of ± 50 V (100 ms linear ramp), ~ 0.1 μl water droplets was deposited with a 0.5-μl Hamilton syringe. For testing lower voltages of ± 5 ± 10 V (100 ms, linear ramp), ~ 20 nl water drops was prepared with an inner diameter (I.D.) 30-μm micropipette using an 1 × 1 mm2 NBR 70 O-ring and + 100 V. After generating the droplet, the micropipette approached the surface of the dish to a distance of 100 µm inside the droplet. We determined the change in the vol- ume of the water droplet with a 10 × or 20 × objective lens.
We focused the microscope onto the bottom of the droplet and measured the d1 diameter of the interface between the droplet and the dish, i.e., the diameter of the spherical cap missing from the droplet. We captured an image of the drop- let and fitted a circle onto its contour. We also measured the D1 diameter of the spherical droplet (Fig. 1c). Then we applied the positive or negative voltage step. Measurements were repeated at least three times. We measured again the d2 diameter of the bottom of the droplet and the D2 diameter of the spherical droplet. We calculated the volumes of the droplets based on d1, D1, d2 and D2 as follows:
We fitted the measured data with a linear function.
The resulting ΔV (nl) volume change of the droplet as a function of the applied voltage step ΔU (V) was as fol- lows: ΔV = 0.21* ΔU − 0.1329; slope: 0.21 ± 0.08 nl/V, R2 = 0.9929.
Nanoliter droplet printing under oil Water droplets were deposited with an I.D. 30–70-µm micropipette using a 3.5 × 1.1 mm2 FPM O-ring (Super Seal) by applying a volt- age step of 40–100 V (100 ms, linear ramp) under mineral oil or fluorinated oil in a 35-mm hydrophilic plastic Petri dish (Greiner). The droplets were considered to be spherical (1) Vdroplet=Vsphere−Vspherical cap,where
(2) Vspherical cap= hspherical cap∗ 𝜋
6(3r2+h2spherical cap), where (3) hspherical cap=R1,2−
√
R21,2−r1,22 , where
(4) R1,2= D1,2
2 ,
(5) r1,2= d1,2
2 .
caps. To calculate the volume of the water droplets on the hydrophilic surface, we measured the contact angle (θ) of a few representative droplets:
Ratio of droplet height (h) to the diameter (2r) of the droplet on the surface was 0.49 ± 0.05, resulting in θ = 82° ± 5°. Then we measured only the (2r) diameter of droplets and calculated their volumes as follows:
where h=0.98∗r.
We also calculated the full (theoretical) volume Vfull (nl) of pipetting from the calibrated displacement of the piezo- actuator and the dimensions of the O-ring as follows:
where RO-ring is the half of the inner diameter of the O-ring and rO-ring is half of the height of the O-ring.
Measuring fluid flow fluctuations in the piezo micropi- pette We measured the fluctuations of the fluid flow in an I.D. 30-µm micropipette using a 1 × 1 mm2 NBR 70 O-ring.
The piezo-head including the actuator and the micropipette was fixed horizontally by a magnetic holder on a micro- scope equipped with a 5 × objective lens. An I.D. 1.2-mm glass tube was filled with a suspension of 2-µm fluorescent red particles (Spherotech) diluted to 200 × in 0.1% Triton- X-100. Both ends of the glass tube were closed with one drop of mineral oil to prevent evaporation of the aque- ous suspension. The micropipette entered the tube until it reached the suspension of beads. We recorded the bead motility for 30-s intervals. We applied both positive and negative voltage steps to the piezo-actuator within these intervals and observed their effects on the microscope.
Particle tracking velocimetry (PTV) and flow calcula- tions We used PTV to calculate the volume of the flow in the glass micropipette triggered by a voltage step or driven by fluctuations without a voltage step. In each video, we could follow ~ 20 beads. We applied the Free-Video-to- JPG converter to extract the frames from the videos to JPG files. We used the TrackMate ImageJ plug-in (http://
image j.net/Getti ng_start ed_with_Track Mate) to analyze the trajectories of the beads. For detecting the beads in the images, we used the difference of Gaussian method (DoG detector) a feature enhancement algorithm that can be applied for blob detection and tracking. DoG is a band-pass filter removing high-frequency components representing noise and some low-frequency components representing large homogeneous areas in the image. After the beads were properly detected in the first frame, we (6) sin𝜃= 2rh
r2+h2.
(7) V = 1
6 𝜋h(
3r2+h2) ,
(8) Vfull=0.0727∗ ΔU∗ (RO-ring+rO-ring)2∗ 𝜋,
used the simple linear assignment problem (LAP) tracker particle-linking algorithm. We saved the bead trajectories in xml files for analyzing it with our MATLAB code to calculate the quantities described below. The cylindrical coordinate system was fixed to the axis of the micropipette with the axial coordinate of X measured from the tip of the micropipette and radial coordinate of R (Fig. 2a). Radial displacement of beads was negligible. We calculated the axial displacement (Fig. 2d):
of beads parallel to the axis of the micropipette.
We calculated the axial velocity of the beads:
(9) Δx(t) =x(t) −x(t− Δt),
(10) v(t) = Δx(t)
Δt .
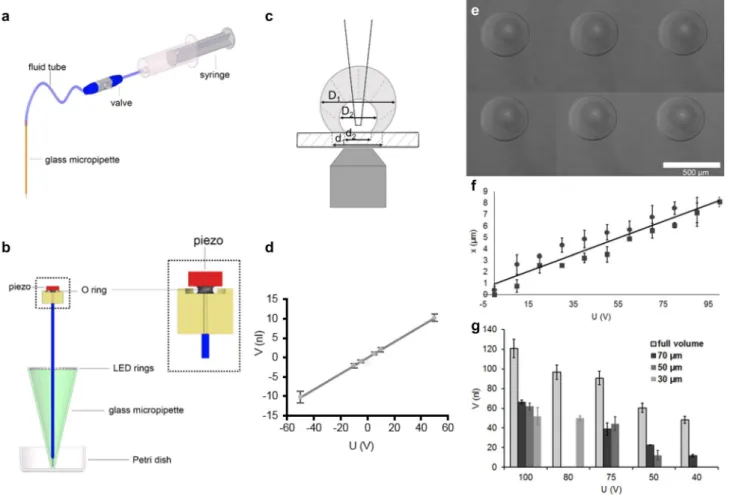
Fig. 1 Piezo micropipette. a Standard micropipette setup with an elastic tube and syringe. b Schematic representation of the piezo micropipette. The piezo-actuator at the top is pushed against an O-ring with a size in the [1–6] × 1 mm range. A glass micropipette is connected to the inner volume of the O-ring by a vertical chan- nel. These are all filled with water. Phase-contrast illumination is provided by a ring of LEDs arranged concentrically to the micropi- pette. c Principle of calibration. We measured the change in the vol- ume of an aqueous droplet previously deposited onto a hydrophobic surface under oil when applying voltage to the piezo using an 1 × 1 mm2 O-ring. Based on the droplet diameter (D1, D2) and the diam- eter of the contact area (d1, d2) before and after the voltage step, we calculated the volume change as a function of the applied voltage (Supp. Figure 3). As a result, we gained a calibration curve with a slope of 0.21 ± 0.08 nl/V (d). e–g Nanoliter droplet printing. e Water droplets printed with an I.D. 70-μm pipette (3.5 × 1.1 mm2 O-ring)
with + 75 V (100 ms, linear ramp) under mineral oil. According to the displacement of the piezo-actuator f in the [0 → 100 V] (rectan- gle) and in the [100 → 0 V] (circle) ranges, we calculated the full volume change of the pipette with a 3.5 × 1.1 mm2 O-ring. Hysteresis of the piezo-displacement was not significant in the 0 → + 100 → 0 V course. Volume of the printed droplets g was very uniform (Supp.
Figure 4). It was lower than the calculated full volume of pipetting, and it depended on the diameter of the micropipette (30, 50, 70 µm) due to the surface tension between water and oil. The Laplace pres- sure at the interface of water and oil due to surface tension is inversely proportional to the diameter of the micropipette when push- ing out a droplet from the micropipette. The minimum voltage we could successfully apply to print droplets was 80, 50 and 40 V in case of I.D. 30-, 50- and 70-µm micropipettes, respectively (we did not use I.D. 50- and 70-µm micropipettes at 80 V)
As the density of beads was low, we could not perfectly sample the parabolic velocity profile in the pipette. Thus, we calculated the estimated flow rate (Fig. 2e) based on the quickest bead with the following formula:
where A(x) is the cross-section of the micropipette at the location of the specific bead (Fig. 2a):
(11) Q(t) =v(t) ∗A(x),
(12) A(x) =Rpipette(x)2∗ 𝜋,
(13) Rpipette=tg𝛼
2(x+x0),
(14) x0= R0
tg𝛼
2
.
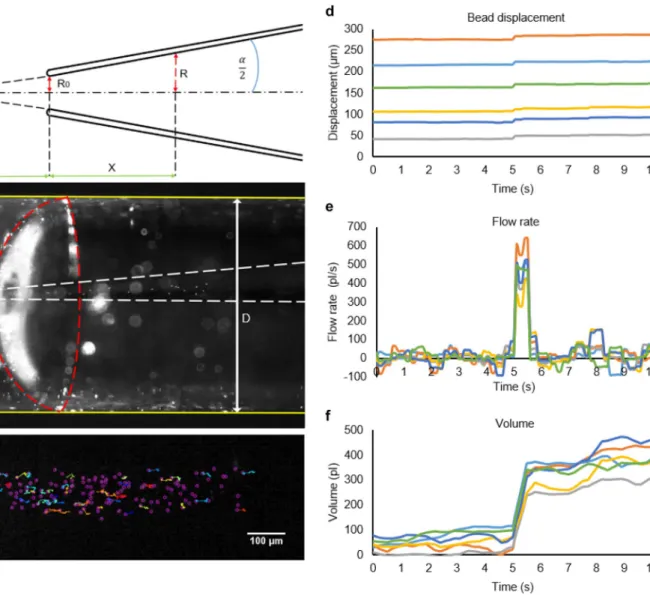
Fig. 2 Flow fluctuations in the piezo micropipette. a Geometry of the micropipette from a side view. We measured the cone angle (α = 6.3°) of the I.D. 30-µm micropipette and the radius of its aperture (R0). The cylindrical coordinate system was fixed to the axis of the micropipette with the axial coordinate X measured from the tip of the micropi- pette and radial coordinate R. The wall of the micropipette is shown by white dashed lines in b. We entered the micropipette into another glass tube with a diameter of D = 1.2 mm. This outer tube was filled with water-containing 2-μm fluorescent beads appearing as white dots on the left side of the image. Both ends of the water phase inside the outer tube were plugged by a droplet of oil to avoid evaporation. Red
dashed line indicates the interface between the water on the left and the oil in the right. When the micropipette was pushed inside into the outer tube from the right and reached the water phase, beads entered the micropipette. We tracked and analyzed the movement of the beads in the pipette (c). d Displacement of six selected beads in the micro- pipette as a function of time. A voltage step of + 6 V was applied at 5 min. We calculated the flow rate e from the bead displacements and the geometry of the micropipette. Calculated volume of the fluid flowing out from the micropipette is shown in f (See Suppl. Videos 1, 2.)
Finally, we calculated the flow volume V as the time integral of the flow rate Q (Fig. 2f):
3T3 cell culture Mouse embryonic fibroblasts (ATCC;
CCL-92) were grown in MEM supplemented with 10%
FCS (Sigma) according to the guidelines of the ATCC Cell Biology Collection. A subpopulation of the cells was stained by the lipophilic fluorescent dye, DiI (10 μM, 30 min at 37 °C, Invitrogen). Before sorting, 3T3 cells were treated with 1 × trypsin–EDTA solution (Gibco, 25300) for 6 min, at 37 °C; then, the cell suspension was centrifuged at 300 g for 2 min (Ungai-Salánki et al. 2016).
Jurkat cell culture The immortalized human T lympho- cyte cell line (ATCC; TIB-152) was grown in RPMI-1640 medium supplemented with 10% FCS (Sigma) according to the guidelines of the ATCC Cell Biology Collection.
A subpopulation of the cells was stained by the lipophilic fluorescent dye, DiI (100 μM, 15 min at 37 °C, Invitrogen);
then, it was centrifuged at 1500 RPM for 5 min.
HT-29 cell culture HT-29 colorectal adenocarcinoma cell line (ATCC; HTB-38) was cultured in McCoy’s 5A medium supplemented with 10% FCS according to the guidelines of the ATCC Cell Biology Collection. Before sorting, HT-29 cells were treated with 1 × trypsin–EDTA solution (Gibco, 25300) for 5 min, at 37 °C; then, the cell suspension was centrifuged at 900 RPM for 5 min.
3D printing microwells into Petri dish We printed min- iature multi-well plates with a height of 1 mm into plastic Petri dishes (Greiner). We applied a custom modified com- mercial 3D printer (Ultimaker) to print 4-well plates with four 5 × 5 mm2 squares into the 35-mm Petri dish (Ungai- Salánki et al. 2016).
PDMS microwells We molded 4-well inserts with four 5 × 5 mm2 wells from polydimethylsiloxane (PDMS, Dow Corning Sylgard 184). The PDMS elastomer and the curing agent were mixed in 10:1 ratio and molded into the molding form made from polyoxymethylene (POM).
PDMS was polymerized at room temperature overnight and peeled off from the molding form. We placed the PDMS inserts with a height of 1 mm into a hydrophobic Petri dish (Greiner).
Creating a thin layer of cell suspension in the microwells We covered all of the four wells by 20 µl cell culture medium to wet the surface of the hydrophobic 35-mm Petri dish.
We removed the excess culture medium from the well to be used for picking cells from it. We layered 2 ml mineral oil (Sigma) into the Petri dish. 1500–50,000 cells in 10–15 μl culture medium supplemented with 10% FCS were injected into one of the 5 × 5 mm2 microwells in the Petri dish.
(15) ΔV(Δt) =
Δt
∫
0
Q(t)dt.
Automated single-cell isolation from cell suspension We used an automated micropipette setup (CellSorter) (Környei et al. 2013; Salánki et al. 2014a) to detect and isolate single cells on a microscope. A piezoelectric actuator (PI Ceramic) controlled the volume of the micropipette. The micropipette with an inner diameter of 30 µm was coated by Sigmacote (Sigma-Aldrich) to avoid the adhesion of cells to the wall of the micropipette. We inserted the micropipette into the piezo-head and filled it with deionized water. We touched the surface of the Petri dish with the tip of the micropipette to precisely calibrate its vertical position (Környei et al.
2013). We scanned in the region of interest by capturing a mosaic image covering the whole or a part of the 5 × 5 mm2. Fluorescent cells were detected by computer vision using a local variance method for image segmentation implemented in the CellSorter software. For optimizing cell selection, the detection parameters (including sensitivity, cell brightness range and cell size) could be manually tuned. After select- ing cells for isolation, we ran the sorting process. Before picking up the first cell, culture medium was let into the micropipette to avoid the osmotic shock of cells. To achieve accurate cell targeting, we corrected cell coordinates using adaptive cell targeting (Ungai-Salánki et al. 2016). For pick- ing and depositing single cells, we applied a voltage step of
− 6 V (100 ms, linear ramp) and + 30 V (2000 ms, linear ramp), respectively. After depositing cells in a larger volume than we used for picking, we needed to reset the pipette to its initial position (voltage). Thus, we reset the pipette in each cycle of sorting in a cell-free reservoir of culture medium by applying − 24 V (2000 ms, linear ramp). The tip was positioned to 30 μm above the surface of the Petri dish when picking cells and to 50 μm when depositing cells in the reservoir. The deposition area was selected in the second well of the 4-well microplate. We used the third well as a reservoir. All steps of single-cell isolation were completed fully automatically controlled by software (CellSorter).
Cell viability assay We quantified the effect of the single- cell isolation procedure on cell viability using HT-29 cells.
Cells were deposited and cultured further in a new tissue cul- ture Petri dish. Isolated cells were incubated at 37 °C in 5%
CO2 for 2 h and then overnight. The survival rate was first checked after 2 h by counting the cells with normal adher- ent morphology. After overnight incubation, the medium was changed, and the fully spread cells were counted on the microscope. If a cell divided during the incubation time in the Petri dish, it was still counted as one cell only.
3 Results
We developed a compact piezoelectric micropipette (Fig. 1, Supp. Figures 1, 2) that can be easily automated and inte- grated into various (bio)chemical workflows. It eliminates
plastic tubes, valves, syringes and pressure tanks (Környei et al. 2013; Salánki et al. 2014a; Ungai-Salánki et al. 2016).
Its operation is similar to that of an eyedropper or hand- held pipette. For high-quality phase-contrast (Ph1 and Ph2) illumination of the sample, e.g., cells or tiny droplets, we constructed rings of LEDs arranged concentrically to the micropipette. Thus, our method can be fully automated using either fluorescent or phase-contrast illumination of live cells.
The micropipette (a sharp glass capillary) is connected to a piezo-actuator. Volume range of the pipette is set by the O-ring between the piezo-actuator and the glass micropi- pette. We applied various NBR 70 O-rings including 1 × 1, 3 × 1, 4 × 1 and 6 × 1 (I.D. × height) mm2 sizes with approxi- mate ranges of [0.2–10], [0.8–40], [1.2–60] and [2.5–125]
nl in the 1–50 V operating voltage range. Expansion of the piezo-actuator (Fig. 1b) pushing and deforming the O-ring decreases its inner volume (Supp. Figure 2). It results in a fluid flow in the micropipette and finally in an outflow from the micropipette to the Petri dish. When the piezo-actuator shrinks, the micropipette pulls fluid from the Petri dish. Liq- uid handling precision is determined by the piezo-actuator and thermal fluctuations in the pipette.
We calibrated the piezo pipette with a straightforward method by injecting water into an aqueous droplet in oil environment on a microscope (Fig. 1c, d, Supp. Figure 3).
We could routinely achieve subnanoliter precision when pipetting volumes in the range of 0.5–10 nl (Table 1).
We applied the piezo pipette for nl droplet printing using a 3.5 × 1.1 mm2 O-ring. We printed the aqueous droplets into grid patterns under oil (Fig. 1e, Supp. Fig- ure 4). Lateral coordinates of the droplets were set by software, and the entire printing process worked without human intervention. Printing any 2D pattern built up from nl droplets can be carried out in a similar way. We meas- ured the volume of the printed droplets (Fig. 1e, g) and compared it to the full volume change of the pipette calcu- lated from the displacement (Fig. 1f) of the piezo-actuator.
Piezo-displacement did not show significant hysteresis in the 0 → + 100 → 0 V course. We could control the volume of the printed droplets by the piezo-voltage in the 10–60 nl range. Printed droplets were uniform with a standard deviation of a few nls (Fig. 1g). Volume of the droplets was lower than the calculated full volume of pipetting, and it depended on the diameter of the micropipette due to the
surface tension between water and oil. (Laplace pressure pushing back the water into the pipette is inversely pro- portional to the diameter of the pipette.)
We quantified the microscopic fluctuations of the fluid flow in the micropipette with particle tracking velocime- try of fluorescent microbeads using a 1 × 1 mm2 O-ring.
Fluorescent microbeads were put inside a glass tube with mineral oil plugs at the ends to avoid evaporation (Fig. 2a, b). We laid down the micropipette to observe the motil- ity of beads on the microscope. We recorded the move- ment of the beads (Suppl. Videos 1, 2) and analyzed it with the ImageJ TrackMate software plug-in (http://image j.net/Getti ng_start ed_with_Track Mate) (Fig. 2c). We fol- lowed ~ 20 beads in each experiment and calculated the displacement of the beads as a function of time (Fig. 2d).
Flow rate and flow volume were determined on the basis of bead displacements (Fig. 2e, f, Supp. Figure 5). While the estimated flow rate of the peaks was 373 ± 29 pl/s, the average volume fluctuation rate was 36 ± 6 pl/s, resulting in a signal-to-noise ratio of 10.
We applied the piezo pipette for single-cell isolation from a suspension using a 1 × 1 mm2 O-ring. Cells were kept in a thin layer of the culture medium covered with oil in order to minimize the fluid flow and evaporation of the medium. We applied adaptive cell targeting (Ungai-Salánki et al. 2016) to achieve appropriate cell targeting with the I.D. 30-μm micropipette (Fig. 3a–d). We used three separate wells: one for picking, the second for depositing cells and the third to reset the piezo pipette. We applied a voltage of − 6 V (100 ms, linear ramp) to pick single cells in a volume of 1.25 ± 0.48 nl. We could improve the efficiency of single- cell isolation from the previous ~ 75% (Ungai-Salánki et al.
2016) to above 90% without removing any neighboring cell. Single-cell picking efficiency was 95 ± 1.2% (n = 82), 96 ± 5.8% (n = 48) and 91 ± 0.8% (n = 33) for 3T3, Jurkat and HT-29 cells (Fig. 3f–h), respectively. We deposited cells in a larger volume of 6 nl to achieve a deposition rate of 100% (Fig. 3e). The spatial resolution of cell sorting was 29 ± 3.6 μm, i.e., cells farther from the targeted cell than this distance were not removed (Fig. 3i, j).
We quantified the viability of isolated single cells, both 2 h and 1 day after isolation. 2 h after isolation, 93 ± 3% of the investigated (n = 30) cells were viable. After overnight incubation, 83 ± 9% of the isolated cells were viable.
Table 1 Calibration of the piezo micropipette
We calibrated the piezo micropipette by injecting (or pulling) water into (or from) a previously deposited water droplet under mineral oil on a microscope as a function of the applied voltage. While positive voltage step resulted in injection, negative voltage step pulled the water into the micropipette (Fig. 1c, d). We calculated the change in the volume of the droplet by measuring its diameter and the diameter of the contact area before and after applying the voltage (Supp. Figure 3). We used a 1 × 1 mm2 O-ring
Voltage (V) − 5 + 5 − 10 + 10 − 50 + 50
Volume (nl)(mean ± SD) − 0.64 ± 0.38 + 0.78 ± 0.35 − 1.44 ± 0.56 + 1.24 ± 0.51 − 11.05 ± 1.53 + 10.31 ± 0.95
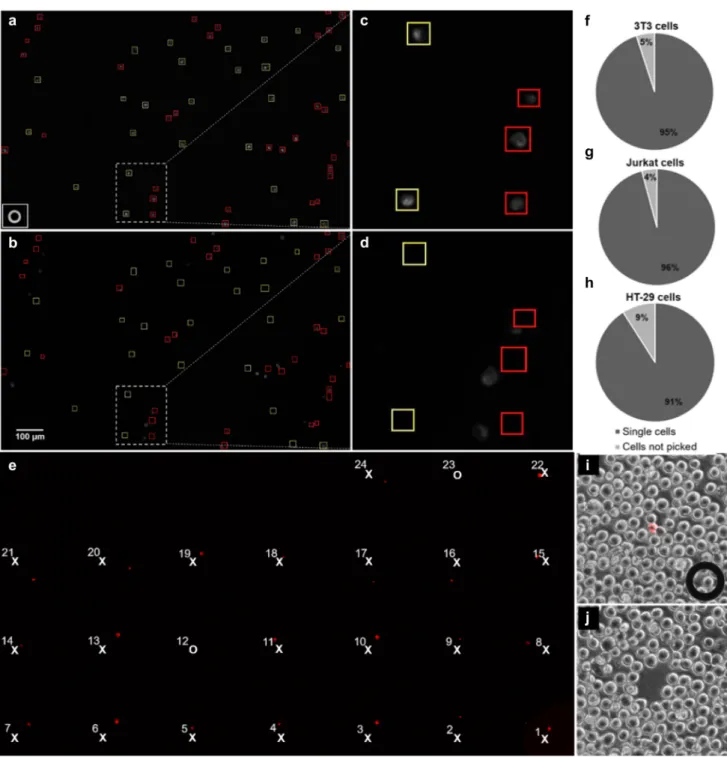
Fig. 3 Single-cell isolation. Mouse fibroblasts before (a) and after (b) single-cell isolation. c, d Zoom-ins on the region framed by the dashed lines in a, b. Tip of the I.D. 30-µm micropipette is shown in the corner of a. Yellow frames in a mark cells selected for isolation.
Cells in red frames too close to each other were excluded by the soft- ware to avoid picking up multiple cells. Frames at the same locations are shown in b. Comparison of images shows that targeted cells could be readily isolated without picking up cells in red frames, even if the cells were displaced from their initial locations due to the fluid con- vection in the dish. The entire isolation process could be followed and saved in the live view camera image for reviewing and documenting the experiment. In e, 24 single Jurkat cells were selected for isola-
tion into a grid pattern with a distance of 500 μm between cells. As picking of #12 and #23 cells was unsuccessful, the corresponding locations of the grid are empty. The efficiency of single-cell isolation f–h was above 90% in case of all cell types we tested. i A combined picture of the red fluorescent and the phase-contrast image of a region of cell culture of 50 fluorescent cells mixed to 50,000 unlabeled cells in a microwell. The fluorescent cell was picked up with a micropi- pette shown in the corner of the image. Four neighboring cells were also removed as seen in image j captured after picking. Measuring the distance between the centers of the targeted cell and the center of the farthermost removed cell, we calculated the spatial resolution (R) of sorting: R = 29 ± 4 μm
4 Discussion
We developed and calibrated a piezoelectric micropipette for liquid handling in the nanoliter range. The working principle and geometry of the pipette are very simple. It contains an elastic O-ring deformed by the piezo-actuator (CellSorter Kft (2019) Piezoelectric micropipette PCT patent applica- tion HU 2019/000002). Volume range of the pipette is set by the diameter of the O-ring; thus, the same device can be applied in different volume ranges by exchanging the O-ring.
Calibration of the micropipette proved that the device can be reliably used in the [1–10] nl range by the application of ~ [5–50] V. We measured the picoliter-scale fluctuations of the micropipette using particle tracking velocimetry. The average volume fluctuation rate was 36 ± 6 pl/s, resulting in a signal-to-noise ratio of 10.
We applied the device for nanoliter-scale aqueous drop- let printing under oil. We could control the volume of the printed droplets by the piezo-voltage in the [10–60] nl range.
Printed droplets were uniform with a standard deviation of a few nls. We also applied the device for single-cell isola- tion. It improved the efficiency of the imaging-based single- cell isolation to above 90% from the previous 75%. This improvement is crucial when sorting rare or precious cells, especially in medical applications. For high-quality phase- contrast imaging, we constructed rings of LEDs arranged concentrically to the micropipette. The micropipette can be fully automated using either fluorescent or transparent illumination on a microscope. We envision that this new technology will shortly become a standard tool for single- cell manipulations in medical diagnostics, e.g., circulating tumor cell isolation.
Acknowledgements Open access funding provided by Eötvös Loránd University (ELTE). This work was supported by the National Research, Development and Innovation Office (Grant numbers: PD 124559 for R. U. S., KH_17, KKP 129936 and ERC_HU for R. H.), “Lendület”
Program of the Hungarian Academy of Sciences for R. H., 2018-1.1.1- MKI-2018-00073 and VEKOP-2.1.7-15-2016-00146 European–Hun- garian innovation Grants for CellSorter.
Compliance with ethical standards
Conflict of interest Bálint Szabó is a founder of the CellSorter Com- pany for Innovations. Other authors declare no competing interests.
Open Access This article is licensed under a Creative Commons Attri- bution 4.0 International License, which permits use, sharing, adapta- tion, distribution and reproduction in any medium or format, as long as you give appropriate credit to the original author(s) and the source, provide a link to the Creative Commons licence, and indicate if changes were made. The images or other third party material in this article are included in the article’s Creative Commons licence, unless indicated otherwise in a credit line to the material. If material is not included in the article’s Creative Commons licence and your intended use is not permitted by statutory regulation or exceeds the permitted use, you will
need to obtain permission directly from the copyright holder. To view a copy of this licence, visit http://creat iveco mmons .org/licen ses/by/4.0/.
References
Agresti JJ, Antipov E, Abate AR et al (2010) Ultrahigh-throughput screening in drop-based microfluidics for directed evolution. Proc Natl Acad Sci USA 107:4004–4009. https ://doi.org/10.1073/
pnas.09107 81107
Brouzes E, Medkova M, Savenelli N et al (2009) Droplet microflu- idic technology for single-cell high-throughput screening. Proc Natl Acad Sci USA 106:14195–14200. https ://doi.org/10.1073/
pnas.09035 42106
CellSorter Kft (2019) Piezoelectric micropipette PCT patent applica- tion HU 2019/000002
Guo MT, Rotem A, Heyman JA, Weitz DA (2012) Droplet microfluid- ics for high-throughput biological assays. Lab Chip. https ://doi.
org/10.1039/c2lc2 1147e
Hosokawa M, Arakaki A, Takahashi M et al (2009) High-density microcavity array for cell detection: single-cell analysis of hemat- opoietic stem cells in peripheral blood mononuclear cells. Anal Chem 81:5308–5313. https ://doi.org/10.1021/ac900 535h http://cyten a.com. Accessed 10 Jan 2020
http://image j.net/Getti ng_start ed_with_Track Mate. Accessed 10 Jan http://scien ion.com/. Accessed 10 Jan 20202020
http://singl ecell picke r.com/piezo -head. Accessed 10 Jan 2020 http://singl ecell picke r.com/valve -contr ol. Accessed 10 Jan 2020 Környei Z, Beke S, Mihálffy T et al (2013) Cell sorting in a Petri
dish controlled by computer vision. Sci Rep 3:1088. https ://doi.
org/10.1038/srep0 1088
Köster S, Angilè FE, Duan H et al (2008) Drop-based microfluidic devices for encapsulation of single cells. Lab Chip 8:1110–1115.
https ://doi.org/10.1039/b8029 41e
Kozlov A, Jaumouillé E, Machado Almeida P et al (2017) A screen- ing of UNF targets identifies Rnb, a novel regulator of Dros- ophila Circadian rhythms. J Neurosci 37:6673–6685. https ://doi.
org/10.1523/jneur osci.3286-16.2017
Kurimoto K, Yabuta Y, Ohinata Y et al (2006) An improved single-cell cDNA amplification method for efficient high-density oligonu- cleotide microarray analysis. Nucleic Acids Res 34:e42. https ://
doi.org/10.1093/nar/gkl05 0
Lee H, Gurtowski J, Yoo S et al (2016) Third-generation sequenc- ing and the future of genomics. CoreGenomics. https ://doi.
org/10.1101/04860 3
Leung K, Zahn H, Leaver T et al (2012) A programmable droplet- based microfluidic device applied to multiparameter analysis of single microbes and microbial communities. Proc Natl Acad Sci 109:7665–7670. https ://doi.org/10.1073/pnas.11067 52109 Meister A, Gabi M, Behr P et al (2009) FluidFM: combining atomic
force microscopy and nanofluidics in a universal liquid delivery system for single cell applications and beyond. Nano Lett 9:2501–
2507. https ://doi.org/10.1021/nl901 384x
Ngara M, Palmkvist M, Sagasser S et al (2018) Exploring parasite heterogeneity using single-cell RNA-seq reveals a gene signature among sexual stage Plasmodium falciparum parasites. Exp Cell Res 371:130–138. https ://doi.org/10.1016/j.yexcr .2018.08.003 Piatkevich KD, Jung EE, Straub C et al (2018) A robotic multidi-
mensional directed evolution approach applied to fluorescent voltage reporters. Nat Chem Biol. https ://doi.org/10.1038/s4158 9-018-0004-9.A
Salánki R, Gerecsei T, Orgovan N et al (2014a) Automated single cell sorting and deposition in submicroliter drops. Appl Phyis Lett 105:083703. https ://doi.org/10.1063/1.48939 22
Salánki R, Hős C, Orgovan Norbert, Péter B et al (2014b) Single cell adhesion assay using computer controlled micropipette. PLoS One 9:e111450. https ://doi.org/10.1371/journ al.pone.01114 50 Sándor N, Lukácsi S, Ungai-Salánki R et al (2016) CD11c/CD18 domi-
nates adhesion of human monocytes, macrophages and dendritic cells over CD11b/CD18. PLoS One 11:e0163120. https ://doi.
org/10.1371/journ al.pone.01631 20
Schneider A, Spitkovsky D, Riess P et al (2008) “The good into the pot, the bad into the crop!”—a new technology to free stem cells from feeder cells. PLoS One 3:e3788. https ://doi.org/10.1371/
journ al.pone.00037 88
Takagi M, Saito K, Frederick C et al (2007) Fabrication and attachment of polyimide fill tubes to plastic NIF capsules. Fusion Sci Technol 51:638–642. https ://doi.org/10.13182 /FST51 -638
Ungai-Salánki R, Gerecsei T, Fürjes P et al (2016) Automated sin- gle cell isolation from suspension with computer vision. Sci Rep 6:20375. https ://doi.org/10.1038/srep2 0375
Ungai-Salánki R, Peter B, Gerecsei T et al (2019) A practical review on the measurement tools for cellular adhesion force. Adv
Colloid Interface Sci 269:309–333. https ://doi.org/10.1016/j.
cis.2019.05.005
Winter M, Hardy T, Rezaei M et al (2018) Isolation of circulating fetal trophoblasts using inertial microfluidics for noninvasive pre- natal testing. Adv Mater Technol 3(1–10):1800066. https ://doi.
org/10.1002/admt.20180 0066
Yoshimoto N, Kida A, Jie X et al (2013) An automated system for high-throughput single cell-based breeding. Sci Rep 3:1–9. https ://doi.org/10.1038/srep0 1191
Zhu Y, Zhang YX, Cai LF, Fang Q (2013) Sequential operation droplet array: an automated microfluidic platform for picoliter-scale liq- uid handling, analysis, and screening. Anal Chem 85:6723–6731.
https ://doi.org/10.1021/ac400 6414
Publisher’s Note Springer Nature remains neutral with regard to jurisdictional claims in published maps and institutional affiliations.