Excitation and inhibition in the thalamus
PhD thesis
Rovó Zita
Semmelweis University
Szentágothai János Neuroscience Doctoral School
Supervisor: László Acsády Ph.D, DSc Official opponents: Zita Puskár, MD, Ph.D
Zoltán Kisvárday, MD, Ph.D
Chairman of final examination: Béla Halász, MD, Ph.D, DSc Members of final examination: György Karmos, MD, Ph.D
Dobolyi Árpád, Ph.D
Budapest
2014
1. I
NTRODUCTIONThalamocortical information transfer is essential for normal cortical functions: thus, un- derstanding the principles of thalamic relay will help to clarify the basic principles of cortical operation. In my PhD projects I scrutinized the basic organizational and functio- nal principals of the thalamus using two model animals. I mapped the distribution of the excitatory giant terminals, which are the bases of the „driver theory”, in the thalamus of the rhesus monkeys. While I examined the role of extrasyinaptic vs. synaptic inhibition in the thalamocortical (TC) rhythms in a transgene mouse line.
1.1. The organization of the thalamus
The thalamus is the main relay in the brain, serves as a gateway between the outside world and the inner environment of the brain. Almost every sensation that we perceive reached our brain through the thalamus. The thalamus forms a relatively small structure in the middle of the brain and can be divided into several distinct cell groups, or „nuclei” each devoted to transmit a characteristic type of afferent signal (visual, auditory, somatosen- sory, cerebellar, etc.) to a structurally and functionally distinct, corresponding area of the cerebral cortex on the hemisphere. The thalamus relates to the largest part of the cortex, the neocortex.
1.2. The driver theory
The „driver theory” is an influential conceptual framework that describes the morpho- logical and functional bases of TC relay. According to the original concept, knowing the number of excitatory synapsis is not enough to determine the firing pattern of a neuron, rather the neurons are driven by specialized giant excitatory terminals (i.e., „drivers”) that form multiple release sites on the proximal dendrites of TC cells and secure faithful infor- mation transfer. At the electron microscopic level these are the RL-type (round vesicules, large diameter) terminals.
Sherman and Guillery divided the thalamus into two regions based on the origin of drivers. „First-order” thalamic relays receive drivers from subcortical centers (retina, spinal cord, cerebellum) and thus transmit visual, somatosensory, motor, etc., information, whereas „higher-order” relays are contacted by cortical layer 5 pyramidal cells and can participate in cortico-cortical information transfer via the thalamus. According to the core concept, the synaptic properties of cortical and subcortical drivers are similar, but the content of information to be transferred depends on the origin of the drivers.
The exact distribution of cortical versus subcortical drivers and their potential he- terogeneity in the thalamus is unknown. It is not clear whether cortical or subcortical drivers segregate spatially or whether drivers with different origin can intermingle. It has also not been examined whether every thalamic region always receives some type of large excitatory driver terminal or not. Finally, it is an open question whether large excitatory terminals are homogeneous or display nucleus-specific variability.
Although tract-tracing methods have provided an important foundation for our un- derstanding of TC networks, they are unable to resolve all afferents at the same time.
Thus, we used two well-established neurochemical markers, the vesicular glutamate tran- sporters 1 and 2 (vGLUT1 and vGLUT2), to label cortical and subcortical glutamaterg
inputs in the thalamus, respectively.
1.3. The contribution of synaptic vs. extrasynaptic inhibitory recep- tors to the phasic inhibition in the thalamus
In the healthy brain, network oscillations organize neuronal activity in space and time de- pending on the behavioural state, whereas, in several neurological and neuropsychiatric diseases, rhythmic activities are aberrant. A wealth of data indicate a major role of GA- BAergic cells in pacing various rhythms via GABAAreceptors in the cortex, hippocampus and thalamus. In these regions, pharmacological blockade of GABAAreceptors hampers normal oscillations and leads to aberrant epileptiform activity.
The pentameric GABAAreceptors can be assembled in a theoretically limitless num- ber of combinations using the various types ofα,β,γ, δ,�, θ, π and ρsubunits. In the mammalian brain, only a few dozens of subunit assemblies are found which so far have been classified into two fundamentally distinct types, synaptic and extrasynaptic recep- tors. For the synaptic clustering of GABAAreceptors, theγ2 subunit is essential. Recep- tors containing theγ2 subunit typically have fast kinetics, low sensitivity to GABA and fast desensitization, enabling them to conduct fast inhibitory postsynaptic events, typical for phasic inhibition. GABAA receptors containingδ instead ofγ subunits are abundant in extrasynaptic membranes, have higher sensitivity to GABA and are activated by am- bient GABA levels. These extrasynaptic receptors are primarily responsible for a slow, persistent (i.e. tonic) chloride current.
More recently, evidence is accumulating for a third type of GABAA receptor- triggered inhibition. This spillover-mediated form of transmission is caused by the dif- fusion of GABA from the synaptic cleft and allows phasic activation of GABAAreceptors not only in the synaptic cleft, but also in extrasynaptic locations, resulting in phasic inhi- bition with slowed-down kinetics. This phasic, non-synaptic form of inhibition is linked to neurogliaform cells in the hippocampus, cortex and amygdala, but is also present in the thalamus. The exact role of these three types of GABAAreceptors mediated inhibition in network oscillations has not been clarified yet.
Intuitively,γ2 subunit-containing GABAA receptors are the best candidates to cont- rol oscillations due to their fast kinetics; however, slow GABAAand even tonic forms of inhibition are essential for maintaining normal rhythmic activity. Classical pharmacolog- ical and knockout approaches are not suitable to answer these questions due to the lack of subunit and regional specificity, respectively. In this study, we used localized, virally me- diated gene knockout of synapticγ2-GABAAreceptors in the thalamus to unravel the role of synaptic vs. non-synaptic receptors in phasic inhibition. Thalamocortical cells express only a few of the potential combinations of GABAAreceptor subunits. Synaptic receptors are mainly represented by a combination ofα1,β2/3,γ2 subunits, whereas non-synaptic receptors contain α4, β2/3 andδ subunits. As a consequence, deleting theγ2 gene in a region-specific manner allowed us to determine the contribution of synaptic vs. extrasy- naptic inhibition to TCactivity. The presynaptic, GABAergic, nucleus reticularis thalamic neurons are known to fire preferentially in bursts during sleep and in a tonic manner du- ring the wake states. This allowed us to test which receptor pools are reached during these different modes of activity.
2. A
IMS1. To map the type and origin of excitatory driver inputs in the macaque thalamus at the light microscopic level.
2. To examine the convergence and segregation of the driver inputs.
3. To compare the RL-type terminals of different origin in the thalamus at the electron microscopic level.
4. To knock down the GABAAreceptorγ2 subunits of the thalamus ofγ2-floxed ani- mals by virally-mediated gene transfer.
5. To verify the elimination of theγ2 subunits from the plasma membrane at the light microscopic level.
6. To verify the elimination of theγ2 subunits from the thalamic relay cells usingin vitroelectrophysiological techniques.
7. To determine the contribution of synaptic vs. extrasynaptic inhibition to TC activity 8. To test which inhibitory receptor pools are reached during the different modes of
presynaptic activity.
3. M
ATERIALS AND METHODS3.1. Immunocytochemical procedures of the monkey thalamus
After perfusion with fixative, the monkey brains were removed from the skull and co- ronal serial sections (50 µm thick) were cut from the thalamus with a vibratome. Af- ter the appropriate pretreatments (cryoprotection, borohydride treatment, blocking of aspecific binding sites) the sections were processed for immunostaining. The follo- wing primary antibodies were used for light and electronmicroscopic studies: guinea pig anti-vGLUT1 (1:5000–1:10,000; Millipore Bioscience Research Reagents), rabbit anti- vGLUT1 (1:10,000; Synaptic Systems), mouse anti-vGLUT2 (1:3000–1:4000; Millipore Bioscience Research Reagents), rabbit anti-vGLUT2 (1:3000–1:4000; Synaptic Systems), mouse monoclonal anti-calbindin (1:2000; Swant), rabbit anti-calbindin (1:2000; kind gift from K. G. Baimbridge, University of British Columbia, Vancouver, BC, Canada).
Sections were treated with the respective biotinylated secondary antibodies (2 h at 1:300; Vector Laboratories) and then with avidin–biotin horseradish peroxidase complex (ABC; 2 h at 1:300; Vector Laboratories). The immunoperoxidase reaction was devel- oped with nickel-intensified 3.3’-diaminobenzidine (DAB-Ni) as a chromogen (black re- action product). All sections were postfixed, dehydrated and then embedding in Durcupan (ACM; Fluka).
Three animals received unilateral injections of biotinylated dextran amine [BDA;
10,000 molecular weight (Invitrogen). Two of the injections targeted the primary and supplementary motor areas, one the internal capsule. BDA was visualized by ABC and DAB-Ni. For correlated light and electron microscopy of the tracer and vGLUT2, BDA was visualized by ABC, and DAB-Ni and vGLUT2 were visualized by anti-rabbit vG- LUT2, ImmPRESS, and DAB, which has a brown reaction product.
For double labeling of the two vGLUTs, two combinations were used. For exami- nations at the light microscopic level, rabbit anti-vGLUT2 (1:3000) and guinea pig anti- vGLUT1 (1:10,000) were mixed. Next, the sections were treated with anti-rabbit ImmP- RESS reagent (1:2 in TBS; Vector Laboratories) and developed with DAB-Ni (black re- action product). This was followed by biotinylated goat anti-guinea pig and ABC. The second immunoreaction was visualized by DAB alone (brown reaction product). The sections were dehydrated as above, and 7% sucrose was added to the OsO4 solution to preserve colour differences.
For electron microscopic analysis, a mixture of rabbit anti-vGLUT1 (1:5000) and mouse anti-vGLUT2 (1:3000) was used. First, vGLUT1 was visualized using gold- conjugated goat anti-rabbit (1:50; Aurion) and silver intensification, followed by vGLUT2 visualization by ABC and DAB. After the mapping of immunogold and DAB pozitive ter- minals regions were selected for reembedding. 60 nm-thich serialsections were cut with an ultramicrotome and prepared for electron microscopic analysis. Postembedding GABA reaction were done on every second grid (rabbit anti-GABA (1:2000, 1:6000, kind gift from Péter Somogyi, University of Oxford, UK).
For double fluorescent immunostainings and detection of the tracer, the sections were incubated with rabbit anti-vGLUT1 (1:5000, in 0.5% Triton X-100) and mouse anti-vGLUT2 (1:3000), followed by a treatment with Cy3-conjugated donkey anti-rabbit (1:500; Jackson ImmunoResearch), Cy5 donkey anti-mouse (1:500; Jackson Immuno- Research), and streptavidin-conjugated Alexa Fluor 488 (1:2000; Invitrogen), or Cy5
donkey anti-rabbit, Alexa Fluor 594 goat anti-mouse, and streptavidin-conjugated Alexa Fluor 488.
For postembedding fluorescent immunostaining semithin sections were prepared.
Briefly, sections were embedded into Durcupan without OsO4pretreatment. After reem- bedding the tissue, 500 nm-thick sections were cut, mounted on slides, and etched using saturated sodium ethanolate. The immunoreactions were performed in Petri dishes using drops of primary and fluorescent secondary antibodies as described above.
The borders of the thalamus were drawn by camera lucida at low magnification. The exact ventral borders with zona incerta and the caudomedial border with the brainstem were established by the characteristic dense vGLUT1 immunostaining of the thalamus.
The distribution of large vGLUT1 and vGLUT2 terminals were mapped on a montage of the low-power images of the thalamus and the camera lucida drawings by screening the whole sections with the 40x and 63x objectives. The maps were finally matched with the corresponding stereotaxic level. Neighboring vGLUT1- and vGLUT2-immunostained sections were mapped at 500µm intervals. The borders drawn with the light microscope were verified using electron microscopy. Finally, a composite map was drawn using the individual maps of the seven animals.
At the electron microscopic level, we decided to measure the cross-sectional area of a large number of terminals on single sections (n = 695) as a best proxy for terminal size. To compare the size of RL terminals in different nuclei, the following criteria were used for the measurements: the terminals should contain multiple active zones and/or puncta adherentia and at least four mitochondria. RL terminals meeting our criteria were outlined, and their cross-sectional areas were measured by NIH ImageJ.
3.2. In vitro electrophysiological and immunhistochemical procedu- res of the γ 2 floxed mice
Adult GABAARγ277Ilox (γ2 floxed) and C57Bl/6J mice from both genders were used for the experiments. All experimental procedures were performed according to the ethi- cal guidelines of the Institute of Experimental Medicine of the Hungarian Academy of Sciences and the University of Lausanne and approved by the local Ethical Committees and Veterinary Offices of the Canton de Vaud. AAV2/1-CMV-CRE (AAV-Cre) and/or AAV2/1-CMV-eGFP (AAV-GFP) virus (100-300 nL; 1012 GC/mL; Vector Biolabs) were injected into the somatosensory thalamus.
For whole-cell patch clamp recordings, mice (P26-P41) were sacrificed after 1 - 3 weeks of viral injection. Horizontal slices (300 µm) containing the VB and nRT were prepared and recorded at RT except when noted otherwise. For eIPSCs, a monopolar stimulation electrode was placed in the nRT in a position radial to the recorded TC cell and the nRT-TC border; then, the cells were recorded at34◦C. Monophasic IPSCs were elicited at 0.2 Hz or 10 Hz with 250µA stimulation intensity. For monitoring evoked burst IPSCs, the cells were held at -30 mV, in which condition the use of glutamate receptor antagonists is not necessary. Burst IPSCs were evoked once every30−60s with 250µA stimulation intensity.
For tonic GABA currents, all-point histograms of amplitude values were generated from 20-s segments before and during drug application (gabazine 10µM) and fitted by single Gaussian distribution. Off-line analysis of sIPSC and eIPSCs were performed using
MiniAnalyis 6.0 (Synaptosoft) and Clampfit V.10.2, respectively. Means of 4 successive responses were used for analysis and amplitudes calculated with respect to the baseline prior to stimulation. Instead of 10 - 90% rise-time constant, time-to-peak was determined, as the burst IPSC is a multiphasic event. To determine burst IPSC decay, responses were fit with mono-exponential time constant.
Standard immunohistochemical reactions were used to detect Cre, γ2, α1, vGAT, vGLUT2, NeuN, gephryrin,β2 or parvalbumin immunoreactivity. Neurobiotin and biocy- tin were revealed by fluorescent labeling or diamino-bezidin reactions.
For data acquisition of Stochastic Optical Reconstruction Microscopy (STORM) images, the method described by Dani et al., 2010 and Nikon-STORM-C2 system was used.
Statistical significance was assessed using Student’s t-test or Mann-Whitney U test based on the normality level of the dataset and p < 0.05 was considered statistically sig- nificant. In both text and figures, data are presented as means±SD or as whisker plots.
4. R
ESULTSI.
4.1. The map of drivers in the primate thalamus
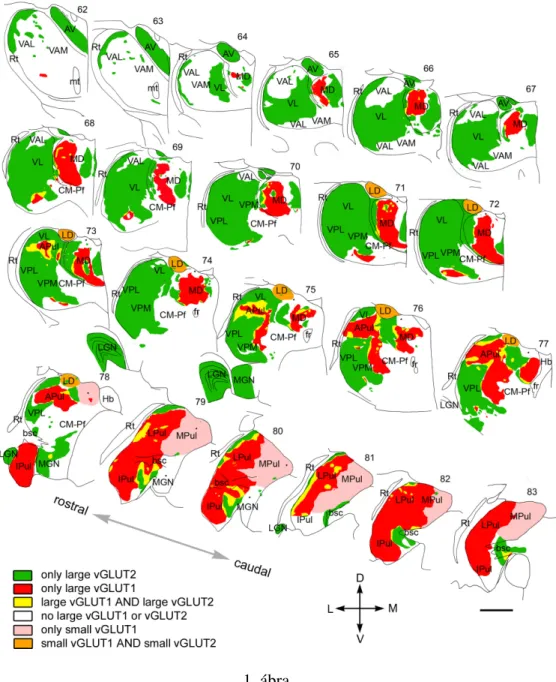
Based on the light and electron microscopic results, we prepared a complete map of driver distribution in the primate thalamus (Figure 1). The map indicates the origin (cortical vs.
subcortical), the size (large, medium, or no drivers), as well the convergence or segrega- tion of drivers with different origin. Based on the exact composition of driver assembly, six different thalamic territories could be distinguished: (1) regions innervated exclusively by large vGLUT2 terminals (green), (2) regions innervated exclusively by large vGLUT1 terminals (red), (3) regions receiving both vGLUT1- and vGLUT2-positive large termi- nals (yellow), (4) regions without RL terminals of any type (white), (5) regions innervated by small RL-type vGLUT1 terminals (pink), and (6) regions with small vGLUT1- and small vGLUT2-positive RL-type terminals (orange). These territories primarily but not entirely overlapped with previously established nuclear borders (Figure 1). vGLUT1 and vGLUT2 immunostainings were suitable to delineate thalamic territories with significant clinical relevance. Large vGLUT2 terminals delineated the borders of cerebello-recipient thalamus and basal ganglia-recipient thalamic territories. The different driver composition enabled us to identify the borders between the pulvinar and the surrounding sensory and motor regions. Conversely, the similar driver composition did not allow us to distinguish somatosensory VPM/VPL and the motor ventrolateral nucleus.
1. Based on their subcortical driver inputs, primary sensory nuclei, the cerebello- recipient thalamus, and the anterior nuclear group were considered as first order nuclei. Our data confirmed these predictions, showing that these nuclei are inner- vated exclusively and homogeneously by subcortical drivers and receive large exci- tatory inputs from no other sources. In addition to first-order nuclei, we also found pure subcortical drive in distinct thalamic zones previously regarded as higher or- der. Finally, our data demonstrated that large areas devoid of subcortical drivers.
2. Pure cortical drive was found in the central part of the mediodorsal nucleus and the pulvinar. The relay cell activity in these regions is only driven by the output of cortical layer 5 pyramidal cells and not by subcortical centers. Moreover, we found that both the mediodorsal nucleus, both the pulvinar posses heterogeneous driver inputs.
3. The organization principle of the drivers is dominated by their segregation. At the boundaries of first- and higher-order territories, however, large excitatory terminals of cortical and subcortical origin were observed in close proximity. So in this way, the thalamic cells in these zones are in a unique position to receive the convergence of information originating from cortical and subcortical centers.
4. In agreement with our previous results, in the thalamic territories contacted by the output of the basal ganglia (ventral anterior nucleus), no multisynaptic excitatory driver input (RL-type) could be detected. The role of the excitatory drivers may be replaced by giant inhibitory multisynaptic inputs.
5. Thalamic nuclei displayed large heterogeneity in the size and complexity of their driver terminals.
Figure 9. Mosaic of drivers in the primate thalamus. Distribution of cortical and subcortical excitatory terminals in the entire primate thalamus. The map is displayed at 22 coronal levels from anterior (top right) to posterior (bottom left) with 500!m intervals. It is based on observations from seven monkeys. Six different types of innervation pattern are distinguished based on the light andelectronmicroscopicdata.Largethalamicterritoriesreceiveexclusivelysubcortical(vGLUT2green)orcortical(vGLUT1,red)RLinputs.Convergenceofthetwoterminaltypes(yellow)isrestricted to border zones. Basal ganglia-recipient nuclei (VA) receive no discernible excitatory RL driver input (white). Cortical input from smaller RL drivers (pink) characterizes medial pulvinar and CM–Pf.
Finally, in the laterodorsal nucleus, the convergence of small cortical and small subcortical RL terminals were observed (orange). Single nuclei, especially the pulvinar and the mediodorsal thalamic nuclei, displayed considerable subnuclear heterogeneity in their driver distribution. Small dots indicate clusters of small vGLUT2-positive nerve endings encountered at the light microscopic level.
APul, Anterior pulvinar; AV, anteroventral; bsc, brachium of superior colliculus; CM–Pf, centromedian–parafascicular; fr, fasciculus retroflexus; Hb, habenula; Ipul, inferior pulvinar; LD, laterodorsal;
LGN, lateral geniculate nucleus; LPul, lateral pulvinar; MD, mediodorsal; MGN, medial geniculate nucleus; MPul, medial pulvinar; mt, mammillothalamic tract; VA, ventral anterior; VL, ventrolateral;
VPL, ventral posterolateral; VPM, ventral posteromedial; Rt, reticular thalamus. Scale bar, 2 mm.
Rovo´ et al.•Excitatory Afferents in the Primate Thalamus J. Neurosci., December 5, 2012•32(49):17894 –17908• 17905
1. ábra.
6. We proved that the intralaminar nuclei are heterogeneous regarding their driver in- puts: they receive only few cortical drivers, and their rostral parts are covered with small RL-type terminals.
7. Finally, we created a map based on the origin and size of the driver inputs, which is suitable for clinical use.
1. ábra. Mosaic of drivers in the primate thalamus. Distribution of cortical and subcortical excitatory terminals in the entire primate thalamus. The map is displayed at 22 coro- nal levels from anterior (top right) to posterior (bottom left) with 500 µm intervals. It is based on observations from seven monkeys. Six different types of innervation pattern are distinguished based on the light and electron microscopic data. Large thalamic ter- ritories receive exclusively subcortical (vGLUT2 green) or cortical (vGLUT1, red) RL inputs.Convergence of the two terminal types (yellow) is restricted to border zones. Basal ganglia-recipient nuclei (VA) receive no discernible excitatory RL driver input (white).
Cortical input from smaller RL drivers (pink) characterizes medial pulvinar and CM–Pf.
Finally, in the laterodorsal nucleus, the convergence of small cortical and small subcortical RL terminals were observed (orange). Single nuclei, especially the pulvinar and the me- diodorsal thalamic nuclei, displayed considerable subnuclear heterogeneity in their driver distribution. Scale bar, 2 mm.
5. R
ESULTSII.
5.1. Viral intervention successfully eliminates synaptic γ 2 subunits
In the non-infected thalamus,γ2-immunostaining resulted in dense punctate labeling, ref- lecting the predominantly synaptic localization of this subunit. In contrast, within the AAV-Cre-infected region, punctateγ2-immunoreactivity was not apparent. Next, we exa- mined the expression ofα1 subunits, which co-assemble withγ2 to form functional recep- tors, andα4-containing extrasynaptic GABAA receptor, which are responsible for tonic inhibition. In contrast to γ2, no difference was observed between the non-infected and infected thalamic regions.
5.2. Removal of γ2 subunits eliminates fast IPSCs
In the presence of glutamate receptor antagonists (DNQX 40 µM, D,L-APV 100µM), all TC cells recorded in the control slices displayed gabazine-sensitive fast spontaneous IPSCs at a frequency of 1.33± 0.89 Hz (n = 11). In contrast, fast rising sIPSCs were almost completely abolished from thalamocortial cells recorded inγ2−/−VB cells.
Activation of nRT fibers reliably elicited individual, fast eIPSCs (rise time < 1 ms, decay time < 4 ms) in 4 out of 5 control cells tested. In contrast, in the AAV-Cre-infected regions, eIPSCs were absent in 5 out of 6 TC cells recorded following both single and 10 Hz stimulation.
In AAV-GFP-infected control cells, application of the GABAA receptor antagonist gabazine (10 µM) to cells patched with chloride-based intracellular solutions led to an outward shift in the holding current (∆I = 53±19 pA, n = 7), reflecting the presence of a tonic current. Inγ2−/− VB cells, ∆I was significantly smaller (30± 14 pA, n = 9, p
< 0.05). Increased input resistance in AAV-Cre cells paralleled the reduced tonic current compared to the controls (255±110 MΩvs. 177±84 MΩ, ncontrol= 12, nAAV-Cre = 27, p < 0.05).
5.3. Burst mediated IPSCs persist in the absence of synaptic GABA
Areceptors in vitro
Burst firing occurs spontaneously in nRT cellsin vitro. Under these conditions, large mul- ticomponent IPSCs (burst IPSCs), originating from burst discharge of nRT neurons, are present in TC cells.Surprisingly, despite the absence of sIPSCs, we observed large spon- taneous inhibitory events in both control andγ2−/−TC cells. These typically occurred at low frequencies, (1.9±3.9/min vs. 1.7 ±2.0/min, ncontrol = 16 cells, nAAV-Cre = 13, ns.) singly or in groups of2−4events with interburst intervals of hundreds of millise- conds, reminiscent of spontaneous repetitive nRT burst discharge.
In control cells, these events showed the typical waveform of burst IPSCs consisting of multicomponent fast events riding on a slower current envelope. In contrast, inγ2−/− TC cells, burst IPSCs consisted of only the slow current envelope and lacked the fast phasic inhibitory currents.
6. C
ONCLUSIONSIn the first study, our mapping data disclosed large heterogeneity in the organization of the major inputs to the thalamus. In contrast to the general assumption that the major role of the thalamus is to relay peripheral information to the cortex, our data show that the larger part of the primate thalamus is devoid of giant subcortical glutamatergic terminals.
In addition, contrary to the stereotyped view of TC relay cells being driven by the ac- tivity of giant excitatory terminals, our data indicate variable composition of the major excitatory/inhibitory afferents. Because the message relayed in the thalamus depends on the size and origin of the driver terminals, our data imply substantial variability in the type of computation performed by different TC cells. Our data can serve as a framework to explain primate behavioural results and can be used to understand the morphological bases of human neurological diseases involving the thalamus.
In the second study, we identified a previously unrecognised discharge mode-specific mechanism of inhibition at a long-studied synapse implicated in pacemaker activity. The synapse’s main function is to synchronize TC cells to recruit them into oscillatory ac- tivity. Our data imply a complex organization of the synapse and a fine-tuned coopera- tion between different GABAAreceptors according to the discharge mode. The molecular constitution of thalamic GABAA receptors is central to our understanding of TC synch- ronization during sleep, as synaptic GABAA receptors are the targets of many hypnotic and sedative drugs. Instead, we now propose that a non-synaptic receptor controls major TC oscillations found during sleep. Our findings provide a compelling explanation for the specific roles of different GABAAreceptors in distinct behavioural states, and thus, open novel avenues to the development of drugs that act specifically on receptor subtypes cont- ributing to burst IPSCs. These would have the unique potential to boost sleep, yet protect phasic inhibition mediated by tonic discharge and associated wake-related functions.
7. P
UBLICATIONSPublications emerging from graduate work
1. Rovó Z, Ulbert I, Acsády L. (2012) Drivers of the Primate Thalamus. J Neurosci.
32(49):17894 –17908
2. Bodor ÁL, Giber K,Rovó Z, Ulbert I, Acsády L. (2008) Structural Correlates of Efficient GABAergic Transmission in the Basal Ganglia–Thalamus Pathway. J Ne- urosci. 28(12):3090–3102
Other publications
1. Wimmer RD, Astori S, Bond CT, Rovó Z, Chatton J-Y, Adelman JP, Fran- ken P, Lüthi A. (2012) Sustaining Sleep Spindles through Enhanced SK2- Channel Activity Consolidates Sleep and Elevates Arousal Threshold. J Neurosci.
32(40):13917–13928
2. Cazzin C, Piccoli L, Massagrande M, Garbati N, Michielin F, Knaus HG, Ring CJ, Morrison AD, Merlo-Pich E, Rovó Z, Astori S, Lüthi A, Corti C, Corsi M. (2011) rKv1.2 overexpression in the central medial thalamic area decreases caffeine-induced arousal. Genes Brain Behav. 10(8):817-27.
3. Bíró A,Rovó Z, Papp D, Cervenak L, Varga L, Füst G, Thielens NM, Arlaud GJ, Prohászka Z. (2007) Studies on the interactions between C-reactive protein and complement proteins. Immunology. 121(1):40-50