Inhibitory Control and Integration in the Thalamus
PhD Dissertation
Viktor Plattner
János Szentágothai Doctoral School of Neurosciences Semmelweis University
Supervisor: László Acsády, DSc
Official Reviewers: Magor Lőrincz, Ph.D
Anita Kamondi, MD, DSc
Head of the Final Examination Committee: Béla Halász, MD, DSc Members of the Final Examination Committee: György Karmos, MD, CSc
Bence Rácz, Ph.D
Budapest
2016
i
Table of Contents
Table of Contents i
List of Abbreviations iv
1 Introduction 1
1.1 Thalamus – the classical view 1
1.2 Connectional diversity of thalamic nuclei – the intralaminar group 2
1.3 Functional overview of the intralaminar nuclei 4
1.4 Afferents of the intralaminar nuclei 6
1.5 Inhibitory inputs in the thalamus 7
1.6 Glycinergic neurotransmission – novel sources of inhibition in the forebrain 9
1.7 Integration in the thalamus 11
1.8 Key points of the introduction 13
2 Objectives 14
3 Methods 15
3.1 Animal housing and treatement 15
3.2 Processing of human samples 15
3.3 Used transgenic animal strains 15
3.3.1 GlyT2::eGFP mouse line 15
3.3.2 GlyT2::cre mouse line 16
3.3.3 GlyT2::eGFP/Rbp4::cre mouse line 16
3.4 Morphology 16
3.4.1 Surgery 16
3.4.2 Standard procedure for immunohistochemistry and standard incubation times 17
3.4.3 Retrograde tracing and immunohistochemistry 19
3.4.4 Anterograde tracing and immunohistochemistry 20
3.4.5 Electron microscopy 23
3.4.6 Human tissues preparation 24
3.5 In vivo physiology 25
3.5.1 Surgery 25
3.5.2 In vivo juxtacellular recording and labeling, local field potential (LFP)
recording 25
3.5.3 Analysis 26
ii
3.5.4 In-vivo optogenetics and LFP recordings 27
4 Results 30
Part I – Novel source of inhibition in the thalamus 30
4.1 Distribution of glycinergic fibers in the thalamus, retrograde tracing, origin of the
pathway 30
4.2 Activity of glycinergic neurons in anaesthetized animals 34 4.3 Activation of the pathway, effects on thalamic neurons 39 4.4 Activation of the pathway in freely moving animals 43
4.5 Cortico-PRF Pathway 48
4.6 Spontaneus desynchronization, pharmacological inactivation 51
4.7 Electrical and optical activation 54
Part II – Integration in the thalamus 57
4.8 Integration in the thalamus - convergence of driver inputs on a single TC neuron 57
5 Discussion 62
5.1 Technical considerations 62
5.2 A novel source of inhibition in the thalamus 62
5.3 Cortical control of the extrathalamic system 65
5.4 Participation of the intralaminar thalamus in various tasks 66
5.5 Integration in the thalamus 67
6 Conclusions 69
6.1 Short- and mid-term goals 69
6.2 Perspectives 69
Summary 71
Összefoglalás 72
Bibliography 73
Bibliography of the candidate’s publications 79
iii
Acknowledgements 80
List of Figures 81
iv
List of Abbreviations
ABC avidin biotin peroxidase complex
AP action potential
APT anterior pretectum
BAC bacterial artificial chromosome BDA biotinylated dextrane amine BSA bovine serum albumin
CB calbindin
CeM central medial nucleus of the thalamus
Cg cingulate cortex
ChR2 channel rhodopsin 2
CL centrolateral nucleus of the thalamus CM center median nucleus of the thalamus CRS - R Coma Recovery Scale – Revised CSD cortical spreading depression
DAB diaminobenzidine
DAB-Ni nickel intensified diamino benzidine DBS deep brain stimulation
DNA deoxyribonucleic acid EEG electroencephalogram
eGFP enhanced green fluorescent protein
EM electron microscopy
EPSP excitatory postsynaptic potential
FG fluorogold
FR firing rate
GABA gamma amino butyric acid GlyT1 type 1 glycine transporter
v GlyT2 type 2 glycine transporter IL intralaminar thalamic nuclei IPSC inhibitory postsynaptic current ISI inter spike interval
KCl potassium chloride
L5 layer 5 of the cerebral cortex L6 layer 6 of the cerebral cortex LCN lateral cerebellar nucleus LFP local field potential LTD long term depression LTP long term potentiation
M2 secondary motor cortex
MCS minimal conscious state
MD mediodorsal nucleus of the thalamus
MFR mean firing rate
MUA multiunit activity
NMDA N-methyl-D-aspartate receptor
PB phosphate buffer
PC paracentral nucleus of the thalamus Pf parafascicular nucleus of the thalamus PHAL Phaseolus vulgaris leucoagglutinin PnC nucleus pontis caudalis
PnO nucleus pontis oralis
POm posterior nucleus of the thalamus PRF pontine reticular formation PSTH peristimulus time histogram Rbp4 retinol binding protein 4
vi RDP Rapid onset dystonia-Parkinsonism ROI region of interest
S1 primary somatosensory cortex SNr substantia nigra pars reticulata STA spike triggered average
SWS slow wave sleep
TBS tris-buffered saline
TC thalamocortical
Thy1 thymus cell antigen 1 TRN thalamic reticular nucleus
VA ventral anterior nucleus of the thalamus vGAT vesicular GABA transporter
vGluT1 type 1 vesicular glutamate transporter vGluT2 type 2 vesicular glutamate transporter vIAAT vesicular inhibitory amino acid transporter VL ventrolateral nucleus of the thalamus VM ventromedial nucleus of the thalamus
VPM ventral posteromedial nucleus of the thalamus
Zi zona incerta
1
1 Introduction
The thalamus is situated between the highly developed cerebral cortex and the evolutionarily older hindbrain structures. In primates its two sides are only connected by the adhesio interthalamica, while in rodents they are united. The thalamus is the largest area of the diencephalon, and it has two parts with developmentally different origins. One is the dorsal thalamus that includes the cortical-projecting thalamic nuclei, and it is generally refered to as thalamus. The other is the ventral thalamus that holds the GABAergic (gamma amino butyric acid) cells of the thalamic reticular nucleus (TRN), which play a key role in thalamocortical oscillation genesis (Barthó et al., 2014). The main cell type of the thalamus is called - for historical reasons - the thalamic relay cell or, based on a more recent terminology, the thalamocortical (TC) cell. In this thesis I will refer to thalamic neurons either as relay cells or as TC neurons depending on their connectivity and role in information transmission.
1.1 Thalamus – the classical view
-According t o the cl assi cal vi ew , t he thalamus s er ves as a r elay stati on for ascending sensor y information arri ving from s ens or y organs that t hen travels on towards t he cer ebral cort ex for processi ng - (Le Gros Clark, 1932; A. Earl Walker and Walker, 1936; Walker, 1938). Thus, its only role was thought to be the faithful transmission of these sensory messages without failure or modification. Several thalamic nuclei certainly fullfill this role. These nuclei receive their main excitatory „driver” (Sherman and Guillery, 1998, 2001; Guillery and Sherman, 2002; Bickford, 2015) input from sensory subcortical areas, and send their axons to layer 4 of a specific cortical region with well defined function (Fig. 1.2.1 a) (Herkenham, 1980; Jones, 2007; Clascá et al., 2012, 2016).
Based on the terminology of Sherman and Guillery, we can refer to these regions as first order nuclei (Sherman and Guillery, 2001). For a long time, these nuclei served as the model of the organization principle of thalamocortical connectivity, and the classical view of the thalamus was generalized from their properties. Besides their innervation and projection pattern within these regions, both the morphological and physiological features of relay cells
2
and sensory axons indeed support faithful information transmission. Fibers carrying sensory information target the thick proximal domain of relay cell dendrites and form large glutamatergic driver terminals with multiple release sites (Sherman and Guillery, 2001;
Bickford, 2015). These terminals display high initial release probability and evoke fast-rising excitatory postsynaptic potentials (EPSP) with large amplitude (Sherman and Guillery, 1998;
Deschenes et al., 2003). Repetitive activation of these inputs results in frequency-dependent depression of the postsynaptic response (Bickford, 2015).
1.2 Connectional diversity of thalamic nuclei – the intralaminar group
-Alt hough thes e pr operti es are true f or s evereal thalamic nucl ei , many other s do not fi t in th i s cl assi cal fr amework i .e. the r ule of fait hf ul transfer of sensory mess ages to specifi c cort i cal ar eas is not uni versal . -(S herm an and Guill er y, 2001) . The majority of thalamic regions show an entirely different organization and connection pattern with the cortex, both in terms of afferents and efferents (Herkenham, 1980; Sherman and Guillery, 1996; Clascá et al., 2012, 2016). Part of them do not follow the strict topography and point-to-point projection of those relaying sensory information.
Instead, their efferents target large and widespread cortical regions or specifically innervate multiple areas, and the laminar distribution of the axons also shows great variability (Fig.
1.2.1 b, c) (for review see Clascá et al., 2012, 2016).
Moreover, the „driver” afferents in particular thalamic nuclei are not classical either, in the sense that they have cortical origin. Thus they putatively convey a message fundamentally different from sensory information. In contrast to the previously mentioned first order regions, we can refer to these parts of the thalamus as higher order areas.
3
Figure 1.2.1. Example of different projection patterns of various thalamic nuclei.
a) Specific projection from the thalamus to a well defined cortical region. b) Multispecific projection from the thalamus to the cortex. TC neurons innervate several distinct well defined cortical regions. c) Thalamic projection to large cortical areas and to subcortical structures (e.g. striatum).
Some thalamic nuclei also innervate subcortical targets, making them potential hubs connecting command organizer and executor networks (Sherman and Guillery, 2001; Jones, 2007; Clascá et al., 2016). The intralaminar (IL) complex is a group of thalamic nuclei that have a vast frontal cortical projection and also extensively innervate the striatum (Van der Werf et al., 2002; Clascá et al., 2016). The group is situated within the internal medullary lamina and consists of numerous nuclei. The anterior intralaminar group includes the central medial (CeM), the paracentral (Pc) and the central lateral (CL) nuclei, while the posterior intralaminar group holds the center median – parafascicular (CM-Pf) nuclei (separated only in primates). They have different projection patterns, both in the cortex and in the striatum
4
(Van der Werf et al., 2002). In accordance with the variety of their efferents, these nuclei show great functional diversity as well.
1.3 Functional overview of the intralaminar nuclei
-IL nucl ei play di vers e r oles in sever al brain functi ons .- These roles are, although seemingly different, not necessarily conflicting. Numerous experiments and human case studies indicate that IL nuclei have a prominent effect on consciousness and awareness (Kinney et al., 1994; Schiff et al., 2007). Others discuss that their activity affects the sleep- wake cycle and arousal (Hunter and Jasper, 1949); still others explain their role in motor functions (Chen et al., 2014; Rodriguez-Sabate et al., 2014), and there are examples of their participation in learning and memory consolidation (Bradfield et al., 2013; Pereira de Vasconcelos and Cassel, 2015). Based on their connectivity, all of the above are plausible.
IL nuclei act like a hub in the communication between the brainstem and the forbrain, and severe cognitive disfunction can be observed if they are damaged. Their importance is supported by the case of Karen Ann Quinlan (Kinney et al., 1994) who, after a cardiopulmonary arrest, fell into a persistent vegetative state. She was unable to communicate and did not show any signs of awareness, although her sleep wake cycle remained intact. The post mortem examination of her brain revealed that, contrary to the expectations, the cerebral cortex was not seriously damaged. Cortical scars could only be observed in the occipital pole and the parasagittal parieto-occipital region. Different components of the ascending activating system, including the brainstem, basal forebrain and hypothalamus, were also undamaged. However, in the whole thalamus, including the IL nuclei, severe cell loss could be detected. The damage was not uniform in the IL. The centrolateral and paracentral nuclei were strongly affected, as well as the centromedial nucleus, while the cell loss in the parafascicular nucleus was moderate compared to the others. These findings demonstrate that the IL nuclei can play a complex role in cognitive functions.
In accordance with these observations, the electrical stimulation of the IL nuclei was shown to improve arousal state, communication abilities and motor functions in a patient who remained in minimal conscious state (MCS) after a traumatic brain injury (Schiff et al., 2007).
5
In MCS, large scale cortical networks can be preserved, suggesting the possibility of partial functional recovery. After implanting two stimulating electrodes bilaterally to the thalamus targeting the CL and the CM-Pf complex, numerous tests were performed to tune the optimal stimulation parameters. To assess the effects of DBS, behavior and responsiveness were monitored in three categories. Results were evaluated by the so called JFK Coma Recovery Scale – Revised (CRS – R), which is a validated method used to measure neurobehavioural functions. The overall state of arousal was increased and the previously non-responsive patient showed dramatic improvements in communication, limb control and oral feeding compared to the presurgical baseline. Together with the previous case study, these results endorse the role of IL nuclei in cognitive functions.
Other studies raise the possibility of IL playing a role in the organization of the sleep-wake cycle. In 1949, Hunter and Jasper studied the effects of electrical stimulation of the IL nuclei in freely moving cats (Hunter and Jasper, 1949). They delivered 25 ms-long square wave pulses at 3-5 Hz and observed an increased response threshold to sensory stimulation, and detected rhythmic spindles and slow waves in the cortical EEG. In this study, depending on the parameters of the electrical stimulation, the authors also discovered movement-related effects. In the case of moderate intensities, bilateral twitching movements of the face, and in the case of higher intensities and lower frequencies (2-4 Hz) bilateral clonic movements of the face, forelimbs and body were observed. At higher intensities, tonic elevation of one forepaw and contralateral turning movements occured, but according to the authors, in these cases the stimulus might have not been specific to the IL nuclei.
Planning and executing complex movements requires proper communication of cerebral cortical motor centers, the basal ganglia and the cerebellum. As previously mentioned, the IL nuclei project to the striatum, the first station of the basal ganglial circuit directly innervated by the cortex. Rodriguez-Sabate and co-workers showed functional connectivity of IL nuclei with all basal ganglia in humans during resting state and in motor tasks using the correlation of BOLD signals (Rodriguez-Sabate et al., 2014). They concluded that IL thalamus influenced the strength of the functional connectivity of the striatum with other
6
basal ganglia so it was not only critical for striatal activity but also for the normal operation of the whole basal ganglia network.
Via the intralaminar thalamus, cerebellar information can also enter this circuit. The lateral cerebellar nucleus (LCN) was shown to innervate the striatum-projecting CL neurons (Ichinohe et al., 2000; Chen et al., 2014). The functional relevance of this disynaptic pathway was described by Chen and colleagues (Chen et al., 2014). They showed that the cerebellum can rapidly modulate striatal activity and cortico-striatal plasticity via the CL. The connection between striatum and the cerebral cortex is essential in motor learning, and the plasticity of this synapse has been shown earlier (Calabresi et al., 1992a, 1992b; Charpier and Deniau, 1997). After high frequency activation of the cortico-striatal pathway, the synapse on striatal neurons showed long term depression (LTD) that could be turned into long term potentiation (LTP) with the concurrent activation of the cerebellum. They also demonstrated the function of this pathway under pathological conditions. Rapid onset dystonia-Parkinsonism (RDP) is caused by the propagation of aberreant cerebellar activity to the basal ganglia via the IL (Calderon et al., 2011). They showed that in pharmacologically induced RDP, the propagation of altered cerebellar activity to the striatum could be prevented by either electrical lesion or optical inactivation of the IL.
Others observed damage to the IL-striatal pathway in Parkinson’s disease. Morales and colleagues showed that increased striatal glutamate can cause retrograde cell degeneration, not only in the dopaminergic cells of the substantia nigra but also in the striatum-projecting IL neurons (Morales et al., 2013). This retrograde excitotoxicity can play a role in the development of Parkinson’s disease.
1.4 Afferents of the intralaminar nuclei
According to the studies described above it is clear that IL nuclei participate in many tasks different from sensory information transmission, and from their cortical projection pattern and subcortical connections we can notice that they do not fit in the classical model of thalamocortical organization. -But is it onl y t heir output that makes t hem peculiar , or do they recei ve di fferent i nput as w ell ? - Some of the afferents arriving to the IL
7
are shared among nuclei, but there are certain differences between their innervation. As partially mentioned previously, IL nuclei act like a communication channel between brainstem and forebrain. Accordingly, a massive innervation arrives from different brainstem nuclei, especially from the components of the reticular activating system (Van der Werf et al., 2002). A serotonergic projection from the raphe and noradrenergic fibers from the locus coeruleus can be found in all IL nuclei, while cholinergic innervation from the pedunculopontine and laterodorsal tegmental nuclei is typically found in the CM (Van der Werf et al., 2002). The supramamillary nucleus also innervates the IL complex, and topographic projections from different layers of the superior colliculus and from different sectors of the periaqueductal gray matter can also be observed (Krout and Loewy, 2000;
Krout et al., 2001; Van der Werf et al., 2002). The lateral cerebellar nucleus (LCN) also sends fibers to the striatum-projecting CL neurons (Ichinohe et al., 2000). The importance of this projection was described in the functional overview (Chen et al., 2014).
The great variety of inputs arriving to the IL, as well as the diversity of projections, raises the possibility of the IL being more than a relay station that faithfully transmits incoming information. It seems to act more like a hub, receiving subcortical modulatory inputs and several other types of messages from multiple sources, having access both to cortical areas and, via the striatum, to the movement-organizing basal ganglial circuit.
1.5 Inhibitory inputs in the thalamus
As it was demonstrated, thalamic nuclei like the IL complex show great variability in terms of projection pattern and excitatory afferents, so the classical anatomical and functional generalization of thalamocortical networks is not appropriate. -So far, only excitat ory input s of t he t halamus w er e described , but no bi ological s yst em can be stable without inhi bition. - In the thalamus, the general source of this inhibition is the GABAergic cells of the thalamic reticular nucleus (TRN) (Jones, 1985). This shell-like structure covers the ventral anterior side of the thalamus and forms point-to-point reciprocal connection with all of its nuclei. TRN terminals target every functional domain of the thalamic cells, from the soma to the very distal dendritic regions, and exhibit a tonic
8
hyperpolarizing effect via small sized terminals with one or occasionally two active zones.
The result of this hyperpolarization and the co-operation of T-type calcium and H-type channels is the burst activity of thalamic neurons observed during sleep (Jahnsen and Llinás, 1984). The connectivity and rhythmic interaction of the thalamus and the TRN is the basis of spindle genesis and thalamocortical oscillatory activity (Barthó et al., 2014).
-In parti cular thalamic nuclei , inhi bitor y inputs from extr athalami c sour ces are al so pr es ent . - Higher order thalamic regions, as well as the presented IL nuclei, are innervated by the GABAergic fibers of the zona incerta (Zi) (Bartho et al., 2002), the anterior pretectum (APT) (Bokor et al., 2005) and the substantia nigra pars reticulata (SNr) (Bodor et al., 2008). Incertal fibers were found in the largest density in the posterior thalamic nucleus (POm), in the lateral parts of the ventrolateral thalamic nuclei and in several IL nuclei (Bartho et al., 2002). APT-thalmic fibers also targeted all higher order nuclei, and the CL and mediodorsal (MD) nuclei of the IL complex (Bokor et al., 2005), while nigral terminals could be observed in the ventral anterior (VA), ventrolateral (VL), ventromedial (VM) and also in the intralaminar nuclei (Bodor et al., 2008).
Extrathalamic inhibitory fibers not only show preference for distinct thalamic nuclei, but also for specific functional domains of the TC neurons, targeting their thick proximal dendrites with large terminals containing multiple release sites (Bartho et al., 2002; Bokor et al., 2005;
Bodor et al., 2008). In contrast to the tonic effect of TRN, the functional consequences of these morphological properties are fast transient postsynaptic inhibitory currents. In the case of the APT-thalamic connection, it was shown that inhibitory responses could be evoked with very short latency and small jitter. Also, paired pulse activation revealed the non-depressing nature of the synapse (Bokor et al., 2005). Fast transient extrathalamic inhibition can effectively regulate the firing of TC neurons and the propagation of excitation into the soma in specific cases (Lavallée et al., 2005).
9
1.6 Glycinergic neurotransmission – novel sources of inhibition in the forebrain
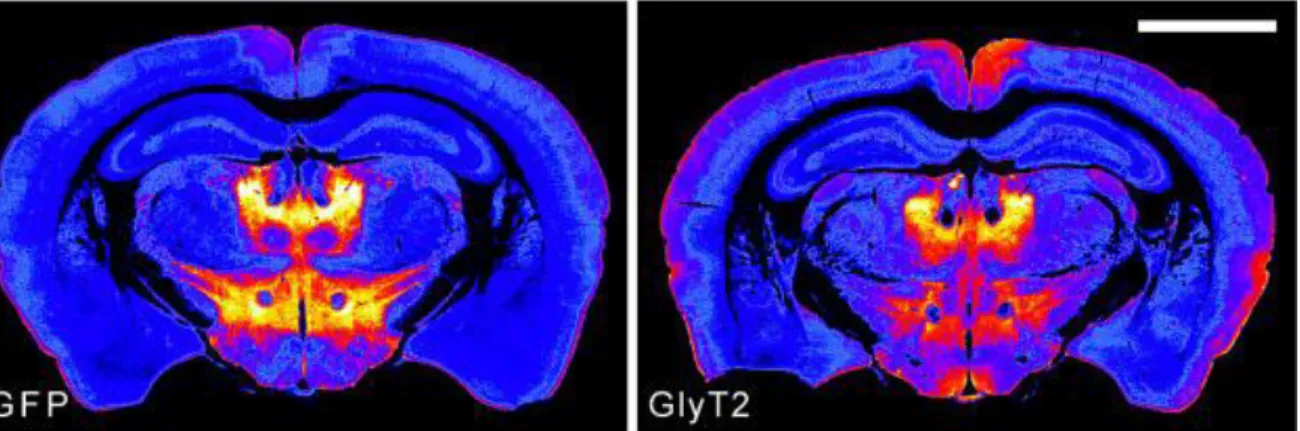
The possibility of the existence of additional extrathalamic inhibitory pathways besides the presented ones was raised after a paper published by Zeilhofer and colleagues in 2005 (Zeilhofer et al., 2005). They created a type 2 glycine transporter (GlyT2)::enhanced green fluorescent protein (eGFP) transgenic mouse line expressing eGFP in glycinergic neurons.
In the midbrain of these animals a strong fluorescent signal could be observed emitted by a profuse network of axons and terminals (Fig. 1.6.1).
Figure 1.6.1. Glycinergic labelling in the midbrain of GlyT2::eGFP transgenic animals.
GFP signal in a GlyT2::eGFP transgenic animal (left). GlyT2 immunoreaction (right). Note the overlap between the intrinsic eGFP signal and immunolabeling (Modified from Zeilhofer et al., 2005).
Glycine is the simplest proteinogenic amino acid. The discovery of its high concentration in the spinal cord and in the brainstem in the 1960’s raised the possibility of its potential role as a neurotransmitter (for review see: Bowery and Smart, 2006; Hernandes and Troncone, 2009). Glycinergic neurotransmission has been known to be common in the these areas since the early 1970’s (for review see Bowery and Smart, 2006).
The main source of glycine is the serine-glycine metabolic pathway, catalyzed by glycine decarboxylase and serine hydroxymethyltransferase. To act as a neurotransmitter, glycine needs to be first accumulated in the synaptic terminals and then in the synaptic vesicles. The former is achieved by the GlyT2 molecule being expressed by glycinergic neurons (in
10
contrast to the type 1 glycine transporter (GlyT1) molecule, which is a glia-specific transporter)(Liu et al., 1993), while the latter is performed by the vesicular inhibitory amino acid transporter (vIAAT, also known as vesicular GABA transporter - vGAT), the co- transporter of glycine and GABA (McIntire et al., 1997; Sagné et al., 1997; Wojcik et al., 2006).
Although the potential role of glycine as a neurotransmitter was suggested earlier, the glycine receptor was only isolated in 1983. These receptors are built from alpha and beta subunits, and in adult tissue 2 and 3 subunits form a heteropentameric transmembrane ion channel.
Upon glycine binding, a pore opens that selectively allows Cl- ions to flow across the membrane, causing hyperpolarization of the membrane potential. The inhibitory effect of glycine is fundamental for voluntary motor control, for spinal inhibitory reflexes allowing the relaxation of antagonistic muscles, and is also involved in cardiovascular, auditory and respiratory functions (for review see: Bowery and Smart, 2006; Hernandes and Troncone, 2009).
During developement, when the intracellular Cl- ion concentration is increased in several parts of the brain, glycine and GABA have a depolarizing effect, and thus act as an excitatory transmitter. This is believed to be important for neuronal differentiation and synaptogenesis.
In the mature nervous system, glycine is also needed for the activation of N-methyl-D- aspartate (NMDA) receptors. NMDA receptors have a glutamate/aspartate and a glycine/serine binding site, and both of these have to be occupied to activate the ion channel.
The concentration of glycine in the glutamatergic synaptic cleft may be regulated by the GlyT1-expressing glial cells (for review see: Hernandes and Troncone, 2009).
11
1.7 Integration in the thalamus
Throughout the previous sections, I presented examples of how the diversity of thalamic afferents and projection patterns make the picture of thalamocortical operation more complex, but I did not talk about how thalamic regions receiving afferents from various sources deal with the incoming information, and what may happen to that information at the level of the thalamus.
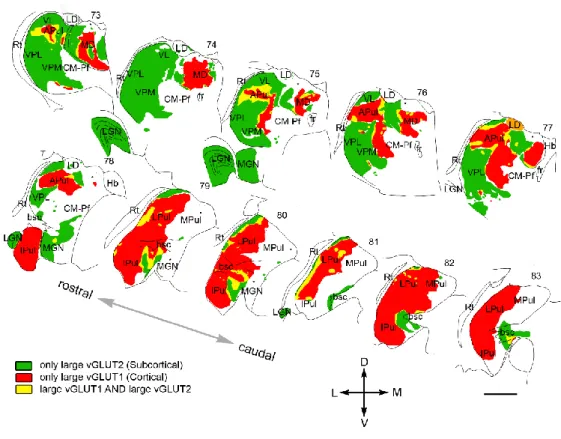
In particular thalamic nuclei, besides the classical subcortical sensory drivers, other terminals that share the morphological and physiological properties of a driver (large terminals with multiple active zones, fast excitatory postsynaptic potentials (EPSP) with large amplitude) can also be observed. These terminals are known to have L5 cortical origin and innervate the exact same proximal dendritic domain of TC cells as inputs coming from subcortical sources (Sherman and Guillery, 1996, 2001; Bickford, 2015). As it was mentioned before, thalamic regions receiving only subcortical drivers and relaying sensory information to a specific sensory cortical area are called first order nuclei, while the those innervated by cortical drivers are named higher order nuclei (Sherman and Guillery, 2001). The distribution of driver terminals with different origin was mapped in the whole primate thalamus (Rovó et al., 2012) using the type I vesicular glutamate transporter (vGluT1) as a marker of cortical terminals and the type II vesicular glutamate transporter (vGluT2) as a marker of subcortical terminals. The study revealed that in some thalamic regions these inputs were completely separated, while in others they colocalized, but that areas entirely lacking driver terminals also existed (Fig. 1.7.1).
12
Figure 1.7.1. Distribution of drivers with different origin in the primate thalamus.
(Modified from Rovó et al., 2012).
It is important to note here that vGluT1 labels axons from both layer 5 (L5) and layer 6 (L6) of the cerebral cortical pyramidal cells. These two can easily be differentiated by their morphological properties (number of release sites, postsynaptic target domain) (Jones, 2007;
Bickford, 2015) and by their physiological effect (rise time and amplitude of the evoked EPSP). L6 of the cerebral cortex innervates all thalamic cells and serves as a modulatory input, tuning the activity and sensitivity of TC neurons (Sherman and Guillery, 2001).
-The col ocaliz ation of dri ver t er minals with diff er ent or igin in the same thalami c ar ea rais es the possi bilit y of thei r conver gence on a s i ngl e thal ami c celland suggests that the output of such a neuron will be determined by two entirely different messages.
13
1.8 Key points of the introduction
Accor ding to the classical vi ew , t he thalamus serves as a r elay st ation for ascending s ens or y i nformati on .
Several thal ami c nuclei do not fit i n to thi s cl assi cal fr amewor k .
IL nucl ei show an enti rel y di fferent organi zati on and conne cti on
patt ern with the cortex , and pl ay di vers e rol es in s ev eral brai n functions.
It is not only t heir output that makes t hem peculiar , but t hey als o receive a large var iety of af ferents.
Thalamic nucl ei , bes ides excitatory affer ents , als o recei ve i nhibition from thalamic sources and parti cul ar ones from ext rat halami c s our ces .
The pos sibilit y of t he exist ence of a novel glyci nergi c extrat halami c inhibit or y pathw ay w as r ais ed.
The col ocalization of dri ver termi nals w i th diff er ent orgi n s r aises the possi bilit y of t heir conver gence on a single t hal ami c cell , and thus the integrati ve r ol e of parti cular thalami c r egions .
14
2 Objectives
The diversity of excitatory and inhibitory afferents in the thalamus, often in the same nuclei, as well as the heterogeneity of projection patterns and targeted cortical and subcortical areas, indicate that besides the well-described relay function of specific first order nuclei, a great part of the thalamus may play different roles in shaping information processing, and may also have complex executive functions.
In GlyT2::eGFP transgenic animals, our group discovered a massive cloud of glycinegic fibers targeting the IL complex, and found the possibility of convergence of excitatory driver inputs with different origin in the somatosensory thalamus of rodents.
In my PhD work for this thesis I have focused on two different aspects of thalamic activity control. First, I examined the role of glycinergic inhibition arriving to the IL complex in the regulation of motion. Second, I studied the convergence of excitatory drivers with different origin on the same TC cell.
My goals were:
1. To describe the glycinergic projection to the IL at the network and cellular levels, and to characterize the in vivo activity of the glycinergic cells.
2. To describe the effects of selective activation of the glycinergic pathway on IL activity and on the behavior of the animal.
3. To define the afferents of the glycinergic cells and the effect on their activity.
4. To show the putative integrative role of TC cells by characterizing the morphology of drivers with different origin converging onto the same neuron.
15
3 Methods
3.1 Animal housing and treatement
Mice were entrained to a 12 h light/dark cycle with food and water available ad libitum. All experimental procedures were performed according to the ethical guidelines of the Institute of Experimental Medicine of the Hungarian Academy of Sciences.
3.2 Processing of human samples
Human thalamic tissues (n = 3) were obtained from a male and two female patients (74, 59 and 76 years old, respectively). The subjects died from causes not linked to brain diseases, and none of them had a history of neurological disorders. The 3 subjects were processed for autopsy in Szent Borbála Hospital, Tatabánya, Department of Pathology. Informed consent was obtained for the use of their brain tissue for research purposes. Tissue was treated in a manner compliant with the Declaration of Helsinki. All performed procedures were approved by the Regional and Institutional Committee of Science and Research Ethics of the Scientific Council of Health (ETT TUKEB 31443/2011/EKU (518/PI/11)).
3.3 Used transgenic animal strains 3.3.1 GlyT2::eGFP mouse line
GlyT2 is a protein localized in the neuronal membrane and is responsible for capturing glycine molecules in the extracellular space and accumulating them inside the cell (Liu et al., 1993). Once the glycine reaches the proper intracellular concentration, the vIAAT molecule accumulates it in the synaptic vesicle, and thus it can function as an inhibitory neurotransmitter (McIntire et al., 1997; Sagné et al., 1997; Wojcik et al., 2006). GlyT2 is expressed in every glycinergic inhibitory neuron, making it their selective marker (Zafra et al., 1995).
In 2005, Zeilhofer and his colleagues created a reporter mouse strain in which eGFP was expressed under the control of the promoter of the GlyT2 gene, so glycinergic neurons showed green fluorescence (Zeilhofer et al., 2005). Performing the tracing experiments and
16
the juxtacellular recordings using these animals allowed us to post hoc identify the labeled neurons or fibers and the recorded units respectively.
3.3.2 GlyT2::cre mouse line
For the generation of this line, homologous recombination in bacteria was used to introduce the cre coding sequence into the BAC-DNA (bacterial artificial chromosome- deoxyribonucleic acid, clone RP23-365E4). The modified BAC-DNA was injected to the pronuclei of fertilized C57BL/6 oocytes. GlyT2::cre mouse lines were maintained on a C57BL/6J background. The selectivity of cre expression was demonstrated by performing immunostaining against the cre-protein (mouse anti-cre 1:10,000. Millipore, followed by Cy3-conjugated donkey anti-mouse 1:500) in crossed GlyT2::cre and GlyT2::eGFP mice. In these experiments, we examined 198 cre-positive neurons, out of which 196 (99%) were also eGFP-positive. We used these animals to selectively label glycinergic neurons using the cre-loxP system in gain of function experiments.
3.3.3 GlyT2::eGFP/Rbp4::cre mouse line
In these animals all glycinergic neurons show green fluorescence, and in addition cre recombinase is expressed in the cerebral cortex in layer 5 pyramidal neurons under the control of the promoter of the retinol binding protein 4 (Rbp4) gene. This double transgenic strain on the one hand allowed us to identify glycinergic neurons (as it was described previously in Chapter 3.3.1), and on the other hand to selectively label layer 5 pyramidal neurons in a cre-dependent manner.
3.4 Morphology 3.4.1 Surgery
Tracer and virus injections were performed under ketamine/xylazine anesthesia (ketamine, 83-111 mg/kg; xylazine, 3.3-4.3 mg/kg). The head of the animal was fixed in a stereotaxic apparatus (David Kopf Instruments, Tujunga, California 91042, Model 900 Small Animal
17
Stereotaxic Instrument). If needed, intramuscular injection of ketamine/xylazine was given to maintain anaesthesia.
3.4.2 Standard procedure for immunohistochemistry and standard incubation times
Fixation of the tissue: all animals, both for anatomical analysis and following acute or freely moving electrophysiological recordings, were perfused using similar methods and solutions, listed below. Once under deep anesthesia, the chest was opened and first saline and then fixative was perfused by peristaltic pump into the cardiovascular system via the heart.
Following the fixation, phosphate buffer (PB) was perfused to remove the fixative from the tissue. After fixation the brain was removed from the skull and sectioned using a Leica VT1200s microtome (Leica Biosystems). Slices were cut at 50-60 m thickness.
Used solutions:
Saline (0.9% NaCl in H2O) – 2 minutes
4% paraformaldehyde solution in 0.2 M PB (1:2) + 0.1% glutaraldehyde (mixed immediately before perfusion) – 30 minutes, 180 ml
PB – 50 ml
Preparation of the sections: For cryoprotection, sections were incubated in 30% sucrose overnight or in 10% sucrose for 10 minutes then in 30% sucrose for an hour. Following the sucrose treatment, to unmask antigens in the tissue and help the penetration of the antibodies, sections were frozen over liquid nitrogen 3 times and then washed in tris-buffered saline (TBS) buffer. Alternatively 0.1% triton was used for 30-60 minutes. These sections, however, could not be used for electronmicroscopic (EM) analysis due to the deleterious effect of triton on membrane ultrastructure.
Used solutions:
10 and 30% sucrose – 10 minutes, 1 hour and overnight, respectively
TBS – 3x10 minutes
18
Immunohistochemistry: For all the reactions TBS buffer was used as a solvent. Following each step, 3x10 minutes rinse with clean TBS was applied. First, the sections were treated with bovine serum albumin (BSA) to mask unspecific antibody binding sites, and then, without washing, primary antibody solution was applied followed by the secondary fluorescent or biotinylated antibody. After washing out the biotinylated antibody, sections were incubated in avidin-biotin horseradish peroxidase complex (ABC), then either in diaminobenzidine (DAB) for brown precipitation or nickel intensified diaminobenzidine (DAB-Ni) for black precipitation. The oxidation of DAB or DAB-Ni was induced by 1% or 0.03% hydrogen peroxide, respectively. In specific cases, ABC was replaced by ImmPRESS (anti mouse/rabbit/goat) peroxidase conjugated secondary antibody, making the procedure faster but less sensitive. Depending on the aim of the experiment various immunoreactions were performed with various antibodies at different concentrations. Details are given in the corresponding paragraph of Materials and Methods.
Used solutions:
BSA: 3%, 40 minutes
primary antibodies: sensitivity-dependent concentration, overnight
secondary antibodies: sensitivity-dependent concentration, 2 hours
ABC: 1:300-500, 90 minutes
Immpress: 1:2-1:3, 90 minutes
DAB/DAB-Ni incubation: 10 minutes
H2O2: 0.03%-1%
Dehydration and embedding of the tissue: to prepare tissue for embedding, sections were treated with OsO4 (1% for 40 min) followed by sequential incubation in ethanol (50%, 70%, 90%, absolute) and acetonitrile as a final step at room temperature. Between the 70% and 90% ethanol step, uranile acetate solution was applied for 20 minutes. After the dehydration procedure, sections were incubated in Durcupan (ACM, Fluka, Buchs, Switzerland) overnight, followed by curing in fresh durcupan at 60oC for 24 hours.
19 Used solutions:
1% OsO4 solution (1:2:1 - OsO4:0.2M PB:H2O), 20-40 minutes
ethanol (50%, 70%, 90%, absolute), 10-10 minutes
uranilacetate (1:10) in 70% ethanol, 20 minutes
acetonitrile, 2x5 minutes
Durcupan, overnight
Preparation for electron microscopy: to prepare electron microscopic sections, one region of interest (ROI) was re-embedded from the light microscopic material. The ROI was further sectioned to 60 nm ultrathin sections using an ultramicrotome (EM UC6, Leica Biosystems).
Sections were mounted on copper and nickel pioloform-coated grids. In some cases, a post- embedding GABA reaction was performed on sections mounted on nickel grids according to the protocol of Somogyi et al. (Somogyi et al., 1985).
3.4.3 Retrograde tracing and immunohistochemistry
PRF-to-IL projection: In order to identify thalamus-projecting brainstem neurons, we injected FluoroGold (FG) iontophoretically (0.6 μA; 2 s on/off period; 10 min duration, capillary tip diameter 20 μm) into the intralaminar thalamus of GlyT2::eGFP mice (n = 6 unilaterally and n = 2 bilaterally). The following co-ordinates were used: Bregma -1.2 mm to -1.7 mm; lateral 0.7 to 0.8 mm, ventral from cortical surface -3.0 to -3.5 mm. After 3 days, mice were anaesthetized and were perfused through the heart. For the fixation, the 0.1%
glutaraldehyde and 4% paraformaldehyde containing solution was used. The coronal sectioning of the thalamus and the brainstem (50-60 µm slices) was followed by cryoprotection in 30% sucrose solution overnight. The sections were frozen above liquid nitrogen to unmask the antigens in the tissue.
To detect FG, an anti-FG primary antibody (Chemicon, AB 153, 1:10,000 to 1:30,000, overnight) was used. For light microscopic visualization we applied either a 1 nm gold particle-conjugated goat anti-rabbit secondary antibody (1:50, Amersham) with silver
20
intensification (Aurion R-Gent SE LM -silver enhancement kit, 20-22min), or long-spacer biotinylated donkey anti-rabbit secondary antibody (b-SP-DARb, Jackson Immuno Research Laboratories Inc., 711-065-152, 1:500) followed by ABC (1:500 Vector) and DAB-Ni (black reaction product) treatement. For fluorescent microscopy, an Alexa 594 conjugated goat anti- rabbit antibody (1:500, Molecular Probes) was used.
Frontal cortex-to-PRF projection: In a separate set of experiments (n = 4) FG was injected into the PRF (2 μA; 7 s on/off period; 15 min duration) to identify its inputs. We used the following coordinates: Bregma -4.4 mm; lateral -0.8 to -1 mm; ventral from cortical surface -4.2 mm. After 5-7 days of recovery, animals were perfused as described above and the entire brain was sectioned coronally.
3.4.4 Anterograde tracing and immunohistochemistry
PRF-to-IL projection: In order to visualize pontothalamic fibers, a AAV5.EF1a.DIO.hChR2(H134R)-eYFP.WPRE.hGH(Addgene20298P) cre dependent virus construct (Penn Vector Core, Philadelphia, PA 19104-3403) was injected into the PRF of GlyT2::cre mice at the following coordinates Anteroposterior, Br -4.3 mm to -4.4 mm;
Lateral, 0.8 mm; V, -4.0 mm. After the injection, animals were allowed to recover for two weeks, which was enough time for the neurons to express the viral gene constructs. The virus- injected animals were used in anaesthetized and freely moving experiments (see in Chapter 4.3 and 4.4.) and the fiber distribution was determined post hoc. The animals were then perfused according to the protocol described in Chapter 3.4.2.
In order to visualize GlyT2::eGFP fibers with light microscopy, the sections were treated with mouse or chicken anti-eGFP antibody (1:20,000, Molecular Probes, A11120, overnight) followed by biotinylated horse anti-mouse or horse anti-chicken secondary antibody (1:300, Vector, 2 hours) respectively, then the sections were treated by ABC (1:300 Vector) and DAB-Ni. In order to label the postsynaptic targets of GlyT2::eGFP fibers in the IL, the eGFP- DAB-Ni immunoreaction was followed by a treatment with a rabbit anti-calbindin antibody (1:20,000, Swant, overnight) and rabbit ImmPRESS (1:2, Vector, 90 min). The calbindin immunostaining was visualized by DAB alone, yielding a brown reaction product.
21
In order to verify the specificity of the GlyT2::eGFP mouse line, coronal sections of the thalamus from GlyT2::eGFP mice were treated with a guinea pig anti-GlyT2 antibody (1:10,000, Chemicon, AB 1773, overnight) followed by a Cy3 conjugated donkey anti- guinea pig antibody (1:500, Jackson, 2 hours). All GlyT2-positive terminals examined (n = 106) displayed eGFP signal, whereas 95% of the eGFP terminals (n = 311) were immunopositive for GlyT2 (n = 2 animals).
Glycinergic fiber distribution mapping: After showing that the glycinergic innervation originates in the PRF, we mapped the glycinergic fiber distribution in the thalamus. Anti eGFP staining on GlyT2::eGFP or on virus-injected GlyT2::cre mouse sections was performed as described above. Thalamic neurons were visualized using an anti-calbindin- DAB reaction (1:20,000, Swant, overnight).
To compare the distribution pattern of GlyT2 fibers in mice and humans we performed anti GlyT2 immunostaining on human samples. Slices were treated with an anti-GlyT2 antibody (1:10,000, Chemicon) overnight and the signal was visualized with an ABC – DAB-Ni reaction. Postsynaptic targets were labeled with anti-calbindin (1:20,000, Swant, overnight) and visualized with DAB.
The DAB and DAB-Ni reactions were viewed with either a Zeiss Axionplan 2 fluorescent microscope and photographed by a digital camera (Olympus DP70), or with a Zeiss Axio Imager M1 microscope coupled to an AxioCam HrC digital camera. Fluorescent micrographs were taken with an Olympus DP70 digital camera. For confocal images, an Olympus Fluoview FV1000 confocal laser scanning system on an Olympus BX61 microcope, or a Nikon A1R confocal microscope was used.
Primary sensory cortex (S1)-to-POm projection – relative distribution of cortical and subcortical drivers: To examine the projection pattern of S1 cortex and the relative distribution of cortical and subcortical terminals in the POm, anterograde tracing was combined with vGluT2 immunostaining in both rats and mice. Phaseolus vulgaris leucoagglutinin (PHAL, Vector Laboratories) or biotinylated dextran amine (BDA) was iontophoretically injected to the S1 cortex (rats: Bregma −1.2 mm, lateral −5.0, ventral from cortical surface: 1.5mm, mice: Bregma −1.2 mm, lateral −3.0, ventral from cortical surface:
22
0.8 mm) using the following parameters: PHAL: 2.5% in 0.01 M PB, 5 μA, 7 s on/off duty cycle, 20 min; n = 5 mice and n = 6 rats, BDA: 2 μA, 2 s on/off, 20 min, pipette d = 15 μm, n = 4 rats. After a survival period of 5–7 days, mice were perfused according to the standard procedure described in Chapter 3.4.2 (4% paraformaldehyde solution + 0.1%
glutaraldehyde). Rats were perfused with a 2-component fixative: first component: 2%
paraformaldehyde 0.1–1% glutaraldehyde in acetate buffer (100 ml), second component: 2%
PF 0.1–1% glutaraldehyde in borate buffer (400 ml). The subsequent sectioning and preparation procedures were carried out as described in Chapter 3.4.2.
Anterogradely-labeled axon terminals in the POm were reacted with a rabbit-anti-PHAL antiserum (1:10,000) and biotinylated anti-rabbit IgG (1:500, Jackson) and visualized with DAB-Ni (see Chapter 3.4.2). BDA was developed with avidin biotinylated horseradish peroxidase complex and visualized with DAB-Ni. To visualize vGluT2 terminals, an anti- vGluT2 antibody was used (1:3000, Chemicon) followed by mouse ImmPRESS (1:3, Vector, 3 h) and a DAB reaction (see: Chapter 3.4.2).
To quantify the co-distribution of the cortical (labeled by PHAL) and subcortical (vGluT2) terminals, we calculated the portion of large cortical terminals (n = 1027 terminals, 3 animals) within zones of POm “rich” or “poor” in vGluT2-positive terminals (n = 3 animals). We defined vGluT2-rich zones as counting more than 15 terminals in a 100 × 100 µm area on the top and bottom surface of the section using a 63× oil immersion objective (1.4 numerical aperture). Photomicrographs were acquired with an AxioCam HRC (Carl Zeiss Mi- croimaging, Jena, Germany) camera. Photomicrographs were processed by Image-Pro Express 6.0 (Media Cybernetics, Bethesda, MD, USA, “extended depth of field function”) and Adobe Photoshop CS2 (Adobe Systems, San Jose, CA, USA). Modifications were applied to whole images only.
Frontal cortex-to-PRF projection: To examine the motor cortex projection to the PRF, we injected a AAV5.EF1.dflox.hChR2(H134R)-mCherry.WPRE.hGH (Addgene20297) cre dependent virus into the cortex of GlyT2::eGFP/Rbp4::cre mice. Layer 5 pyramidal neurons were transfected and after 2 weeks their fiber distribution in the brainstem was analyzed. To visualize the virus-infected fibers, an anti-mCherry primary antibody (BioVision, Inc.,
23
California 95035, 1:4000) was used, followed by either anti-rabbit ImmPRESS (1:2, Vector Laboratories Burlingame, Ca 94010) and DAB-Ni as a chromogen for light microscopic analysis, or a Cy3-conjugated goat anti rabbit secondary antibody for fluorescent microscopic analysis.
In previous experiments, PHAL was injected in the frontal motor cortex area to label PRF- projecting fibers. To visualize the axons, an anti-PHAL primary antiserum (Vector Laboratories Burlingame, Ca 94010, 1:30000) was used, followed by a biotinylated goat anti- rabbit secondary antibody (1:300, Vector Laboratories Burlingame, Ca 94010) and ABC (1:300, Vector Laboratories Burlingame, Ca 94010) treatment, and finally DAB-Ni as a chromogen. For fluorescent microscopy, PHAL was visualized by a rabbit anti-PHAL (1:10,000, Vector Laboratories Burlingame, Ca 94010) primary antibody and an Alexa 594- conjugated goat anti-rabbit secondary antibody.
3.4.5 Electron microscopy
Ultrastructural analysis of PRF axons: The ultrastructure of PRF axons in the IL were examined using ultrathin electron-microscopic sections (60 nm). To prepare for electron- microscopic analysis, mice were perfused with sequentially applied 2-component fixative:
first component: 2% PF 0.1–1% glutaraldehyde in acetate buffer (100 ml), second component: 2% PF 0.1–1% glutaraldehyde in borate buffer (200 ml). To visualize eGFP, a silver-intensified pre-embedding immunogold reaction was used (mouse anti-eGFP 1:1000 followed by a 1nm gold particle-conjugated goat anti-mouse secondary antibody). Following the immunoreaction, sections were treated with OsO4 (0.5% for 20 min. at 4 ºC in 0.1 M PB) and were then embedded and prepared for electron-microscopic analysis (for details see:
3.4.2). To visualize GABA, a post-embedding GABA immunostaining was performed on sections collected on nickel grids (see: 3.4.2). Electron micrographs were taken using a Megaview digital camera installed in a HITACHI 7100 electron microscope. For 2D measurements, ITEM software (Olympus Soft Imaging System) was used.
Target diameter mesurements of cortical and subcortical drivers: to determine the targeted dendritic domain of labeled cortical and subcortical terminals at the electron microscopic
24
level, the minor dendritic diameter of a random sample or a given target dendrite was measured. The dendritic diameter was the average of 3 diameters measured on non- consecutive electron-microscopic sections with synaptic contacts. As the data did not have normal distribution, statistical significance of the difference of dendritic domains targeted by driver terminals and random dendritic regions was assessed by using the non parametric Mann–Whitney U test.
3.4.6 Human tissues preparation
Re-embedding and electron-microscopic studies were performed as described in Chapter 3.4.2. Human tissues were previously prepared for light microscopic analysis. The methodological description is qoted from Giber, Diana, Plattner and colleagues (Giber et al., 2015):
Brains w er e r emoved 4 -5 hour s aft er deat h. The i nt ernal caroti d and the vert ebral art eri es w er e c annulat ed, and the brai ns were perf used first w ith physiol ogi cal s aline (1.5 L i n 30 mi n) containing hepar in (5 ml ), foll ow ed by a fi xative s oluti on contai ning 4% paraf ormal dehyde, 0 .05% glutaraldehyde and 0.2% pi cri c aci d in 0.1 M PB, pH=7.4 ( 4 -5 L i n 1.5 -2 hours ). The thalamus was r emoved f rom the brai ns after perf usion, and was postfi xed overni ght in t he s ame fixati ve s oluti on, except f or gl utar aldehyde, whi ch was excl uded. Subsequently, 50 m thi ck coronal secti ons w er e obtai ned for immunohistochemistr y usi ng a Leica VTS -1000 Vibr atome (L ei ca Micros yst ems, Wetzl ar, Germany). The sections w er e incubat ed with a gui nea pig anti -Gl yT2 anti body (1:10,000, Chemicon), and the signal was visualiz ed with the DAB -Ni reaction descri bed above. The secti ons w er e then tr eat ed with Os O4 (1.0% for 40 min. in 4 ºC in 0.1M PB), dehydrated in ethanol and acetonitril e, and embedded i n Durcupan (AC M, Fl uka, Buchs Switz er land).
Ultrathin s ections w er e cut with an Ult r ami crot ome fr om bl ocks contai ning GlyT 2-posit ive fibers . In some cases postsynapti c IL neurons w er e vis uali zed using a mous e anti -cal bindi n antis er um and DAB r eacti on. In thes e cases, glucos e (7%) was added t o the OsO4 s olut ion to preserve the color di fference.
25
3.5 In vivo physiology 3.5.1 Surgery
Altogether 20 adult male C57Bl/6J BAC GlyT2::eGFP and GlyT2::cre mice (20-30g) were used for the experiments. Surgery, acute recording experiments and implantations were done under ketamine/xylazine anaesthesia. The head of the animal was fixed in a stereotaxic apparatus (David Kopf Instruments, Tujunga, California 91042, Model 900 Small Animal Stereotaxic Instrument). Initially, mice received an intraperitoneal injection of ketamine (111 mg/kg) and xylazine (4.3 mg/kg). For the maintenance of the anaesthesia, intramuscular injection of ketamine/xylazine was given every 30-50 min during the experiments.
3.5.2 In vivo juxtacellular recording and labeling, local field potential (LFP) recording
Bipolar LFP electrodes (FHC, resistance ~1 MΩ) were inserted into the frontal cortex of mice (Bregma 1.7 mm; lateral -0.8 mm). The recorded signal was amplified, band-pass filtered from 0.16 Hz to 5 kHz and from 100 Hz to 5 kHz to record the fast multiunit activity (Supertech BioAmp, Supertech, Pécs, Hungary) and digitized at 20 kHz (micro 1401 mkii, CED, Cambridge, UK). Concentric bipolar stimulating electrodes were inserted into the IL (Bregma -1.5 mm; lateral 2 mm; ventral from cortical surface -3.2 mm tilted at 20 degrees, electrode separation 0.8mm). PRF single unit activity was recorded by glass microelectrodes (in vivo impedance of 20-40 MΩ) pulled from borosilicate glass capillaries (1.5 mm outer diameter, 0.75 or 0.86 inner diameter, Sutter Instrument Co., Novato, CA, USA or WPI Inc.
Sarasota, Fl, USA) and filled with 0.5 M K+- acetate and 2% neurobiotin (Vector Laboratories, Burlingame, CA, USA). Electrodes were lowered by a piezoelectric microdrive (Burleigh 6000 ULN or ISS 8200, EXFO, Quebec City, Quebec, Canada) into the PRF (Bregma -4.4 mm; lateral -0.8 to -1 mm; ventral from cortical surface -3.8 to -4.8 mm).
Neuronal signals were amplified by a DC amplifier (Axoclamp 2B, Axon Instruments/Molecular Devices, Sunnyvale, CA, USA), further amplified and filtered between 0.16 Hz and 5 kHz by a signal conditioner (LinearAmp, Supertech). Neuronal
26
signals were recorded by Spike2 5.0 (CED). Juxtacellular labeling of the recorded neurons was done as described previously (Pinault, 1996). Briefly, after recording the activity of the cell positive current steps (0.5-8 nA) were applied at 2 Hz via the recording pipette filled with neurobiotin. The neuron fired only during these current steps. During the induced firing neurobiotin was taken up by the cell filling the soma and proximal dendrites. In some cases, distal dendritic regions and axons were also labeled.
Following perfusion, coronal sections (50 μm) were cut from the PRF and the neurons were visualized with Cy3 conjugated streptavidin (1:2,000, Jackson). GlyT2::eGFP positivity was determined by confocal microscopy. The neurons were then developed using ABC and DAB- Ni, and the sections containing the labeled neurons were dehydrated and embedded in Durcupan. The dendritic trees of the labeled neurons were reconstructed using Neurolucida 5.2 software (MBF Bioscience, Magdeburg, Germany).
3.5.3 Analysis
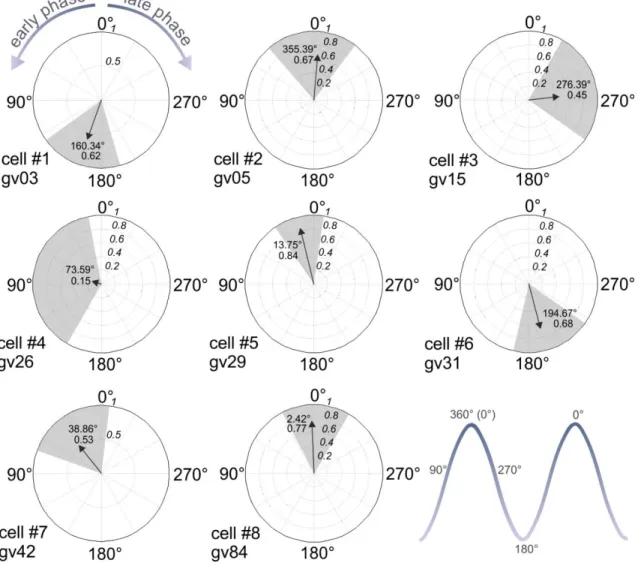
To find the action potential clusters of the PRF cells, we used a built-in script of the Spike2 7.0 (CED) software. We determined clusters by separating the two peaks at the minimum of the bimodal inter-spike interval histograms (ISI). To determine the phase of each action potential relative to the cortical population activity, we used a previously described method (Slézia et al., 2011). Briefly, the envelope of the cortical multiunit trace (MUA envelope) was low-pass filtered at 4 Hz using a zero phase-shift finite impulse response filter. We calculated the Hilbert-transform of the filtered- and z-scored MUA envelope, and the phase was determined by taking the angle of the complex ‘analytic signal’. The prime advantage of this method is that it estimates the phase of any quasi-rhythmic signal (cortical slow oscillation under ketamine-xylazine anesthesia) in a temporally refined manner, defining a time series that quantifies the “instantaneous phase” of the ongoing oscillation. The circular mean angle was calculated for each recorded neuron, and the inter-quartile range was determined as the ±25th percentile around the circular mean.
27
3.5.4 In-vivo optogenetics and LFP recordings
Two weeks after transfection of PRF cells with an AAV2-EF1a_DIO-hChR2(H134R)-EYFP virus (for control experiments: AAV2-EF1a DIO-EYFP WPRE hGH) GlyT2::cre animals were anaesthetized with ketamine-xylazine (111 and 5 mg/kg) and placed in a stereotaxic frame. The skin was removed over the frontal, parietal and occipital hemispheres and the skull was cleaned with H2O2. All together either six or seven craniotomies were performed;
five for the screw electrodes (two over frontal, two over parietal cortical areas and one over the cerebellum for reference and grounding); one or two for the optic fibers (Thorlabs, FG105UCA, Ø105 µm core, 0,22 NA) over the central lateral thalamic and parafascicular nucleus (Bregma -1.9 to 2.3 mm; lateral -0.8 mm; ventral from cortical surface -2.5 to -2.8 mm). The implant was wrapped in copper grid and fixed with Paladur dental cement. The animal was allowed to recover on a heating pad. Mice were rested in their home cage for at least 5 days before testing.
We used the following custom optical system for fiber optic light delivery in freely moving mice: the beam was generated by a 473 nm DPSS laser (LRS-0473-PFM-00050-03, Laserglow Technologies, Toronto, Canada) and was directed to a fiber optic patchcord (Thorlabs) via a fiber port (Thorlabs). The patchcord (1.6 m) was connected to the mouse and allowed to rotate passively. With adequate beam alignment, rotations induced power fluctuations of less than 5% at the fiber output. The power density measured at the output of the delivery fiber was 318 mW/mm2 for the 200 µm-diameter optic fiber (behavioral experiments) and 1272.73 mW/mm2 for the 100 µm-diameter fiber (electrophysiological experiments).
To monitor brain activity in freely moving animals, we either used bipolar local field potential (LFP) recording electrodes implanted into the frontal cortex, or in a different set of experiments screw electrodes placed above the same cortical area. A screw electrode served as the ground and reference, and was placed over the cerebellum. Both the recording electrodes and the reference electrode were soldered to a 18 Position Dual Row Male Nano- Miniature Connector (A79014-001, Omnetics Connector Corporation, 7260 Commerce
28
Circle East, Minneapolis, MN - 55432). For LFP measurements, 30 second-long stimulations were used (3-5 stimulations per day with 5-10 minutes between them). To record the LFP signals we used a 128 channel amplifier (Amplipex Ltd., Hungary). For wavelet generation, we used homemade MatLab scripts.
Behavioral analysis was performed in Paris by our collaborator Marco M Diana on video recordings of motility experiments independently performed both in Budapest and Paris. The methodological description is quoted from Giber, Diana, Plattner and colleagues (Giber et al., 2015):
“For motility tests each mouse was tested in 6 sessions, with a maximum of one s essi on per day. Duri ng each session, mi ce wer e allow ed t o move fr eel y on an open w hit e platfor m, w hil e being filmed continuous ly via a CCD camera (Guppy Pr o, Alli ed Vi sion Technologi es , St adt roda, Germany) and expos ed to 10 s trai ns of 5 ms li ght puls es del iver ed at 30 Hz ever y minut e for 15 min. Photosti mulat ion t rains w er e signaled on t he vi deo recording by an i nfrared L ED. All aspects of the experiment (photosti mulat ion w avef orm gener ation, MDS and LED control, vi deo recor ding) were controlled using LabVIE W (N ational Inst ruments Corporation, Austin, TX). Movi es were anal yz ed off -line with Et hovisi on (Noldus Technol ogy, Wageningen, Netherl ands ) in order t o ext ract animal traj ectori es an d s peed profi les.
Statist ical comparis ons were perf ormed using the Mann - Whi tney U t est or the Wil coxon s igned rank t est for pai red s ets of data.
Statist ics
Statist ical comparis ons w er e perfor med using the Mann - Whit ney U t est, the Wi l coxon signed rank t est for pair ed sets of data and i n t he case of the data of Figure 3I -J, a pai r ed t test. St atisti cal s ignifi cance was s et at p < 0.05 but the exact values are reported. Results are given as mean ± SEM. No statistical met hods were us ed t o pr edetermi ne sample s i zes but our s ampl e siz es ar e simil ar to thos e r eport ed in previ ous publi cat ions (21, 27, 35) . Equal vari ances w er e not f ormally tested. For mor e det ails , see t he NN reporti ng checkli st. For t he behavi or experiment s mice w er e randoml y ass igned t o hChR2.eY FP and eY FP groups . For anatomi cal, in vitr o and i n vi vo physiol ogi cal experi ments no exclusi on crit eri a was appli ed for the i nitial sel ection and dat a were coll ect ed randomly. Al l physi ol ogy dat a w ere
29
process ed by aut omated s oftwar e, eli minating the possib i lity of bi as es in data processing. The experi ment ers w er e not blind to the conditions of t he animals. A suppl ementar y methods checkl ist is avail abl e. ”
30
4 Results
Part I – Novel source of inhibition in the thalamus
4.1 Distribution of glycinergic fibers in the thalamus, retrograde tracing, origin of the pathway
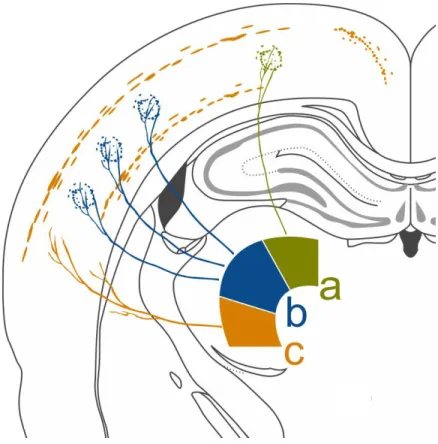
Besides the well known inhibitory input from the GABAergic neurons of the TRN, particular thalamic nuclei recive inhibition from several other sources (Bartho et al., 2002; Bokor et al., 2005; Bodor et al., 2008). These so-called extrathalamic inhibitory inputs, as well as the TRN input, are purely GABAergic. In a GlyT2::eGFP transgenic mouse line, however, we discovered a massive glycinergic inhibitory input innervating the IL thalamic nuclei (Fig.
4.1.1 a-b) (Giber et al., 2015).
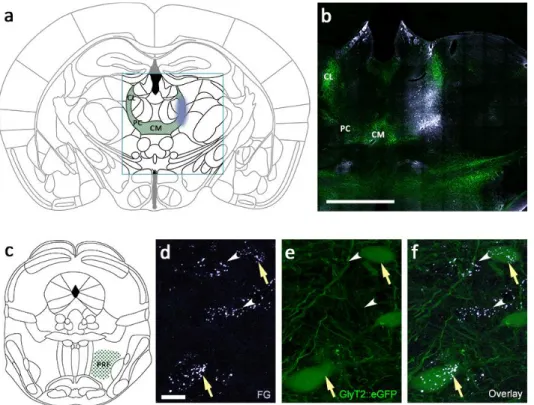
Figure 4.1.1. Retrograde labeling from the IL.
a) Schematic view of the intralaminar thalamic nuclei (green) and the location of fluorogold injection (blue). b) Fluorescent micrograph of the glycinergic fibers and the fluorogold injection in the IL thalamus. c) Schematic view of the nucleus pontis oralis in the brainstem reticular formation. d-f) Retrogradely backlabeled glycinergic (arrow) and nonglycinergic (arrowheads) neurons from the IL in the PRF.
31
To identify the IL-projecting glycinergic neurons, we injected FG as a retrograde tracer among the glycinergic fibers in the thalamus to different antero-posterior coordinates (Fig.
4.1.1 a-b). The injection site was restricted to the CL (Bregma -1.2, -1.4 mm; lateral 0.8 mm;
ventral from cortical surface 3 mm) and Pf (Bregma -2.0, 2.3 mm; lateral 0.8, 0.9 mm; ventral from cortical surface 3.4 mm) of the IL complex. We observed fluorogold-positive backlabeled neurons in the ipsilateral pontine reticular formation (PRF), consisting of the oral and caudal part of the pontine reticular nucleus (PnO and PnC respectively). 55.3% of the thalamus-projecting cells expressed glycine, while the rest were glycine negative (n = 765 cells in 6 animals; Fig. 4.1.1 c-f).
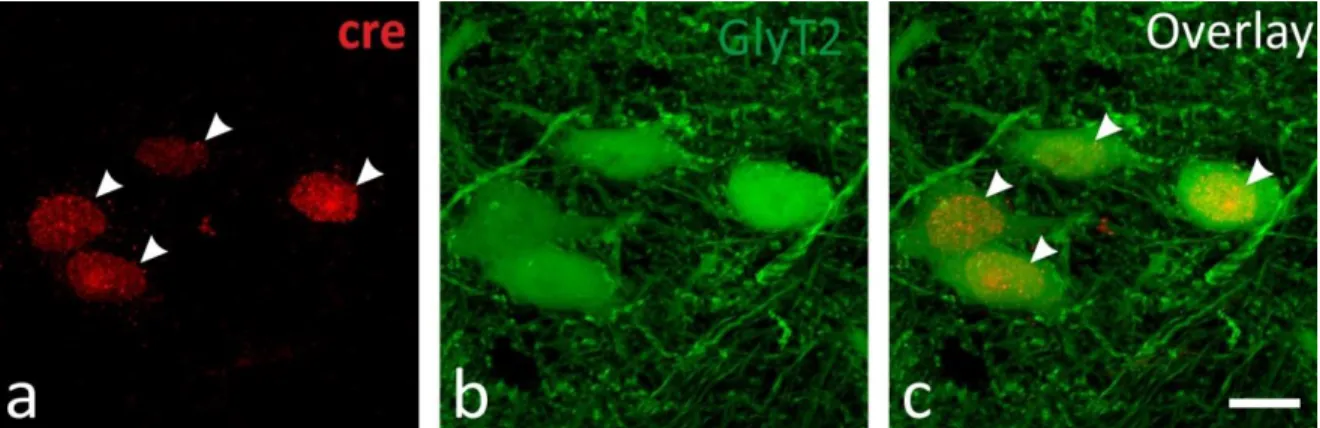
In order to confirm the existence of the pathway and to map the projection pattern of the glycinergic neurons in the forebrain, we anterogradely labeled the glycinergic fibers by injecting a cre-dependent virus construct (see Chapter 3.4.4) into the PRF of GlyT2::cre transgenic mice. Before further analysis, we validated the selectivity of cre expression in glycinergic neurons by crossing the GlyT2::cre and the GlyT2::eGFP lines and performing anti-cre immunostaining. We found that out of 198 cre-positive cells, 196 (99%) were also eGFP positive (Fig. 4.1.2 a-c). After the virus injection, we observed similar fiber distribution patterns in the thalmus as we did in the GlyT2::eGFP transgenic mice (Fig 4.1.3).
Figure 4.1.2. Validation of selective cre expression in the glycinergic neurons.
a) Nuclei of glycinergic cells visualized by cre immunostaining. b) Glycinergic neurons in the PRF. c) Overlay.
32
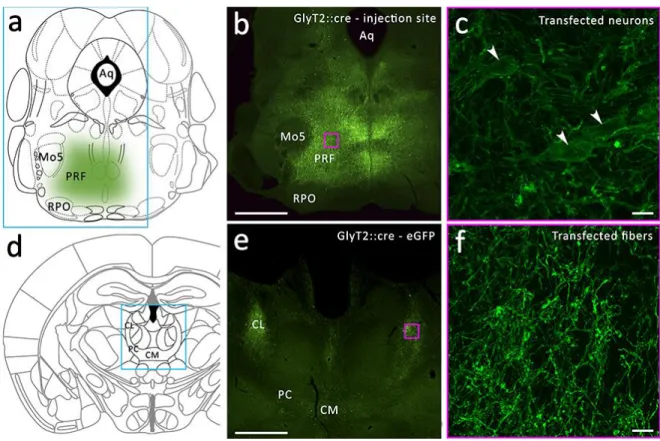
Figure 4.1.3. Anterograde virus tracing from the PRF in GlyT2::cre animals.
a) Schematic view of the injection site in the PRF. b) Fluorescent micrograph of the injection site in the PRF. c) Higher magnification of the transfected glycinergic cells. d) Schematic view of the distribution of the glycinergic fibers in the IL after anterograde labeling. e) Fluorescent micrograph of the transfected glycinergic fibers in the IL. f) High magnification fluorescent micrograph of the glycinergic fibers in the IL.
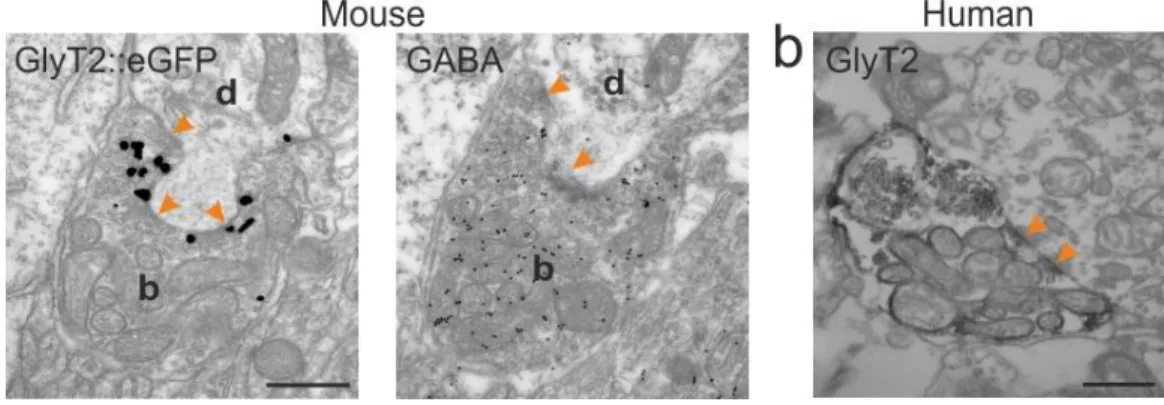
To visualize the innervated thalamic relay cells and to identify the targeted dendritic domain, we used calbindin (CB) – eGFP double immunostaining. We found that the glycinergic neurons targeted the soma and proximal dendritic regions of thalamic neurons (Fig. 4.1.4 b, d). Electron-microscopic analysis and postembedding GABA staining (Somogyi et al., 1985) revealed that the fibers ended in large terminals (5-8 m), coreleased GABA and glycine, and contacted the relay cells via multiple synaptic release sites (2-14). These pre- and postsynaptic structural properties made possible the extremely effective and faithful non- depressing connection between the PRF glycinergic-GABAergic neurons and their thalamic target neurons.