Comparing Green Economy in Iran with OECD Asian Countries by Applying
TOPSIS and GI Method
IMAN AJRIPOUR,
PHDCANDIDATE
UNIVERSITY OF MISKOLC e-mail: szvai@uni‐miskolc.hu
ROSA ALAMIAN
PHDCANDIDATE
UNIVERSITY OF MISKOLC e-mail: szvar@uni‐miskolc.hu
SUMMARY
In this study, we tried to calculate Iran’s green growth index and compare it with four selected OECD countries in the continent of Asia, Turkey, Japan, Korea, and Israel in 2015 by applying the Green Index, and Technique for Order of Preference by Similarity to Ideal Solution. Our research provides a new methodology to rank different countries based on green growth indicators. Applying both methods, Iran ranked fourth among the selected countries. Iran, in comparison to Turkey, Japan, and Korea, is behind in developing sustainability and green economy indices.
Keywords: Green Economy; TOPSIS; Green Index; Iran; OECD Asian Countries.
JEL classification: O13; D81; Q56.
DOI: http://doi.org/10.18096/TMP.2021.02.02
I NTRODUCTION
Green economy concerns how to continue developing the economy without any damage to the environment.
It is created to solve environmental challenges to have sustainable development in different aspects. All the important international organizations including the United Nation Environment Programme (UNEP), Organization for Economic Co-operation and Development (OECD), World Bank, and International Monetary Fund (IMF), and also most governments support and try to follow the concept of the green economy (Tóthné 2014). Accordingly, some researchers are dedicated to this vital and challenging topic.
What is a green economy? This is a question that researchers have tried to answer and most of them refer to UNEP’s definition. According to UNEP, “a green economy is defined as low carbon, resource- efficient and socially inclusive”. Moreover, “UNEP
defines a green economy as one that results in improved human well-being and social equity, while significantly reducing environmental risks and ecological scarcities” (UNEP 2011, p. 2). Therefore, generally, it can be concluded that a green economy is an economy with the notable consideration of reducing environmental hazards in implementing policies. It does not mean that growth in the economy should not be considered. It means that growth should be in the context of ensuring mitigating damage to natural resources and the environment.
According to OECD (2017), being sustainable in the long-term is related to the ability to reduce dependence on natural resources, reduce pollution, and develop the quality of physical and human capital.
However, in developing the living standards of people, the usage of natural resources and ‘heavily polluting technology’ increases. Reliance on these resources to increase the living standards can be effective in the short run. In the long-term, governments should find some new and sustainable
resources. Implementing a green economy can be costly in short term. Politicians mostly are not willing to spend on the short-term cost, although they know it will save general costs in the long term (Sachs 2010).
However, according to Gupta et al. (2019) referred to Gharaei et al. (2019), Hao et al. (2018), and Rabbani et al. (2019), because of the knowledge and awareness of people and the world community about environmental issues and regulatory mandates, there is considerable pressure on private and public sectors to take a responsible look at environmental aspects of production and their supply chains.
The green economy’s issues in Iran motivated us to seek the place of Iran in comparison with Asian OECD countries (Japan, South Korea, Turkey and Israel) based on green growth indices. In Iran, the general policies for developing and implementing green economy were that introduced in 2015 are focused on the following areas (Zistonline, 2019):
1. Low carbon industry, usage of clean energy, healthy and organic agriculture products, and the management of waste and effluents by utilizing economic, social, natural, and environmental capacities.
2. Modify the production pattern in various economic and social sectors and optimize the pattern of water, resources, food, materials, and energy consumption, especially promoting environmentally friendly fuels.
3. Development of green public transport, including electrical ones and generally increasing public transport, especially in metropolitan areas.
In the following of decisions to improve the environmental condition in Iran, in April 2016, the High Representative of the Union for Foreign Affairs and Security Policy and Vice-President (HRVP) Mogherini and Mohammad Javad Zarif (Iran’s foreign minister) reached an agreement on closer cooperation of Iran and EU to develop Iran’s green situation by supporting Iran in the areas of prosperity, planet, and people. Moreover, Iran's sixth national development plan (2016-2021) emphasizes market-based reforms and environmental issues to build a resilient economy (European Commission Statement 2016).
There are some challenges to solve or even improving the green economy situation in Iran, According to the Deputy of production and infrastructure research (2017), the challenges include:
1. The lack of environmental protection culture:
environment protection is seen as a luxury and non-priority issue;
2. Policymaking is person-oriented: changing the approach to the environment by changing the policymakers;
3. Weakness and inefficiency of green civil society organizations: limited numbers and small role of social organizations;
4. High energy consumption and high pollution production: because of the energy subsidies, low-cost access to fuel may cause excessive consumption and produce pollution;
5. The cheap sale of foreign and domestic resources has fueled unnecessary consumption and destruction of natural resources;
6. The dependence of the economy on natural raw materials: the growth and cycle of economic activities in Iran have historically been based on the extraction of natural raw materials such as oil.
The goals of our study are, firstly, to compare Iran with selected OECD countries based on green growth indices in 2015 by using the green index (GI) method, and secondly, applying the Technique for Order Preference by Similarity to Ideal Solution (TOPSIS) as a practical method to rank the countries. In our study, we considered all the green growth indicators and sub-indicators to compare and rank the countries.
Firstly, the countries are ranked based on the green index formula provided by Tóthné (2013; 2014).
Then, TOPSIS, which is a form of Multi-Criteria Decision-Making technique (MCDM), is used to categorize the countries based on green growth indices. Although there are many different MCDM techniques, TOPSIS was chosen in this paper. In comparison to the other MCDM techniques like the Analytical Hierarchy Process, there is no restriction on the number of criteria and alternatives in TOPSIS. In this study, we considered more than 50 sub-criteria of green growth indices.
Calculation procedures in TOPSIS are rather similar to the green index formula except for two considerable differences. In TOPSIS the type (positive or negative) of criterion/index should be determined, while in the green index all the criteria/indices are considered the same type. Also, in TOPSIS the weight of each criterion/index will be calculated while in the green index criteria are not weighted. The weights
may influence the final results. We selected 2015 as the focus year in our study because 2015 was the latest year for which all the required data was available.
To the best of our knowledge, no studies have tried to rank countries based on the green index by applying TOPSIS, although previous studies have been carried out applying multi-criteria decision-making methods, including TOPSIS, in various aspects related to green economies. Some of the studies are as follows. Gupta et al. (2019) applied multi-criteria decision-making (MCDM) for the evaluation of green supplier selection in the Indian automotive industry. Moghadas et al.
(2019) applied the TOPSIS technique, not directly for the green economy, to to rank different districts of urban Tehran in the context of resilience levels. A calculation approach is applied based on a composite index (social, economic, institutional, infrastructural and community capital, and environmental factors of community flood resilience). Barari et al. (2019), using different multi-criteria decision-making models (Decision Making Trial and Evaluation Laboratory (DEMATEL), fuzzy and TOPSIS), evaluated the sustainability indicators of urban transport by the green economy approach in Sari, a city in Iran. A study in Brazil written by Dos Santos et al. (2019) proposed a methodology to evaluate and select the green suppliers with the best environmental performance for the Brazilian furniture industry. For this purpose, they used a hybrid Entropy-TOPSIS-F framework based on the defined criteria. Rashidi &
Cullinane (2019) applied fuzzy data envelopment analysis (DEA) and fuzzy TOPSIS to identify the most preferred sustainable supplier. They used a dataset of logistics service providers in Sweden. Azimifard et al.
(2018) used the analytical hierarchy process (AHP) to determine the weights of sustainability criteria and then applied TOPSIS to evaluate sustainable suppliers for Iran’s steel industry. Rostamzadeh et al. (2015) developed an evaluation model to compute the uncertainty of green supply chain management activities. They used the Vlsekriterijumska Optimizacija I Kompromisno Resenje (VIKOR) method to solve a green multi-criteria decision- making problem. Freeman and Chen (2015) used an AHP-Entropy-TOPSIS framework to focus on the development of a green supplier selection model.
They used a Chinese-based electronic machinery manufacturer as their case company. In the following, we will discuss green indices in Section 2 and methodology in Section 3. Results are explained in Section 4 and finally our conclusions and limitations of the study are presented in Section 5.
G REEN I NDICES
In the previous sections, we discussed the context of the green economy and its importance. To work on developing green situations in a country, the first step is to find out the ranking of the country based on green economy standards. Then, it would be necessary to determine how green economy indices should be measured. The green economy can be measured in different ways. Here we introduce only two green indices, the Environmental Performance Index (EPI) and Green Index (GI). We are explaining EPI because most of the previous studies about Iran's green economy situation are described by EPI. Then, in Sections 2.2, we shortly explain Green Index.
EPI
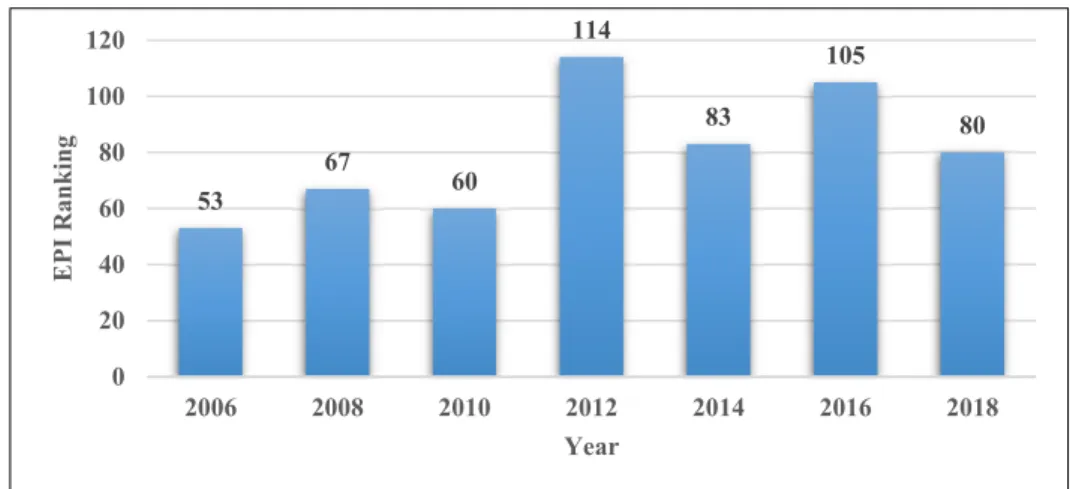
To show Iran’s green economy situation, the Environmental Performance Index (EPI) could be a good example. “The 2018 Environmental Performance Index (EPI) ranks 180 countries based on 24 performance indicators across ten issue categories covering environmental health and ecosystem vitality” (Wendling et al. 2018, p.vi). As we discussed in the introduction, the general policies for developing and implementing a green economy in Iran were introduced in late 2015. Iran’s EPI ranking (2006- 2018) is shown in Figure 1. The higher the EPI ranking, the worse the situation of the country in the green economy. In another word, a lower number indicates a better ranking place. As is shown in Figure 1, the EPI index was very high in 2016, but fortunately, the rank fell from 105 to 80 in two years (2016-2018). It may show that the implementation of this policy had been successful between 2016 and 2018. However, Iran’s situation in the green economy is not satisfying in general.
Source: Deputy of production and infrastructure research (2017); Wendling et al. (2018).
Figure 1: EPI ranking for Iran, 2006-2018
To identify in which category Iran needs to work on more, it might be a good idea to look at the issue categories of the EPI Index in 2018, as shown in Figure 2. Based on the ranking in the figure, the five
most critical categories are heavy metals, air pollution, climate and energy, biodiversity and habitat, and finally ecosystem vitality.
Source: Country profile Iran (2018). https://epi.yale.edu/sites/default/files/2018-irn.pdf Figure 2. EPI Index for Iran by issue categories, 2018 53
67 60
114
83
105
80
0 20 40 60 80 100 120
2006 2008 2010 2012 2014 2016 2018
EPI Ranking
Year
Green Index (GI)
Tóthné (2014, p. 62), presents an index which is called the Green Index (GI) to means to “measure, express and at the same time compare the state and progress of countries toward green economy”.
According to Tóthné (2018), the ability to compare across countries is one important advantage of this index. To calculate the green index for a country, the authors used a group of indices that are introduced in the OECD as green growth indicators (the calculation for the Green Index is given in Section 3.3). They calculated this index for OECD countries and compared the countries with each other. Interestingly, in their research, they found that although OECD countries are on the way to reaching a green economy, they are still quite far from the ideal.
M ETHODOLOGY
In this study, the green index proposed by Tóthné (2013; 2014), is calculated for Iran and four OECD selected countries: Japan, South Korea, Turkey, and Israel. Then, the TOPSIS technique is applied to find Iran’s place among the selected countries. Finally, the results of these two methodologies are compared.
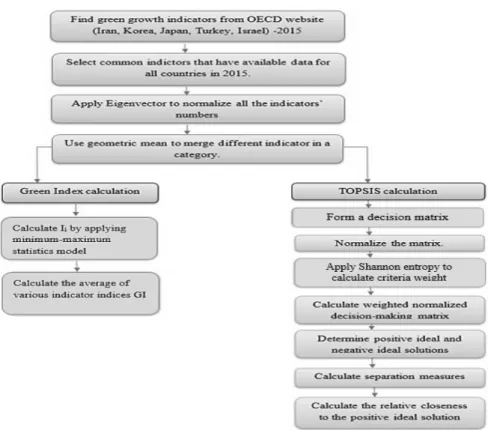
Due to the large number of indices in this study 53 (X) , before the calculation of green growth indicators with the help of the min-max statistics model, all the variables in a category are merged into one variable.
For example, variables like production-based CO2
productivity, production-based CO2 intensity, and production-based CO2 emissions are merged into one variable, CO2 productivity. Before merging the variables, all the variables should be normalized by applying an eigenvector. Then the geometric mean is used to calculate and to merge indicators in a category for one country. After that, both calculation methods (GI and TOPSIS) are applied to rank Iran and OECD selected countries in the green economy.
Figure 3. The methodology of calculation of GI in this study
The eigenvector method
To normalize the indicators and reach a unique unit for all indicators, we applied an eigenvector. For example, the unit of production-based CO2 intensity and energy- related CO2 per capita is tonnes but the unit of renewable energy supply is percentage (OECD 2015).
Saaty’s eigenvector method, which is known also as the linear normalization method, is a technique to generate weights and normalization of a vector. The eigenvector gives us the final weights (Wij). The weights are the average of all possible ways to compare the alternatives. The calculation of the eigenvector is shown in Equation (1).
Wij=𝑎 /∑ 𝑎 i= 1,2,…, m j=1,2,…, n (1) where aijrepresents the numerical value of criterion i for alternative j (Saaty and Vargas 1984).
Geometric mean
The geometric mean is determined as the nth root of the values. The calculation of the geometric mean for a data set like {x1, x2 ,... , x n} is shown in Eq. (2) (Yousefi and Carranza 2015).
GA(x1, x 2, ..., x n) = ∏ 𝑥 = √𝑥 .𝑥 . … .𝑥 (2)
(2) where n is the total number of values.
The geometric mean has been employed in different articles. In the study of Dong et al. (2010), decision-makers applied the weighted geometric mean technique to sum individual judgment matrices. To reach the values in the consensus matrix in the Fuzzy Analytical Hierarchy Process (FAHP) computations procedure Anojkumar et al. (2014) applied the geometric mean. Another study in 2019 stated that the geometric mean is applied to integrate a comparison matrix of criteria for all decision-makers under a fuzzy environment (Gupta et al. 2019). Wu et al. (2010) also applied geometric mean to sum evaluators’ values up.
In another study, authors utilized geometric average to combine individuals’ judgments to reach a group
judgment for integrating answers coming from the decision-making group (Liu et al. 2019).
After computing the eigenvector to normalize all indices and applying the geometric mean to merge the indices in each variable category, the green index can be calculated as follows.
Calculation of the green index
To calculate different countries’ indicator indices, firstly the OECD green growth indicators should be applied. For this purpose, the “minimum-maximum statistics model” is used (Tóthné 2013; 2014).
Ii = 𝑋 𝑋 / 𝑋 𝑋 where:
Ii : the index of the different indicator (1–n);
Xi : the selected indicators;
Xmin: the minimum value of the selected indicator in the selected countries (in a specified year).
Xmax: the maximum value of the selected indicator in the selected countries (in a specified year).
Secondly, the average of the different indicator indices should be calculated to gain the Green Index (GI).
GI= ∑ 𝐼/𝑛 (3)
TOPSIS (Technique for Order Preference by Similarity to Ideal Solution) Method
TOPSIS is one of the most commonly used multi- criteria decision-making methods presented by Hwang and Yoon (1981) that use simple logic. This method makes an ideal alternative and an anti-ideal alternative. In this method, based on the lowest interval from the ideal alternative and the most interval from the anti-ideal alternative, all alternatives are ranked. It is a fast and relatively easy method with an organized procedure (Shanian and Savadogo 2006;
Irfan and Nilsen 2009; Wang and Chang 2007; Wang and Elhag 2006).
To solve an MCDM problem, some scholars have proposed the TOPSIS. A combination of TOPSIS and AHP logical procedure is proposed by Rao and Davim (2008) for engineering design. Applying TOPSIS is proposed by Ho et al. (2010) to evaluate and select an ideal supplier. To evaluate the performance of groundwater quality, Peiyue et al. (2011) used TOPSIS based on entropy weight. Rouhani et al.
(2012) approached fuzzy TOPSIS to assess the business systems.
There is an important advantage in applying TOPSIS in comparison to the other MCDM methods like AHP. There is no limitation to the number of criteria and alternatives in TOPSIS, while in other techniques like AHP, there is a limitation. Too many criteria and alternatives in other MCDM techniques like AHP make the problem overly complex and sometimes it would be hard to solve such problems.
The reason that we applied TOPSIS in this study is not only the advantage of this method’s unlimited number of criteria and alternatives, but the fact that this method has not been applied in prioritizing countries based on their green growth indices.
In our research, the green growth indicators are considered as criteria. Iran and the selected OECD countries are taken into account as alternatives.
Therefore, applying TOPSIS as an MCDM technique for ranking countries based on green growth indicators is reasonable.
The TOPSIS technique steps are described below (Ajripour et al., 2019).
1. Convert all criteria into quantitative criteria after making a decision matrix.
2. Normalize the decision matrix and name it ND. 3. Calculate the weight of all criteria by applying
Shannon entropy (Wj).
4. Compute the weighted normalized decision- making matrix (A) by multiply𝑊. 𝑁 .
𝐴
𝑎 ⋯ 𝑎
⋮ ⋱ ⋮
𝑎 ⋯ 𝑎 𝑊. 𝑁 5. Determine Aj+ and Aj-
Aj+= best positive value for each index in matrix A (positive ideal solution)
Aj- = best negative value for each index in matrix A (negative ideal solution)
In affirmative indicators, the best value is the highest and the worst is the lowest, while in the indicators which are not positive (negative indicators), the best value is the lowest and the worst is the highest.
6. Calculate the distance of aij from (Aj+) and (Aj-):
𝐷 ∑ 𝑎 𝐴
i=1,2,…,m
(4)
𝐷 ∑ 𝑎 𝐴 i=1,2,…,m
(5)
7. Compute the relatively short distance to the affirmative ideal solution.
𝐶𝑙∗ 𝐷 / 𝐷 𝐷
(6) The higher the 𝐶𝑙∗ value, the higher the rank of
alternative.
To find out the rank of the countries by applying the TOPSIS method and based on green growth indices, firstly we have to make the decision matrix (Table 1) based on the data we gathered from OECD green growth indicators. Eight indicators or criteria are considered (C1,… , C8), to compare five countries (A1, …, A5). You can see the criteria and alternatives in Table 2. All the data are normalized by applying a geometric mean (ND). Then the weight of each criterion is computed by employing Shannon entropy (Wj). In the next step, the weight of each criterion should be multiplied by the values in the decision matrix (for example W1= 0.122 should be multiple to all normalized data in column C1). Using Equations (4) and (5), the positive ideal and negative ideal solutions will be determined. Finally, applying Equation (6), the countries are ranked based on green growth indicators (Table 3).
Table 1 Decision Matrix
Wj 0.122 0.122 0.122 0.123 0.132 0.133 0.126 0.121
Criteria
Type + + + + - + + +
C1 C2 C3 C4 C5 C6 C7 C8
A1 0.18 0.15 0.18 0.13 0.28 0.03 0.06 0.15
A2 0.17 0.24 0.13 0.10 0.17 0.04 0.40 0.18
A3 0.21 0.15 0.22 0.15 0.11 0.25 0.21 0.21
A4 0.24 0.20 0.12 0.1 0.00 0.30 0.14 0.16
A5 0.12 0.12 0.10 0.20 0.11 0.08 0.19 0.17
∑aij^2 0.2 0.2 0.1 0.1 0.1 0.2 0.3 0.2
√ 0.4 0.4 0.3 0.3 0.4 0.4 0.5 0.4 Source: Authors’ Calculation
R ESULTS
Applying GI, the greenest country among the selected countries is Korea, and the least green country is Israel
(A3 ≻A2 ≻A4 ≻A1 ≻A5). Iran is ranked in fourth place.
Table 2
Iran and OECD selected countries ranking in terms of GI
Year 2015 Country
A1- Iran A2-Turkey A3- Korea A4- Japan A5- Israel A1- Iran A2-Turkey A3-Korea A4-Japan A5-Israel
Variable Min Max li
Environmental and resource productivity
C1: CO2
Productivity 0.18 0.17 0.21 0.24 0.12 0.12 0.24 0.56 0.45 0.78 1.00 0 C2: Energy
productivity 0.15 0.24 0.15 0.20 0.12 0.12 0.24 0.26 1.00 0.19 0.70 0 Natural asset
base
C3: Freshwater
resources 0.18 0.13 0.22 0.12 0.10 0.1 0.22 0.62 0.24 1.00 0.14 0
C4: Land
resources 0.13 0.10 0.15 0.08 0.20 0.08 0.2 0.46 0.20 0.59 0.00 1 Environmental
dimension of quality of life
C5: Exposure to environmental
risks 0.28 0.17 0.11 0.00 0.11 0 0.28 1 0.61 0.40 0.00 0.40
Economic opportunities
C6: Technology and innovation:
Patents
0.03 0.04 0.25 0.30 0.08 0.03 0.3 0 0.06 0.79 1.00 0.18
and policy responses
C7:
Environmental taxes and transfers
0.06 0.40 0.21 0.14 0.19 0.06 0.4 0 1 0.44 0.25 0.40
C8: Socio-economic context 0.15 0.18 0.21 0.16 0.17 0.15 0.21 0 0.54 1 0.16 0.2 GI 0.36 0.51 0.65 0.40 0.28 Source: Authors’ Calculation
Considering green growth indicators as criteria and the selected countries as alternatives in the
TOPSIS procedure, alternatives are ranked as follows:
A3 ≻ A4 ≻ A2 ≻ A1 ≻ A5. Iran is placed in the fourth place.
Table 3
Iran and OECD selected countries ranking by using the TOPSIS method
Country 𝐶𝑙∗ Rank
A1 Iran 0.2897 4
A2 Japan 0.2904 3
A3 Korea 0.651 1
A4 Turkey 0.480 2
A5 Israel 0.153 5
Source: Authors’ Calculation
C OMPARISON OF TOPSIS AND GI RANKING
Applying the methodology – the green index and TOPSIS methods – Iran and selected OECD countries can be ranked based on green growth indices in 2015.
The country ranking based on GI is as follows: Korea
≻ Japan ≻ Turkey ≻ Iran ≻ Israel. The country ranking based on TOPSIS is also Korea ≻ Turkey ≻ Japan ≻ Iran ≻ Israel. Comparing the countries’ final ranking based on the two methods, Iran ranked fourth among the five countries. Korea and Israel are in the first and fifth place, respectively. So, South Korea is the greenest country among the five countries. It is shown that both techniques provided almost the same
results; the only difference is the rank of Turkey and Japan. It can be concluded that the TOPSIS could be a reliable technique to calculate the ranking of countries based on green growth indices.
Previously, in Section 2.1, we have shown that generally, the rank of Iran in the green economy was not satisfactory. The calculated result of our study also shows Iran does not have a good situation in the green economy, because it is ranked fourth among the five selected countries.
C ONCLUSION AND LIMITATION
Talking about the green economy brings a variety of issues to the debate. Governments, especially in third world countries, sometimes are not willing to put so
much effort into this issue; they consider it as an expensive plan. However, the Green Economy is becoming one of the most critical issues in the world, and governments should not avoid the issue.
Accordingly, it is vital to measure the place of each country in the green growth economy situation. The green economy can be measured in different ways. In our study, two green indices, EPI and GI, are explained. Based on the latest report of issue categories of the EPI Index, Iran did not have a good situation in the environmental performance index.
Also, the green index result represents that Iran needs a great deal of effort to decrease its distance from the greenest countries, like Korea in this study.
There are two main steps in our study, first: the comparison of Iran and selected OECD countries (Turkey, Japan, Korea, and Israel) based on green growth indices in 2015 by using the GI method, and second: applying TOPSIS as a practical method to rank the countries. Calculation procedures in TOPSIS are almost the same as the green index formula.
However, there are two considerable differences: (1)
in TOPSIS the type (positive or negative) of criteria/indices should be determined, while in the green index all the criteria/indices are considered the same type, and (2) in TOPSIS the weight of each criterion/index is calculated while in the green index the weights of criteria are not considered.
Applying the methodology, countries are ranked based on 53 green growth indices. Results represented that Iran is not sustainable in green growth indices in comparison to Korea, Turkey, and Japan.
The limitation of our research is the lack of data for some indicators which are not recorded on the OECD website in 2015. Also, the data for the years after 2015 was not completely available for the selected countries.
For future studies, we strongly suggest using some other MCDM techniques such as AHP, ELECTRE, and Fuzzy MCDM. Considering all of the green growth indices in MCDM calculation methods may take too much time, so screening some important green growth indices to compare countries’ green growth indices would be recommended.
REFERENCES
AJRIPOUR, I., ASADPOUR, M., & TABATABAIE, L. (2019). A model for organization performance management applying MCDM and BSC: a case study. Journal of Applied Research on Industrial Engineering, 6(1), 52-70 ANOJKUMAR L., ILANGKUMARAN M., & SASIREKHA V. (2014). Comparative analysis of MCDM methods
for pipe material selection in sugar industry. Expert Systems with Applications, 41(6), 2964-2980.
https://doi.org/10.1016/j.eswa.2013.10.028
AZIMIFARD A., MOOSAVIRAD S. H., & ARIAFAR S. (2018). Selecting sustainable supplier countries for Iran's steel industry at three levels by using AHP and TOPSIS methods. Resources Policy, 57, 30-44.
https://doi.org/10.1016/j.resourpol.2018.01.002
BARARI M., RAZAVIAN M., & TAVAKKOLINIA J. (2019). Evaluation of sustainable urban transport indicators using by green economy approach (case study: Sari city). Journal of Geographical Space Preparation, 8(30), 104- 120.
COUNTRY PROFILE IRAN (2018). Environmental performance index. Retrieved: November 2020:
https://epi.yale.edu/sites/default/files/2018-irn.pdf .
DEPUTY OF PRODUCTION AND INFRASTRUCTURE RESEARCH (2017). ﺩﺮﮑﻠﻤﻋﺺﺧﺎﺷﺭﺩ ﻥﺍﺮﺍﻳ ﻩﺎﮕﻳﺎﺟﯽﺳﺭﺮﺑ ﺠﻣ
ﻴ ﻂ ﺯ ﻳ
ﺖﺴ (EPI) ﺮﺗﺮﺑ ﻪﺒﺗﺭ یﺍﺭﺍﺩ یﺎﻫﺭﻮﺸﮐ ﯽﺧﺮﺑ ﺎﺑ ﻪﺴﻳﺎﻘﻣ ﻭ (Investigating Iran's position in the Environmental Performance Index (EPI) and comparing it with some of the top-ranked countries). 2017. Retrieved: October 2020:
https://rc.majlis.ir/fa/report/show/1036805 .
DONG Y., ZHANG G., HONG W. C., & XU Y. (2010). Consensus models for AHP group decision making under row geometric mean prioritization method. Decision Support Systems, 49(3), 281-289.
https://doi.org/10.1016/j.dss.2010.03.003
DOS SANTOS B. M., GODOY L. P., & CAMPOS L. M. (2019). Performance evaluation of green suppliers using entropy-TOPSIS-F. Journal of Cleaner Production, 207, 498-509. https://doi.org/10.1016/j.jclepro.2018.09.235
EUROPEAN COMMISSION STATEMENT (2016). Retrieved: October 2020: http://europa.eu/rapid/press- release_STATEMENT-16-1441_en.htm.
FREEMAN J, & CHEN T. (2015). Green supplier selection using an AHP-Entropy-TOPSIS framework. Supply Chain Management: An International Journal, 20(3), 327 – 340. https://doi.org/10.1108/scm-04-2014-0142 GHARAEI A., KARIMI M., & HOSEINI SHEKARABI S. A. (2019). Joint Economic Lot-sizing in Multi product
Multi-level Integrated Supply Chains: Generalized Benders Decomposition. International Journal of Systems Science: Operations & Logistics, 1–17.
GUPTA S., SONI U., & KUMAR G. (2019). Green supplier selection using multi-criterion decision making under fuzzy environment: A case study in automotive industry. Computers & Industrial Engineering, 136, 663-680.
https://doi.org/10.1016/j.cie.2019.07.038
HAO Y., HELO P., & SHAMSUZZOHA A. (2018). Virtual factory system design and implementation: Integrated sustainable manufacturing. International Journal of Systems Science: Operations & Logistics, 5(2), 116–132.
https://doi.org/10.1080/23302674.2016.1242819
HO W., XU X., & DEY P. K. (2010). Multi-criteria decision making approaches for supplier evaluation and selection:
A literature review. European Journal of Operational Research, 202, 16–24.
https://doi.org/10.1016/j.ejor.2009.05.009
HWANG C L, & YOON K. (1981). Multiple Attribute Decision Making. Lecture Notes in Economics and Mathematical Systems series, no. 186. Springer-Verlag, Berlin
IRFAN E., & NILSEN K. (2009). Performance evaluation of Turkish cement firms with fuzzy analytic hierarchy process and TOPSIS methods. Expert Systems with Applications, 36, 702–715.
https://doi.org/10.1016/j.eswa.2007.10.014
LIU H. C., QUAN M. Y., LI Z., & WANG Z. L. (2019). A new integrated MCDM model for sustainable supplier selection under interval-valued intuitionistic uncertain linguistic environment. Information Sciences, 486, 254- 270. https://doi.org/10.1016/j.ins.2019.02.056
MOGHADAS M., ASADZADEH A., VAFEIDIS A., FEKETE A., & KÖTTER T. (2019). A multi-criteria approach for assessing urban flood resilience in Tehran, Iran. International Journal of Disaster Risk Reduction, 35, 101069.
https://doi.org/10.1016/j.ijdrr.2019.101069
OECD (2015). Green Growth Indicators. Retrieved: November 2020: https://stats.oecd.org/Index.aspx# .
OECD (2017). Green Growth Indicators. Retrieved: October 2020. http://www.oecd.org/greengrowth/green-growth- indicators/ .
PEIYUE L., QIAN, H., & JIANHUA W. U. . (2011). Hydrochemical formation mechanisms and quality assessment of groundwater with improved TOPSIS method in Pengyang county Northwest China. Journal of Chemistry, 8(3), 1164–1173. https://doi.org/10.1155/2011/251918
RABBANI M., FOROOZESH N., MOUSAVI S. M., & FARROKHI-ASL H. (2019). Sustainable supplier selection by a new decision model based on interval-valued fuzzy sets and possibilistic statistical reference point systems under uncertainty. International Journal of Systems Science: Operations & Logistics, 6(2), 162–178.
https://doi.org/10.1080/23302674.2017.1376232
RAO R. V, & DAVIM J. P. (2008). A decision-making framework model for material selection using a combined multiple attribute decision-making method. The International Journal of Advanced Manufacturing Technology, 35(8), 751–760. https://doi.org/10.1007/s00170-006-0752-7
RASHIDI K, & CULLINANE K. (2019). A comparison of fuzzy DEA and fuzzy TOPSIS in sustainable supplier selection: Implications for sourcing strategy. Expert Systems with Applications 121, 266-281.
https://doi.org/10.1016/j.eswa.2018.12.025
ROSTAMZADEH R., GOVINDAN K., ESMAEILI A., & SABAGHI M. (2015). Application of fuzzy VIKOR for evaluation of green supply chain management practices. Ecological Indicators, 49, 188-203.
https://doi.org/10.1016/j.ecolind.2014.09.045
ROUHANI S., GHAZANFARI M., & JAFARI M. (2012). Evaluation model of business intelligence for enterprise systems using fuzzy TOPSIS. Expert Systems with Applications, 39 (3), 3764–3771.
https://doi.org/10.1016/j.eswa.2011.09.074
SAATY T. L, & VARGAS L. G. (1984). Comparison of eigenvalue, logarithmic least squares and least squares methods in estimating ratios. Mathematical Modelling, 5(5), 309-324. https://doi.org/10.1016/0270- 0255(84)90008-3
SACHS J. (2010). Sow the Seeds of Long-Term Growth. Article, Huffington Post. Retrieved: October 2020:
http://www.huffingtonpost.com/jeffrey-sachs/sow-the-seeds-of-long-ter_b_655770.html .
SHANIAN A, & SAVADOGO O. (2006). TOPSIS multiple-criteria decision support analysis for material selection of metallic bipolar plates for polymer electrolyte fuel cell. Journal of Power Sources, 159 (2), 1095–1104.
https://doi.org/10.1016/j.jpowsour.2005.12.092
ZISTONLINE, (2019). ﻥﺍﺮﻳ ﺍ ﺭﺩ ﻥﺁ ﺖﻴ ﻌﺿﻭ ﻭ ﺰﺒﺳ ﺩﺎﺼﺘﻗﺍ ﻩﺎﮕﻳﺎﺟ (The green economic situation in Iran). January 27th 2019.
Retrieved: October 2020: https://www.zistonline.com/news/79820/ﻥﺍﺮ ﻳﺍ -ﺭﺩ- ﻥﺁ -ﺖﻴﻌﺿﻭ -ﻭ- ﺰﺒﺳ-ﺩﺎﺼﺘﻗﺍ -ﻩﺎﮕﻳﺎﺟ/do.
TÓTHNÉ K S. (2013). Az OECD országok zöld modellje in: Bartha, Z., A.S. Gubik, Klára Szita Tóthné (eds) : Intézményi megoldások, fejlődési modellek. GNR Szolgáltató és Kereskedelmi Bt., 157-179.
TÓTHNÉ K S. (2014). Green Growth in the OECD: State of the Art. Theory, Method and Practice, 10(2), 59-65.
TÓTHNÉ K S. (2018). The Green Development as a New Sustainability Model–Advantages and Critical Issues of Resource Management and Environmental Protection. In: G. Finszter & I. Sabjanics (eds.), Security Challenges in the 21st Century. Dialog Campus Publishing: Budapest. pp. 587–616.
UNEP. (2011). Towards a Green Economy: Pathways to Sustainable Development and Poverty Eradication - A Synthesis for Policy Makers. United Nations Environment Programme. Retrieved: October 2020:
www.unep.org/greeneconomy
WANG T. C., & CHANG T. H. (2007). Application of TOPSIS in evaluating initial training aircraft under a fuzzy environment. Expert Systems with Application, 33 (4), 870–880. https://doi.org/10.1016/j.eswa.2006.07.003 WANG Y. M., & ELHAG T. M. S. (2006). TOPSIS method Fuzzy based on alpha level sets with an application to
bridge risk assessment. Expert Systems with Applications, 31 (2), 309–319.
https://doi.org/10.1016/j.eswa.2005.09.040
WENDLING Z. A., EMERSON J. W., ESTY D. C., LEVY M. A., DE SHERBININ A., & ET AL. (2018).
Environmental Performance Index. New Haven, CT: Yale Center for Environmental Law & Policy. Retrieved:
October 2020: https://epi.yale.edu/ .
WU CS., LIN CT., & LEE C. (2010). Optimal marketing strategy: A decision-making with ANP and TOPSIS.
International Journal of Production Economics, 127(1), 190-196. https://doi.org/10.1016/j.ijpe.2010.05.013 YOUSEFI M., CARRANZA E. J. M. (2015). Geometric average of spatial evidence data layers: a GIS-based multi-
criteria decision-making approach to mineral prospectivity mapping. Computers & Geosciences 83: 72-79.
https://doi.org/10.1016/j.cageo.2015.07.006