Measurement of Creative
Accounting by Transparency and Disclosure Index (TDI)
Method in Automobile Industry
ervin denich
Budapest Business School denich.ervin@gmail.com
dániel Hajdu
Nokia Solutions and Networks Kft.
hajdudaniel.hd@gmail.com
Summary
investigation of relationship between corporate governance and creative accounting came to the front after some accounting scandals (like enron, WorldCom or Satyam). Corporate governance is an actual topic to discuss due to the its correlation to creative accounting. Application of creative accounting techniques might suggest some weaknesses of a company. in this study we investigate the relationship between corporate governance and creative accounting by applying transparency and disclosure in- dex (tdi) method, which enables to evaluate corporate structure, transparency of operation and disclosure of company related information, based on publicly available data. Then, in order to measure the accounting manipulation, we analyse financial performance measures. Furthermore, we perform a correlation analysis to assess the strength of relationship between corporate governance and creative accounting. As a conclusion, we are able to describe a medium negative correlation between the two aspects under investigation.
Keywords: accounting regulation, creative accounting, corporate governance, correlation analysis, transparency and disclosure index
JeL codes: M40, M41
dOi: https://doi.org/10.35551/PFQ_2021_3_4
Accounting regulAtion
Pursuant to the introduction of Act C of 2000 on Accounting: ‘The operation of a market economy requires the availability of objective information regarding the assets and liabilities, financial position and profits and losses of businesses, non-profit oriented organizations and other types of economic operators, including trends and changes thereof, so as to enable market players to make informed decisions relying on the information available’.
This information is produced by accounting, which is interpreted by Sztanó (2019) in two dimensions. On the one hand, it is a means of providing information, as – according to the objective of the accounting law – it provides information on the assets of the business, any changes thereof, and whether the utilisation of the assets is successful, i.e.
what is the volume of the earnings achieved by the business. On the other hand, it is a practical activity that monitors, measures and records the movements and changes of assets and the development of earnings, and provides information about these. According to Budai (2006), these pieces of accounting information form a clean-cut part of the total information asset of companies, a set of information recorded by the accounting it system. These are required, on the one hand, for market players and external users, who are primarily interested in the assets and the financial and income status of the business, and, on the other hand, for management decisions and audits within the business, i.e.
for internal users.
As far as accounting information systems are concerned, two methods of recording data can be distinguished. in the case of single- entry bookkeeping, the records follow the cash flow, and economic events are recorded together with the circulation of money. The other method is double-entry bookkeeping,
which focuses on the results, therefore it records economic events independently of the cash flow. According to Tóth (2020), accrual- based accounting may result in increased comparability, up-to-dateness, transparency and reliability. Simon et al. (2018) are of the same opinion, they believe that the introduction of accrual-based accounting in the public sector is able to give a comprehensive and real picture of the financial and economic situation of the public sector, as well as of the development in the values of assets and liabilities and incomes and expenses. However, these statements are true in the competitive sector, too, not only in the public sector.
Overall, accounting can be considered an information system that satisfies information demands. information demands against companies are raised by the users of accounting reports, they are the company’s stakeholders.
Persons and groups that are able to influence the performance of the company in any way may have impact on the strategy of the company as well (Hill, Jones 2008), i.e. they are the participants of accounting manipulation.
These stakeholders are illustrated by Figure 1.
creAtive Accounting
As accounting activities are regulated by different rules, acts of law and provisions in every country, lawmakers and the developers of standards attempt to create rules that are worded as accurately as possible. Provisions, however, are not able to fully cover the whole area of financial accounting that forms the basis of reporting, consequently, the participants of accounting manipulation influence the figures, and use various tools to shape them according to their own interests.
in international literature, the most frequently used terms regarding manipulation are earnings management and creative accounting.
Creative accounting has the following names:
cooking the books (Lomax, 2003), window dressing (teoh et al., 1998), income smoothing (Chong, 2006), aggressive accounting (Mulford, Comiskey, 2002), massaging the numbers/
figures (ACCA, no date), cosmetic accounting (Karim et al., 2011).
Not even the examined literature seems to suggest a uniform and exact definition for creativity in accounting. Similarly, there is no unity in the assessment of creative accounting, either. Schipper (1989) uses the term earnings management to express the manipulation of disclosure (disclosure management) and the planned intervention in the processes of financial reporting. According to Naser (1993), creative accounting is a process that takes advantage of gaps in rules, manipulates accounting information, and – by (ab)using
flexibility – selects measurement, assessment and informal methods that modify accounting reports according to managers’ expectations.
According to Healy, Wahlen (1999), we can talk about earnings management when managers use judgment in financial reporting to alter financial reports to either mislead some stakeholders about the economic performance of the company or to influence contractual outcomes that depend on reported accounting numbers. Mulford and Comiskey (2002) mention earnings management and creative accounting as different terms, however, Amat and Gowthorpe (2004) consider the names of creative accounting and earnings management synonyms in their works, and describe creativity in accounting as the transformation of accounting reports by using accounting choices, estimates and other methods allowed
Figure 1 ParticiPants of accounting maniPulation
Source: own editing, on the basis of Stolowy-Breton’s (2004) diagram investors
• Actual
• Potential
(including shareholders, funds, buy-side analysts)
mediators
• Stock brokers
• Sell-side analysts
• Signatories
• Auditors
• Managers
• Employees
• State
• Local Government
other stakeholders
• Trade unions
• Buyers
• Suppliers
market comPany society
by accounting regulations. in his book, Jones (2011) refers to the fact that the American definition (by Mulford and Comiskey), based on which creative accounting includes fraud, too, is inconsistent with the english definition, which separates fraud from creative accounting.
Creativity should not mean cheating today, either, instead, it should be an adjective praising the accounting manager – and acknowledging his/her work – who manoeuvres among legal provisions, applies legal bookkeeping solutions, does some thinking and uses clever, active and inventive bookkeeping techniques (Lukács, 2007).
When studying the international literature, it becomes clear that there are some differences among individual interpretations. This is reflected in the following quote: ‘creative
accounting is a tool which is much like a weapon.
If used correctly, it can be of great benefit to the user; but if it is mishandled or goes into the hands of the wrong person, it can cause much harm.’ (Shah et al., 2011, p. 531.) Some believe that creative accounting and earnings management are the same, but not identical to fraud, and interpret creative accounting in a positive sense. By contrast, others think that creative accounting includes fraud, too, which constitute a negative interpretation.
Figure 2 illustrates the separation of the two different meanings of creative accounting, presented on the basis of Kaminski’s (2014) study. Accordingly, we can talk about creative accounting with a positive and negative meaning. in the first case, we can use the creative tools to produce an accounting report that gives a reliable and true picture, while in
Figure 2 seParation of creative accounting and aggressive accounting
Source: own editing, based on Kaminski (2014)
creative accounting
Positive meaning negative meaning (AggreSSive Accounting)
fair accounting rePort
meaning
the latter case, this is not possible, and owing to aggressive accounting, creativity can be considered illegal.
Starting from the deliberateness behind the application of creative technologies, we can find two related legal terms, the commitment of fraud and the violation of the accounting regulations. Therefore, it is important to ask the following questions: what qualifies as fraud and the violation of the accounting regulations?
Concerning Hungarian legislation, it is worth mentioning two related paragraphs, both from Act C of 2012 on the Criminal Code (hereinafter: Criminal Code). The Criminal Code defines fraud in Section 373 (1), based on which ‘fraud’ shall mean when a person uses deceit, deception, or trickery for unlawful financial gain, and thereby causes damage.”
The violation of the accounting regulations is discussed in Section 403 (1) of the Criminal Code, based on which ‘Any person who infringes the documentation system or violates the annual reporting, bookkeeping and auditing obligations prescribed in the Accounting Act or in the regulations adopted under its authorization, and thereby causes an error that is construed as having a significant impact on true and fair view; or prevents the overview or inspection of his financial situation in the given financial year’
From an auditing approach, Paragraph 11 a) of international Standard on Auditing 240 interprets fraud as follows: ‘An intentional act by one or more individuals among management, those charged with governance, employees, or third parties, involving the use of deception to obtain an unjust or illegal advantage.’
Although the line between creative accounting and fraud is rather thin, based on the definitions found in international accounting literature and in the Criminal Code, as well as on the definition of fraud in the international accounting standard, we believe that creative accounting and its application is
not a conduct to be condemned or punished, as long as a reliable and true picture can be obtained about businesses when examining the reports disclosed by them.
examining the positive and negative meanings of creative accounting, we are going to look at the means and techniques that can be taken into consideration at the manipulation of the figures in accounting reports.
creAtive Accounting techniqueS
The manipulation of the balance sheet and the profit and loss statement requires certain bookkeeping solutions that facilitate the desired modifications. From the creative account- ing techniques identified most frequently in literature, we can highlight the following ones, which are examined by Bedőházi (2009), too.
Advance booking of sales: it may be interesting in the case of economic events that are close to the balance sheet date. The question is in which period the given economic event is booked. We apply advance booking for items that will occur in the following business year, increase the earnings of this business year, and will be actually performed in the next business year.
Cookie Jar Reserves: The name of this technique refers to the fact that the company creates reserves, only from the profits of better years, so that they can be used in worse times to improve profits.
Big Bath Accounting: it is used on the appointment of a new management or in the event of major reorganisations. The earnings of the given business year are sacrificed so that the balance sheet can be cleaned, and as much expenses as possible can be written off, utilising asset valuation methods or the depreciation of intangible assets and tangible assets. With this technique, better results can be achieved in subsequent periods.
evaluation of stocks: during the evaluation of stocks, the company may choose between the FiFO and the weighted average price methods.
Selection of depreciation method:
The company is able to manipulate data for tangible assets, too, from the aspect of selecting a depreciation method. The amortised value of assets has to be distributed for the useful lifecycle. The depreciation method can be straight-line (the same rate of depreciation is accounted every year), declining balance (following the higher rate of depreciation accounted in the first year, the value of the asset is decreased to a smaller extent, so expenses keep going down, while profit increases every year) and activity based.
Barter: two companies sell the same assets to each other, which generates increased sales at both companies. However, this transaction will not modify the earnings, as the amounts of sales and expenses are identical.
As we can see, the manipulation of accounting reports is feasible in a number of ways, but it raises the following question: how transparent can a company be when it uses such tools and techniques?
CorPorATE TrAnSPArEnCy
The transparency and the transparent operation of companies are supported by the transparency directive issued in 2004 and revised in 2013 (2013/50/eu transparency directive, td), which intends to ensure the transparency of information for investors through the disclosure of periodical and on- going regulated information, and the regular public distribution of such data. The issuers of securities introduced on the regulated mar- ket are expected to regularly produce three types of reports: the annual report, the semi- annual report and the periodical report. in the
annual report, it is necessary to disclose the audited accounting report, which is compiled according to decree 2002/1616/eC and the international Financial Reporting Standards (iFRS), the directors’ report and the issuer’s declaration of liability. The periodical report should present the key changes in the financial situation of the company compared to the previous half year, at least 10 weeks before the start of the half year and at the latest 6 weeks before its end. in addition, the information should comply with the directive on market fraud (2003/6/eC), too.
ExAMinATion of CrEATivE ACCounTinG And CorPorATE TrAnSPArEnCy
Since the turn of the century, the profession has paid more attention to accounting activities.
At the start of the 21st century, a company crisis triggered by the distorted presentation of corporate performance caused the downfall of a number of American companies. Following the enron scandal in 2001, creative account- ing received more attention, similarly to the transparency of corporate governance.
Corporate governance is responsible for the operation of the company, the management, the transparency of operation, the production and the contents of accounting reports.
Consequently, it is worth examining the relation between corporate transparency and the use of creative accounting methods.
Several authors in literature have examined, through the models they used, the quality of accounting information and the creativity of accounting in different ways, such as Healy (1985), DeAngelo (1986), Jones (1991), Dechow et al. (1995). Mudel (2016) extended the examination of accounting creativity with corporate transparency. Our study will discuss this model in detail.
Mudel’s (2016) model
in her examination, Mudel used the transparency and disclosure index (tdi) method, which places the emphasis on the relation between corporate governance and manipulations, with the quantitative measuring of two factors, corporate transparency and corporate disclosures.
The study goes back to the study of Black et al. (2003), where 123 factors were used in a questionnaire research, from which 38 proved to be relevant. They were grouped into five categories: shareholders’ rights, the board, the external (independent) directors, the supervisory board and the disclosures to investors. The considerations of Black et al.
(2003) were used and reworked by Bebczuk (2005). He tried to use the tdi to measure the transparency of company information and the protection of external investors, and through that, the balance of power between people outside and inside the company. He examined 32 factors put into three groups:
board of directors, disclosure and shareholders’
information. Bebczuk’s research was improved by Mudel, who extended the scope of account- ing indicators, and intended to measure the relation between corporate governance and creative accounting.
ThE ModELLinG
The reason why we selected the transparency and disclosure index (tdi) model is that this method allows for the examination of the transparency of individual companies on the basis of objective considerations. The advantages of the method present themselves in its complexity, too, as it considers not only quantitative figures disclosed by companies and based on accounting reports, but also qualitative company documents and
information that are disclosed by companies and are publicly available, and they may also indicate the violation of corporate transparency and the potential accounting abuses originating from that.
The model selected by us consists of three steps. The first step is the definition of the tdi. The purpose is to measure corporate governance in a quantitative way, which is realised through the transparency and disclosures of the company. in the course of creating the factors, we examined 30 factors for each company, using their available public data and reviewing websites and other company documents and reports found on these websites. The individual factors were evaluated in a binary way – 0–1 –, where 0 means information not applicable to the given company or not available, while 1 means partially or fully available information.
The factors were grouped into three categories: the board of directors (in the modelling: TDI-Board), the disclosure (TDI- Disclosure), and owners and shareholders (TDI-Shareholders), these are the sub-indexes of tdi. under the category of Board of directors, we examined factors related to the structure, procedures and remuneration of the management. Within this sub-category, 11 factors were examined. They include the examination of directors’ independence criteria, which means whether the publicly available documents of the company include any internal regulations or policies that describe when the member of the board qualifies as independent, and what the excluding cases are. When indicating the present directors’ terms of office, we checked whether the public information disclosed by the company included how long the members of the Board have been in office. in addition, we were looking for and checked the existence of information such as directors’ Code of Conduct, information on the remuneration
of managers and directors, the forms of payments to managers and directors, data reflecting on their performance-related pay, and the number of shares owned by them.
Furthermore, we examined the composition of the Board of directors, too, how many independent and non-independent directors are included. Another aspect of examining the public information was whether they cover the nomination process of new directors, the composition of various board committees, and the details of the activities of such committees.
in the examination of disclosures, 14 considerations were used. Our focus was first on the biography of key officials, to see whether the information disclosed by the company contained the biographies of key officials – presidents, vice presidents, members of the supervisory board and the audit committee – and the biographies of the directors of the company. We also examined the availability of the calendars of future events on the website of companies, which may be interesting mainly through investors’ eyes, as this is one way of learning about the dates and details of annual general meetings and other events related to the disclosures of the company. We investigated several other factors as well: the availability of the company’s website and key documents in english, the presentation of the financial indicators of the last five closed business years separately from the accounting reports, the strategic plans of the company, the projection of plans for the next five years, provisions about reporting irregularities, the publication of the decisions of the general meeting, the details of the appointments of new directors, the independent auditor’s report, the Corporate Social Responsibility (CSR) report, the application of iFRS, credit valuation information.
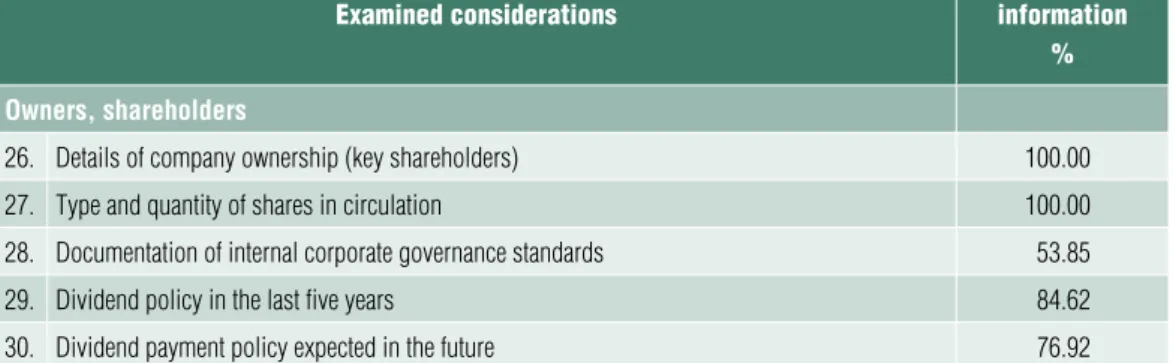
The third sub-category was defined on the basis of data related to owners and shareholders and the payment of dividends, according to
the following five factors: the details about the ownership of the company – the key shareholders, the type and quantity of shares in circulation, the documentation of internal corporate governance standards, the dividend payment policy of the last five closed business years, the dividend payment policy expected in the future.
As the second step of the method, we measure creative accounting through the performance of the company. As we can see it in the literature, accounting techniques are used to present a better company performance and to involve shareholders. Since creative bookkeeping cannot be measured directly, we use performance indicators to measure it, and we examine the key accounting indicators of the last five closed business years (2015–
2019) of the companies, through annual reports. We used six indicators, these are the following: Return on Assets (ROA), Return on equity (ROe), Return on Capital employed (ROCe), debt-to-equity (d/e), and Price- to-earnings (P/e), which shows the market value of a share compared to the earnings on one share. in addition, we took tobin’s Q indicator into consideration, which compares the market value of the company with the internal value of it, so we calculated with the following formula:
Q = share price × shares in circulation / total assets
The indicators taken into consideration affect the changes in assets and liabilities, profitability and the emergence of market effects, so they may be able to indicate potential creative factors. it is important to note that under share prices, we used the price valid on the last day of the business year.
Following the collection of the necessary data, we examined – with an SPSS statistical software – the nature of individual data
and the relations between the individual factors, through descriptive statistics and the correlation matrix received by running the model.
For the presentation of the relation between creative accounting and corporate governance, we complied a sample containing 13 car manufacturers listed on the stock exchange.
These 13 companies are: Suzuki, Subaru, Ford, General Motors, Volkswagen, toyota, Renault, Nissan, Mitsubishi, Honda, BMW, daimler and Kia.
rESuLTS of ThE rESEArCh
As a result of the data collection, it was possible to quantify the rate of the availability of the examined data at the companies that formed the basis of the research. Considering the fact that these pieces of information are updated by the companies in case of changes, without showing the status before the change, the availability of data is limited to the time of the audit, i.e. to the business year of 2019. At that time, the necessary information was found at all companies, as shown in table 1.
Following the collection of the examined data, the modelling was run with an SPSS statistical software, the result of which can be seen in Table 2, descriptive statistics.
ROCe – Return on Capital employed – examines the return of the invested capital. it shows whether the company is able to produce any profit from all the capital employed. High ROCe proves the efficient use of the capital, and it should always be higher than the cost of capital. We can see that the average ROCe is 7.57 percent, and its spread is 5.66, which is not very different among the companies, however, it means the efficient use of the capital employed.
The spread of the values of ROA – Return on Assets – is low in the range. The average
ROA is 3.23 percent, owing to the fact that companies have to have large asset portfolios for the production of passenger cars in proper quality. On the other hand, the low value of the ROA originated from the fact that some of the companies closed the business year with losses in the examined period, and this led to a fall in the average ROA.
The d/e ratio shows the indebtedness and the leverage of companies. if it is high, companies use a lot of foreign funds for their financing, which may increase profit, but profit may be reduced by the interests paid, and if too much foreign funds are used by a company, the danger of bankruptcy increases.
The average leverage of the companies is 3.95, which is high, because it means that approximately four-fifths of the funds available to them are from external sources, and these funds are typically used to finance the assets.
As the companies have high amounts of debts, the earlier discussed ROCe is useful for them.
The P/e ratio expresses the relation between the share price and the earnings of the company on one share. The P/e indicator shows us how many years are required for the company to produce a quantity corresponding to its price. in the case of companies in the automobile industry, this is 14 years. The average P/e ratio of the companies in the examined period is 13.99, the spread is 98.06, showing a skewness of 7.83, which is bigger than any other factor. Based on the 18.99 P/e indicator of Siblis Research calculated for 2019 and including altogether 3000 listed companies of 49 countries, we may draw the conclusion that investments return faster for investors in the automobile industry.
The Q rate created by tobin shows whether the given company is under- or overrated. in order to determine that, we have to consider the market value and the book value of the company. The minimum tobin Q value is 0.021, the maximum tobin Q is 45.87 and
Table 1 occurrence of examination considerations among
the selected comPanies examined considerations
availability of information
% Board of Directors
1. Az igazgatók függetlenségi kritériumai, leírás a független és nem független tagok megválasztására
100.00
2. A jelenlegi igazgatók hivatali évei, mióta/hány éve töltik be az adott pozíciót 100.00
3. igazgatók magatartási kódexe (Code of Conduct) 92.31
4. Menedzseri és igazgatói díjak 92.31
5. A menedzserek és igazgatók fizetési formája (pénz, részvény, részvényopció) 69.23
6. Teljesítménybér 46.15
7. Menedzseri és igazgatói részvények 100.00
8. A független igazgatók száma és/vagy aránya az igazgatótanácsban 100.00
9. Az új igazgatók jelölési eljárásának részletei 61.54
10. A különböző igazgatói bizottságok összetétele 76.92
11. A különböző igazgatói bizottságok tevékenységének részletei 69.23
Disclosure
12. Biographies of key officials (presidents, vice presidents, members of the Board of directors and the Audit Committee)
100.00
13. directors’ biographies 100.00
14. Calendar of future events regarding annual general meetings, quarterly reports, other company events of public interest
100.00
15. English version of the website of the company 100.00
16. English versions of the key documents of the company 100.00
17. financial indicators of the last five years 61.54
18. Strategic plans and their projections for the following years 100.00
19. Policy and rules of reporting irregularities 61.54
20. Publication of general meeting resolutions 84.62
21. details of directors’ nomination procedures 46.15
22. independent auditor’s report 100.00
23. Social responsibility report of the company 100.00
24. Application of ifrS standards 100.00
25. Credit valuation information 92.31
the mean tobin Q is 12.72, which results in overrated goodwill. The examined companies include businesses that are underrated on the basis of the tobin Q, consequently, they may be attractive to investors who wish to acquire them.
using descriptive statistics, we examined the industrial features and performance of the automobile industry companies. in order to examine the relation between the performance and the transparency of companies, we will need a correlation matrix that is presented in Table 3.
examined considerations
availability of information
% Owners, shareholders
26. details of company ownership (key shareholders) 100.00
27. Type and quantity of shares in circulation 100.00
28. documentation of internal corporate governance standards 53.85
29. dividend policy in the last five years 84.62
30. dividend payment policy expected in the future 76.92
Source: own editing, based on own collection
Table 2 descriPtive statistics
N statistic
minimum statistic
maximum statistic
mean statistic
stc.
deviation statistic
skewness kurtosis
statistic std.
error statistic std.
error
roce 65 –6.310 34.61 7.571 5.6594 2.114 0.297 8.466 0.586
roA 65 –3.950 16.84 3.228 2.8010 1.652 0.297 8.475 0.586
debt/Equity 65 0.852 21.04 3.951 4.8552 2.736 0.297 6.677 0.586
P/E ratio 65 –82.550 785.36 13.999 98.0616 7.826 0.297 62.573 0.586
tobin q 65 0.0210 45.87 12.715 13.1681 0.507 0.297 –1.039 0.586
valid n
(listwise) 65
List of Abbreviations
roce: return on Capital Employed roA: return on Assets d/E: debt-to-Equity ratio P/E: Price to Earnings
Tobin Q: Market value of company/internal valu of company Source: own editing with SPSS
The correlation coefficient (r) may have values from –1 to +1, where ±1 is the strongest possible match, and 0 is the biggest possible difference. As the number of elements grow in the sample, it is getting closer to the theoretical correlation coefficient in a more and more reliable way. even if there is a close correlation, we should not always assume a true relation, as it may happen that the change in both x and y clearly follows from a modified value of a third variable, w. in order to accept the correlation value, we need to examine the significance level, too, by using a t-test with N–2 degree of freedom.
in our examination, we are looking for a relation between the application of creative accounting techniques and corporate governance. Our starting hypothesis is H0 : ρ=0, which means that there is no relation between the two examined factors, i.e. creative accounting and corporate governance cannot be linked to each other. if the absolute value of t is higher than the critical value belonging to the given significance level and degree of freedom, we discard the zero hypothesis, therefore accept the existence of the correlation and the r value, and, at the same time, we accept the relation between the two examined factors, too, based on the correlation.
The correlation matrix received shows that a significant relation can be observed between the ROCe and the ROA, which is a relation of medium strength. The explanation is that both indicators are influenced by the value of all assets and the earnings in the actual year. it is also evident on the matrix that a significant and positive relation can be observed between the ROe and the ROA. in our case, this means that both indicators are influenced by profit after taxation. Between the ROA and the d/e, and between the ROCe and the d/e, based on the test completed, there is a medium strong negative relation, the reason for which is that when profit after taxation increases, it triggers
an increase in the equity of the company therefore, thus leverage decreases.
Among the ROe, the ROA, the ROCe and the tdi shareholders, a medium strong relation can be observed, which leads us to believe that if profit after taxation improves, the available dividends increase, which impacts the tdi shareholders positively, too. The value of the correlation between the tdi and the tdi board of directors is 0.803, which means a significant and strong link. The value of the correlation between the tdi and the tdi disclosure is 0.485, which means a significant link of medium strength. The debt equity Ratio, i.e. the ratio of external and own capital, influences the value received for the board of directors and the disclosure, in opposite direction. if the debt equity Ratio increases, the value created for both the board of directors and the disclosure deteriorates, while conversely, if the ratio of own capital and external capital decreases, the value created for the board of directors and the disclosure improves. The board of directors and the disclosed information have an impact on the implementation of manipulations, therefore we can say that if corporate data are manipulated, the operation of the company is less transparent. in the course of the modelling, it was proved that there is a medium strong negative relation between corporate governance and creative accounting, and it has to be pointed out, of course, that it is difficult to measure it. The results received may be explained by the fact that the relation between corporate governance and creative accounting is realised because of a conflict between ownership and control, in other words, principal and agent. The impact of managers’
right to consideration in the use of accounting methods cannot be considered manipulative as long as the right to consideration is not used with the intention of manipulating the disclosed reports. This is related to the fact
Table 3 the correlation coefficients of the model
roa roe roce d/e P/e-
mutató tobinQ tdi tdi Board
tdi disclo-
sure tdi share- holder roA Pearson Correlation 1 0.765** 0.892** –0.428** –0.120 –0.037 0.020 –0.088 –0.136 0.426**
Sig. (2-tailed) 0.000 0.000 0.000 0.340 0.768 0.872 0.486 0.281 0.000
n 65 65 65 65 65 65 65 65 65 65
roe Pearson Correlation 0.765** 1 0.591** –0.206 –0.127 0.153 –0.005 –0.059 –0.116 0.275*
Sig. (2-tailed) 0.000 0.000 0.099 0.312 0.223 0.971 0.640 0.359 0.027
n 65 65 65 65 65 65 65 65 65 65
roce Pearson Correlation 0.892** 0.591** 1 –0.302* –0.159 –0.124 0.048 0.032 –0.269* 0.431**
Sig. (2-tailed) 0.000 0.000 0.014 0.207 0.323 0.707 0.798 0.030 0.000
n 65 65 65 65 65 65 65 65 65 65
d/E Pearson Correlation –0.428** –0.206 –0.302* 1 0.071 –0.165 0.033 –0.417** –0.465** –0.137
Sig. (2-tailed) 0.000 0.099 0.014 0.573 0.188 0.795 0.001 0.000 0.276
n 65 65 65 65 65 65 65 65 65 65
P/E- ratio
Pearson Correlation –0.120 –0.127 –0.159 0.071 1 0.050 –0.080 –0.043 –0.076 –0.006
Sig. (2-tailed) 0.340 0.312 0.207 0.573 0.691 0.527 0.733 0.549 0.959
n 65 65 65 65 65 65 65 65 65 65
tobin q Pearson Correlation –0.037 0.153 –0.124 –0.165 0.050 1 –0.536** –0.520** –0.092 –0.146
Sig. (2-tailed) 0.768 0.223 0.323 0.188 0.691 0.000 0.000 0.465 0.245
n 65 65 65 65 65 65 65 65 65 65
tDi Pearson Correlation 0.020 –0.005 0.048 0.033 –0.080 –0.536** 1 0.803** 0.485** 0.181
Sig. (2-tailed) 0.872 0.971 0.707 0.795 0.527 0.000 0.000 0.000 0.150
n 65 65 65 65 65 65 65 65 65 65
tDi Board
Pearson Correlation –0.088 –0.059 0.032 –0.417** –0.043 –0.520** 0.803** 1 0.032 –0.097
Sig. (2-tailed) 0.486 0.640 0.798 0.001 0.733 0.000 0.000 0.799 0.443
n 65 65 65 65 65 65 65 65 65 65
tDi disclo- sure
Pearson Correlation –0.136 –0.116 –0.269* –0.465** –0.076 –0.092 0.485** 0.032 1 –0.241
Sig. (2-tailed) 0.281 0.359 0.030 0.000 0.549 0.465 0.000 0.799 0.054
n 65 65 65 65 65 65 65 65 65 65
tDi Share- holder
Pearson Correlation 0.426** 0.275* 0.431** –0.137 –0.006 –0.146 0.181 –0.097 –0.241 1 Sig. (2-tailed) 0.000 0.027 0.000 0.276 0.959 0.245 0.150 0.443 0.054
n 65 65 65 65 65 65 65 65 65 65
Note:**. Correlation is significant at the 0.01 level (2-tailed) *. Correlation is significant at the 0.05 level (2-tailed) Source: own editing with SPSS
that managers focus on short-term personal incentives, instead of focusing on the long- term economic success of the company. All this emerges when ownership and corporate governance are separated from each other; the conflict generated in this case is described by the agent theory. Conflicts are related to the distribution of economic resources and the lack of trust. Literature considers the conflicts between investors and managers the root of creative accounting (Mudel, 2016). All in all, it is fair to say that if the management of the company applies creative accounting techniques, the transparency of the company decreases, and the operation of the company becomes less transparent.
concluSionS
The link between corporate governance and creative accounting is generated by ownership and control, and asymmetric information.
Creative accounting is the process of manipulating the accounting data, utilising
the legal gaps in the accounting law / account- ing standards within the limits of the law. in our study, we examined the relation between creative accounting and corporate governance by using the tdi method. Creative ac- counting was measured with ROA, ROCe, ROe, d/e, P/e and tobin Q performance indicators. We conducted the analysis with the help of an SPSS statistical software, which assisted us in examining the relations among individual factors through a correlation matrix. in the correlation, we found a significant negative relation between the ROA and the company’s leverage, and the ROCe and the company’s leverage. The board of directors, the disclosure, the proper ownership and shareholder structure play important roles in the appearance of creative account- ing techniques in the company records. it is necessary to minimise the applied creative ac- counting techniques in order to make sure that companies are more transparent and show a more ethical behaviour. interactions would be necessary on the part of lawmakers as well, to close the loopholes. ■
References Amat, O., Gowthorpe, C. (2004). Creative Accounting: Nature, incidence and ethical issues.
UPF Working Paper, No. 749, https://doi.org/ 10.2139/ssrn.563364
Bebczuk, R. N. (2005). Corporate Governance and Ownership: Measurement and impact on Corporate Performance and dividend Policies in Argentina. IDB Working Paper, No. 211
Bedőházi Z.-R. (2009). A Nemzetközi Pénzügyi Beszámolási Standarok alkalmazásának hatása a Magyar tőzsdén jegyzett vállalatok számviteli minőségére. (The impact of the application of the
international Financial Reporting Standards on the accounting quality of companies listed on the Hungarian Stock exchange) Phd paper, Pécs
Black et al. (2003). does Corporate Governance Affect Firms’ Market Values? evidence for Korea.
Stanford Law School Working Paper, No. 237, https://doi.org/10.1093/jleo/ewj018
Budai e. (2006). Számviteli adatokra ható tényezők elemzése a változások összefoglalása. (Analysis of factors impacting the accounting data, summary of changes) Controlling trendek (Controlling trends):
A sikeres vállalatirányítás gyakorlata. (The practice
of successful corporate governance) Raabe Kiadó (Raabe Publishing House), pp. 1–26.
Chong, G. (2006). is income Smoothing ethical? The Journal of Corporate Accounting &
Finance. Volume 18. issue 1, pp. 41–44, https://doi.org/ 10.1002/jcaf.20261
deAngelo, L. e. (1986). Accounting Numbers as Market Valuation Substitutes: A Study of Management Buyouts of Public Stockholders. Accounting Review, Volumen 61, Number 3, pp. 400–420
dechow, P. M., Sloan, R. G., Sweeney, A. P. (1995). detecting earnings management.
Accounting Review, Volumen 70, Number 2, pp.
193–225
Healy, P. M. (1985). The effect of bonus schemes on accounting decisions. Journal of Accounting and Economics, Volume 7, issue 1–3, pp. 85–107, https://doi.org/ 10.1016/0165-4101(85)90029-1
Healy, M., Wahlen, M. (1999). A Review of the earnings Management Literature and its implications for Standard Setting. Accounting Horizons, Volume 13, issue 4, pp. 365–383, https://doi.org/ 10.2308/acch.1999.13.4.365
Hill, C. W. L., Jones, G. R. (2008). Strategic Management Theory: An Integrated Approach, 8th ed.
Boston, NY: Houghton Mifflin
Jones, J. (1991). earnings Management during import Relief investigations. Journal of Accounting Research, Volume 29, Number 2, pp. 193–228, https://doi.org/ 10.2307/2491047
Jones, M. J. (2011.) Creative Accounting, Fraud and International Accounting Scandals. Chichester:
John Wiley & Sons
Kaminski, R. (2014). Creative Accounting does not Need to equal Falsification of Accounts.
Economics Word, Volume 2, Number 4, pp. 272–
280
Karim, A. M., Fowzia, R., Rashid, M.
M (2011). Cosmetic Accounting Practices in developing Countries: Bangladesh Perspectives.
World Journal of Social Sciences, Volume 1. Number 3, pp. 1–15
Lomax, S. (2003). Cooking the book. Business and Economic Review, pp. 3–8
Lukács, J. (2007). Kreatív számvitel, vétlen hiba, szándékos csalás. (Creative accounting, innocent error, intentional fraud) Társadalom és Gazdaság.
(Society and Economy) issue 29 (1) pp. 133–142, https://doi.org/ 10.1556/társGazd.29.2007.1.7
Mudel, S. (2016). A Study to Show the Relation between Creative Accounting and Corporate Governance. Manuscript,
https//doi.org/ 10.2139/ssrn.2710567
Mulford, C. W., Comiskey, e. e. (2002).
The Financial Numbers Game: Detecting Creative Accounting Practices. uSA: John Wiley & Sons
Naser, K. H. (1993). Creative Financial Accounting: its Nature and use. Hemel Hempstead:
Prentice Hall
Schipper, K. (1989). Commentary on earnings Management. Accounting Horizons, 3(4), pp. 91–
102
Shah, A. S. Z., Butt, S., tariq Y. B. (2011).
use or Abuse of Creative Accounting techniques.
International Journal of Trad, Economics and Finance, 2(6), pp. 531–536,
https://doi.org/ 10.7763/iJteF.2011.V2.161 Simon J., Fejszák t., B. Schatz, t. donchev, M. ivanov (2018). Az eredményszemléletű számvitelre áttérés tapasztalatai számvevőszéki
aspektusból. (experiences of transition to accrual- based accounting from audit office aspect) Pénzügyi Szemle. (Public Finance Quarterly) issue 63(2), pp.
145–160.
Stolowy, H., Breton, G. (2004). Accounts Manipulations: A Literature Review and Proposed Conceptual Framework. Review of Accounting and Finance, Volume. 3. issue 1, pp. 5–92,
https://doi.org/ 10.1108/eb043395
Sztanó i. (2019). A számvitel alapjai. (Basics of accounting) Fourth, revised edition Perfekt Kiadó (Perfekt Publishing House), Budapest
teoh, S. H., ivo, W., tak, J. W. (1998).
earnings Management and the Long-Run Market Performance of initial Public Offerings. Journal of Finance, Volume. 53. issue 6, pp. 1935–1974, https://doi.org/ 10.1111/0022-1082.00079
tóth B. (2020). A 2014-es államszámviteli reform az önkormányzati tapasztalatok tükrében.
(State accounting reform in 2014 in the light of local government experiences) Pénzügyi Szemle. (Public Finance Quarterly) issue 65(3) pp. 244–260, https://doi.org/ 10.35551/psz_2020_2_6
ACCA (no date). Massaging the Figures.
Online: https://www.accaglobal.com/my/en/
student/exam-support-resources/professional-exams- study-resources/p7/technical-articles/massaging-the- figures.html
european union (2020). Commission Communication, 2020/C 379/01. Online: https://
eur-lex.europa.eu/legal-content/Hu/tXt/HtM L/?uri=CeLeX:52020XC1110(01)&from=eN#n tr5-C_2020379Hu.01000101-e0005
Siblis Research Ltd. (2019). Global Stock Market P/e Ratio. Online: https://siblisresearch.
com/data/global-markets-pe/
international Standard on Accounting 240 Online: https://mkvk.hu/bundles/csmssite/mkvk/
uploads/userfiles/files/hu/letolthetoanyagok/
dokumentumok/standardok_2016/iSA_240.pdf Act C of 2000 on Accounting Online: https://
net.jogtar.hu/ jogszabaly?docid= a0000100.tv Act C of 2012 on the Criminal Code Online:
https://net.jogtar.hu/jogszabaly?docid= a1200100.
tv