How Effective are School Years?
Examining the Link Between Human Capital and Economic Growth in European Countries, 2014–2019
Ilona Ida Balog
University of Szeged,
Károli Gáspár University of the Reformed Church, ilonaida.balog@gmail.com
Summary
This paper wishes to contribute to the examination of the relationship between human capital and economic growth. Human capital is measured by the average number of finished schooling years and its effect on economic growth is estimated on novel data in European countries. Data from the period between 2014 and 2019 show a negative coefficient for schooling years. In eastern countries in the analysis economic growth is generally higher than in Western-European countries. Economic growth in Hungary is higher than the estimated value explained by the analysed variables. The negative coefficient means that human capital measured by the number of schooling years does not accelerate economic growth any more, and further reforms of the education systems are needed in order to use human capital more efficiently.
Keywords: human capital, economic growth, education efficiency JEL-codes: E24, N10, N30, O11, O15, O47
DOI: https://doi.org/10.35551/PFQ_2021_4_1
H
Human capital is one of the most important and nowadays much debated factors of production in macroeconomies. Perhaps it is precisely this complexity that makes it very difficult to draw clear and demonstrable conclusions on how it can be better managed to achieve better and more efficient results. It is also made more difficult by the fact that the scope of what can be understood as human capital is not well defined, its functions go far beyond economic issues, and its ownership and operational mechanisms are not sufficiently clear either (Boda, Juhász, Stocker, 2009).For these reasons, studying the impact of human capital seems to be an eternal challenge for economics. While at the end of the 20th and beginning of the 21st century macroeconomic approaches attempted to approximate its value with one comprehensive measure or estimate, today researchers are increasingly interested in the impact of the narrower concepts that make up the components of human capital.
However, on the basis of theoretical definitions and purely logical inferences, it has always seemed clear that human capital has a positive impact on economic performance and growth.
The recent tendency to examine sub-areas could be explained by the fact that aggregate approaches to human capital generally do not yield statistically meaningful and significant results any more (Mastromarco, Simar, 2021).
Nevertheless, partly out of curiosity and partly in keeping with the research tradition, in this paper I attempt to revive an old macroeconomic model, a modified version of which may shed light on the extent and the direction the economies of European countries have changed in recent decades in terms of the impact and use of human capital. It can also help to provide a picture of the most urgent steps to be taken to improve human capital management.
In the first part of this paper, I will define the concept of human capital and briefly present
the debates on the subject. In the second part, I will estimate an older model using more recent data, compare and evaluate the results, and outline possible explanations and conclusions. In a separate section I will discuss the specificities of Hungary and the eastern part of Europe. The paper will conclude with an overall summary.
The concepT of human capiTal and inTerpreTaTions in liTeraTure
People are a key element to the functioning of the economy and they can be considered the most important active agent in these systems.
Their function is multifaceted: they are both the purpose and the resource of economic activity. As a resource, people utilize their productive capacity through their work, but their welfare in itself is the most important goal of economic activity (Balog, 2018). It is difficult, however, to determine when human characteristics can be considered target factors and when they become resources, because both aspects are often present in the same activity.
An example of this might be when people enjoy their work and see it as part of their personal well-being, i.e. would even pay to do it. At the same time, they are creating value, and therefore they are being paid for their work rightfully. In this case, the economic analysis confuses the sense of well-being as a target and the work that creates well-being, as the means, which makes it difficult to draw useful conclusions.
In economics, the terms resource and capital are often used synonymously.
However, while human resources generally do not require more than the familiar textbook definitions, the situation is different for human capital, because the term ‘human’
can often be interpreted in opposition to
the term ‘capital’. A definition is therefore very necessary, yet it is rare to find a precise definition of ‘human capital’ in literature. The OECD definition, cited by Liu and Fraumeni (2020), is perhaps the most accepted, which, with some simplification, defines human capital as the productive, i.e. useful, work capacity of people. This definition emphasises that it is concerned with the characteristics of people that help them perform their function as a resource as effectively as possible, and thus links the concept of capital to the resource in this context.
The definition of human capital as people’s work capacity is satisfactory as an initial definition, but may lead to different interpretations in quantitative analyses. Even in the case of clearly distinguishable activities, there is no consensus in the literature on what is included in the concept of human capital and human resources, and what is not (Savvides, Stengos, 2009). However, a narrower or broader definition of what is included in human capital may lead to different results in terms of the extent to which the value-adding effects of capital can be identified and which parts of it need to be developed or transformed.
The broadest definition of human capital includes everything that can be related to labour resources rather than being part of produced capital in the classical sense.1 In this sense, in addition to labour resources, conditions that ensure maximum working capacity are also part of human capital. Thus, human capital embodies the sense of well-being provided by all the consumption expenditures that lead to more productive work.
In the broader sense, there are many factors that serve to enhance one’s higher level of well-being rather than one’s increased ability to work. Thus, the broadly understood human capital confuses the ends and means of economic activities (Balog, 2018), i.e. the clarity of the theoretical definition obtained
by applying the resource and capital concepts, as well as the target concept, is lost, which may lead to erroneous conclusions where the actual target factor is taken as a cost factor. Many argue that if the function of the economy is to serve people rather than to use them, then no element of the human factor should be considered as capital. These latter considerations already led to resistance to this concept at the very beginning of human capital research (Savvides, Stengos, 2009).
This makes the broadest understanding of human capital seem inappropriate for the purposes of economic models that examine the determinants of economic performance and value creation.
In a narrow sense, the content of human capital is limited to work capacity and only those processes that have a long-term impact on it are considered to be part of human capital.
Long-term usability is the characteristic that distinguishes capital from consumption, and the processes that increase the capacity to work tend to have a long-term effect. The theory of human capital, which has taken wing through the work of Schultz and Becker, focuses attention on precisely these characteristics of human resources (Becker, 1962)2 and relates its accumulation to the processes described in connection with produced capital.
According to the human capital theory, when labour resources are used, the human capital accumulated in earlier years is utilised to produce goods and services. Taking this into account, the learning period is a period of accumulation of human capital comparable to the investment period. Once the desired skills have been acquired, the individual’s main activity is to engage in gainful work using these skills. This period is also well aligned with the useful life period of the capital produced.3
In the interpretation of the human capital theory, learning is typically seen as the most important process that increases human
capital because knowledge acquired through learning can be stored and used in the future, unlike the welfare or well-being that is generated by consumption (Boda, Juhász, Stocker, 2009). A narrower understanding of human capital thus considers learning as a human capital accumulating activity, while accumulated human capital refers to the knowledge of people doing the work. In this study, I therefore focus on human capital in the narrow sense.
A major problem, however, is that there is a high degree of uncertainty about the outcome and return on accumulated human capital, because this makes it difficult to measure the accumulated value (T. Kiss, 2012). The extent of the impact on economic growth is not independent of the method of measuring the accumulated value of human capital.
However, there are serious drawbacks to each method of measurement, which makes the choice difficult.
Although there are many features of human capital that are relatively easy to measure, those elements that are difficult or impossible to quantify can be decisive. The number of certificates awarded is quite measurable, but the effort put into obtaining a certificate is not. Of course, economic calculations try to take account of the measurable elements, but it should be noted that they are limited in the extent to which they can be used to draw conclusions.
The more easily measurable elements can be described in quantitative terms (persons, pieces or time). However, a major drawback of such measurement is the quantitative approach, which cannot take qualitative elements into account (Lee, Mason, 2010). Nevertheless, the use of quantitative measures is common in the case of human capital because, even if they are not able to capture the concept more precisely, they at least reliably measure the part of it that they can express (Balog, 2018).
There are also some possibilities for measuring the qualitative elements of human capital. However, measuring learning outcomes through grades or examination scores is rare because it does not provide broadly comparable data (Hanushek, Kimko, 2000). In contrast, measuring in monetary terms provides a good basis for comparison, but it is doubtful whether it can adequately measure quality. Several types of monetary value measurement are known, which are cost-based, income-based (T. Kiss, 2012) or replacement value based (Judson, 2002). Cost- based valuation is easier to find data for but has more serious biases than some other valuation methods. For income-based valuation, widely calculated statistics are not yet available.
Several research groups around the world are working on the further development of these measures (Liu, Fraumeni, 2020). Although income-based monetary measurement has gained prominence in recent decades, it is subject to valuation biases that do not allow the use of these metrics in regressions (Lange, Wodon, Carey, 2018). For these reasons, this study will henceforth use the more commonly used quantitative measure, the average number of years of schooling completed, which has serious limitations in terms of measuring quality but does not contain an evaluation bias.
Although human capital did not appear explicitly as a variable in the Solow model, the ancestor of macroeconomic growth models, many subsequent models placed it in this framework, based on the first identified factors of production, namely produced capital, labour and technological progress (Prescott, 1988).
The more commonly held view is that human capital, as an additional factor of production, has an equally direct impact on economic growth, separate from, and independent of produced capital and labour (Mankiw, Romer, Weil, 1992). Accordingly, these models
count with the change in human capital as it is a flow type indicator. The endogenous growth theory, on the other hand, argues that the level of accumulated human capital determines the rate of technological progress, and thus affects economic growth indirectly through technological progress, and uses stock indicators of human capital in its calculations.
Some studies have examined the data from both approaches (Benhabib, Spiegel, 1994), but in general the endogenous growth theory is considered to be more forward-looking.
According to several studies, the mechanism of human capital’s impact on economic growth is non-linear (Savvides, Stengos, 2009). There is a threshold below which a linear regression can have a negative coefficient even if the correlation is positive in the long run. However, there is no guarantee that a subsequent threshold could be crossed, nor do we know when and by what methods this will be possible. Since this study is focused on the short term, I consider linear regression to be sufficient for some conclusions.
human capiTal and economic growTh – based on The
meThodology of an old model
The accumulation and use of human capital has been considered by economists as a determinant of the generation of economic growth since the creation of the first macroeconomic models. According to the endogenous technological development model, it is the level of human capital development that determines technological development, thus human capital can have an indirect and positive impact on economic growth (Savvides, Stengos, 2009). Using this concept, Benhabib and Spiegel, for example, have shown a positive correlation between accumulated human capital and
economic growth (Benhabib, Spiegel, 1994).
In one of their models based on a standard production function, they distinguished two different types of growth effects captured by two different human capital variables. The endogenous domestic development effect was approximated by the average number of years of schooling completed, while the human capital effect on catching-up was estimated with a composite variable, assuming that societies allocate human capital efforts to catching- up in proportion to the lag in economic performance behind the overall technological development leader. The equation used for their model is therefore as follows:
log (Yt / Y0 ) = c + (g–m)H + mH ymax / y0 +
α log (Kt / K0 ) + β log (Lt / L0 ) + log (εt / ε0 ) (1) where
Y: denotes economic performance as measured by GDP,
H: the stock value of human capital, y: GDP per capita,
K: stock value of the capital factor, L: number of active labour force,
c: constant representing exogenous development,
g: coefficient of endogenous technical progress,
and m is the catching-up development effect.
α and β are additional estimated parameters and ε is the error term. Lower indexes t and 0 denote the year of measurement, the max lower index is a theoretical maximum value (Benhabib, Spiegel, 1994, p. 161).
The test of Benhabib and Spiegel’s model with refined data on an alternative database was also conducted by Papageorgiou. This included data from 80 countries collected between 1960 and 1987. The results gave an even stronger positive correlation, especially for countries with higher GDP per capita (Papageorgiou, 2003).
In order to obtain information on the extent to which these correlations hold today, this paper examines whether Benhabib and Spiegel’s 1994 findings hold for more recent, but shorter-term, European data. The time span of the new study covers data from 2014 to 2019. In choosing the time span, I kept two considerations in mind. First, between 2014 and 2019, we can expect relatively uninterrupted growth in Europe, with no fluctuations in economic performance that would seriously distort the results. Second, at the time of writing my study, comparable data for 2020 were not yet available for all the countries under study, so using more recent data would have reduced the number of elements in the regression calculation. This study focuses on European countries, but the range of countries within Europe also differs somewhat from previous studies, because in this more recent period it was possible to include data from countries further east not included in Benhabib and Spiegel’s earlier study. Data for the more recent period were thus collected from the following 28 countries: Belgium, Bulgaria, Denmark, Germany, Estonia, Ireland, Greece, Spain, France, Italy, Latvia, Lithuania, Luxembourg, Hungary, Malta, the Netherlands, Austria, Poland, Portugal, Romania, Slovenia, Slovakia, Finland, Sweden, Iceland, Norway, Switzerland, Great Britain (Eurostat, 2021).
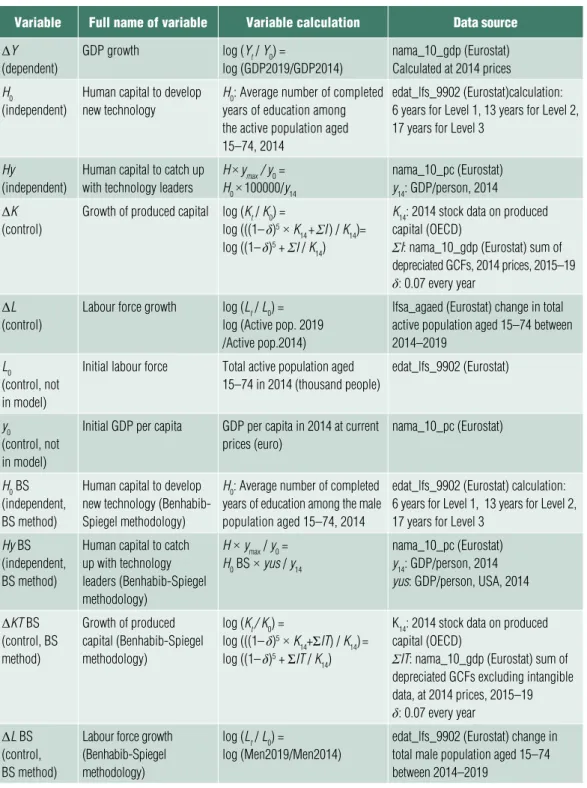
The model was also regressed in a modified form with additional control variables. The variables of the calculated regression equations are presented in Table 1.
Some equations calculated here include methodological changes compared to the equation given in the 1994 study. A notable difference is that the 1994 study calculated the average years of schooling completed for the total male population aged 15 and over, according to the data available at that time.
Although the rise in female educational
attainment between 1965 and 1985 did not contribute positively to economic growth at world level (Savvides, Stengos, 2009), a comprehensive analysis today cannot simply ignore this potential negative effect of the labour market inefficiencies, i.e. the relatively low utilisation of female labour, and therefore I have included data for both sexes in the equations analysed. For the more recent data, a breakdown of the total active population aged 15–74 by educational attainment was available, so this more accurate data set provided the basis for the accumulated human capital variable.
Another important methodological diffe- rence was that for the control variable ΔK, the produced capital data between 2014 and 2019 already included the value of intangible assets, the measurement of which was only introduced in European aggregate statistics from 2010 (Eurostat, 2014). These produced assets (including the capitalised value of R&D) could not yet be included in the 1994 study capital data.4 This methodological difference means that the study of more recent data also controlled the calculation for the production of certain intangible assets (R&D and software), unlike previous studies.
resulTs: impacT of human capiTal on economic growTh in european counTries, 2014–2019
The results of the regression run using the GRETL software with data collected from Eurostat’s database as described above are shown in Table 2.
The somewhat surprising result is that, when using the more recent data, the coefficient on human capital measured by average years of schooling completed is both negative and significant. The coefficient was not significant for the variable on the impact of human
Table 1 RegRession vaRiables
variable Full name of variable variable calculation Data source ΔY
(dependent)
gdp growth log (Yt / Y0) =
log (gdp2019/gdp2014)
nama_10_gdp (eurostat) calculated at 2014 prices H0
(independent)
human capital to develop new technology
H0: average number of completed years of education among the active population aged 15–74, 2014
edat_lfs_9902 (eurostat)calculation:
6 years for level 1, 13 years for level 2, 17 years for level 3
Hy (independent)
human capital to catch up with technology leaders
H × ymax / y0 =
H0× 100000/y14 nama_10_pc (eurostat) y14: gdp/person, 2014 ΔK
(control)
growth of produced capital log (Kt / K0) =
log (((1– δ)5 × K14 + ΣI ) / K14)=
log ((1– δ)5 + ΣI / K14)
K14: 2014 stock data on produced capital (oecd)
ΣI: nama_10_gdp (eurostat) sum of depreciated gcfs, 2014 prices, 2015–19 δ: 0.07 every year
ΔL (control)
labour force growth log (Lt / L0) = log (active pop. 2019 /active pop.2014)
lfsa_agaed (eurostat) change in total active population aged 15–74 between 2014–2019
L0
(control, not in model)
initial labour force Total active population aged 15–74 in 2014 (thousand people)
edat_lfs_9902 (eurostat)
y0
(control, not in model)
initial gdp per capita gdp per capita in 2014 at current prices (euro)
nama_10_pc (eurostat)
H0 bs (independent, bs method)
human capital to develop new technology (benhabib- spiegel methodology)
H0: average number of completed years of education among the male population aged 15–74, 2014
edat_lfs_9902 (eurostat) calculation:
6 years for level 1, 13 years for level 2, 17 years for level 3
Hy bs (independent, bs method)
human capital to catch up with technology leaders (benhabib-spiegel methodology)
H × ymax / y0 = H0 bs × yus / y14
nama_10_pc (eurostat) y14: gdp/person, 2014 yus: gdp/person, usa, 2014
ΔKT bs (control, bs method)
growth of produced capital (benhabib-spiegel methodology)
log (Kt / K0) =
log (((1– δ)5 × K14+ΣIT) / K14) = log ((1– δ)5 + ΣIT / K14)
K14: 2014 stock data on produced capital (oecd)
ΣIT: nama_10_gdp (eurostat) sum of depreciated gcfs excluding intangible data, at 2014 prices, 2015–19 δ: 0.07 every year
ΔL bs (control, bs method)
labour force growth (benhabib-spiegel methodology)
log (Lt / L0) =
log (men2019/men2014)
edat_lfs_9902 (eurostat) change in total male population aged 15–74 between 2014–2019
Source: self-edited (based on eurostat, 2021; lange-wodon-carey, 2018; benhabib-spiegel, 1994)
capital on catching-up and labour force change. Since there is no excessive correlation between the independent variables, these signs can be interpreted as valid. Comparing this result with the human capital coefficients of the previous studies referred to herein (Benhabib, Spiegel, 1994; Papageorgiou, 2003), it yielded the expected non-significant result for the catch-up effect, while the effect of accumulated human capital promoting independent technological development showed an opposite effect compared to the previous results.
To determine which of the changes made here compared to the original 1994 calculations could have caused the observed significant change in the trend of the data, it was necessary to estimate some intermediate regression equations, each of which only included one change. Table 3 summarises these calculations.
The first column in Table 3 shows the results of the regression partly using data from the 1994 study by Benhabib and Spiegel for
the period used in that study, but only for the 17 European countries also included in the subsequent study (Benhabib, Spiegel, 1994). The result shows that the variable of average years of schooling is not significant.
This can be explained by that significantly positive relationship in this period was mainly found in developed countries outside Europe, therefore, in the case of Europe, the strong positive relationship did not exist in the first place.
The regression was run with several variables calculated in different ways in the 28 European countries for the more recent period. Variables with BS were calculated using the same methodology as used by Benhabib and Spiegel, while variables without BS were calculated using a more precise measurement. For the human capital and labour force variables, the 1994 study used data on the total male population aged 15 years and over. The more precise indicators, however, include data for the female labour force, but only for the active population. For Table 2 RegRession oF the human capital inDicatoR measuReD in aveRage yeaRs
oF schooling completeD anD gDp gRowth in 28 euRopean countRies, 2014–2019
modell: ols regression, heteroskedasticity robust standard error Dependent variable: ΔY
coefficient standard error t p
constant 0.167 0.050 3.354 0.003***
H0 –0.007 0.003 –2.244 0.035**
Hy 0.000 0.000 1.022 0.318
ΔK 0.743 0.186 3.991 0.001***
ΔL 0.101 0.212 0.478 0.637
Adjusted R 2: 0,731
Note: The coefficient is significant in the case of *** at 1%, in the case of ** at 5%, in the case of * at 10%.
Source: own calculations based on eurostat, 2021; lange, wodon, carey, 2018
the capital change considered as a control variable, the variable ΔKT BS only looks at the extent of tangible capital formation, while the ΔK indicator includes measured data on intangible capital formation, as well, in line
with statistical changes that have taken place in the meantime.5
In the new period, the human capital variable coefficient in terms of average years of schooling was negative in all cases, but the Table 3 RegRessions oF the human capital inDicatoR measuReD in aveRage yeaRs
oF schooling completeD anD gDp gRowth in euRopean countRies model: ols regression, heteroskedasticity robust standard error
Dependent variable : ΔY 1965–85
17 counties
2014–19 28 counties
2014–19 28 counties
2014–19 28 counties
2014–19 28 counties
constant 0.179
(0.111)
0.148*
(0.079)
0.154***
(0.050)
0.122*
(0.066)
0.167***
(0.050) Human capital variable
H0 –0.002
(0.004)
–0.007**
(0.003)
H0 bs –0.011
(0.014)
–0.005 (0.004)
–0.007*
(0.003) Human capital for catching up
Hy 0.000
(0.000)
0.000 (0.000)
Hy bs 0.006
(0.007)
0.000 (0.001)
0.000 (0.000) Capital change variable
ΔK 0.708***
(0.186)
0.743***
(0.186)
ΔKT bs 0.035
(0.228)
0.713*
(0.406)
0.700*
(0.362) Labour force change variable
ΔL 0.276
(0.302)
0.101 (0.212)
ΔL bs 0.364
(0.254)
0.303 (0.378)
0.212 (0.282)
Adjusted R 2 0.229 0.395 0.740 0.383 0.731
Note: The coefficient is significant in the case of *** at 1%, in the case of ** at 5%, in the case of * at 10%.
Source: own calculations based on eurostat, 2021; lange-wodon-carey, 2018; benhabib-spiegel, 1994
coefficient is not significant for the equation calculated using the older methodology with the control variable of only tangible produced capital formation. It can also be seen that when the control variable including intangible capital formation is used, the explanatory power is much higher than for the control variable including only tangible capital. The adjustment of the human capital and labour force indicators, i. e. including the total active population instead of only the male population, did not show a significant change in the regression results. The significantly negative sign of human capital could therefore be due to a change in the calculation of the capital change variable.
The application of Benhabib and Spiegel’s model to fewer countries and shorter time periods also had the undesirable side effect of introducing a more significant correlation between the independent variables in the intermediate regressions. This circumstance raises the need to change the model and to remove variables that are problematic in terms of multicollinearity but not significantly correlated with the dependent variable in the dataset used. As this change would greatly reduce the number of independent variables in the model, it may be worthwhile to look for additional independent control variables.
This research has identified two such possible variables, the initial value of the number of labour force (L0) and the initial value of GDP per capita at the beginning of the period (y0).
Incorporating the latter control variable into an equation is a common practice in the analyses of human capital and growth relationship (Savvides, Stengos, 2009). The formula of the modified equation is thus as follows:
ΔY= α + β1 H0 + β2 ΔK + β3 L0 + β4 y0 + ε (2) The results of the estimation of the regression equation are presented in Table 4.
In the modified equation, the coefficient of the human capital variable measured in average years of schooling remains significantly negative. This implies that, among the factors generating economic growth as measured by GDP growth in Europe today, a further increase in years of formal schooling is explicitly slowing down growth. Overall, three explanations for this result seem plausible.
Firstly, it is likely that we accounted for many school years in 2014 that did not result in significant intellectual performance over the next five years and reduced the growth rate. While these may be useful in the future, the negative sign points to the need for fundamental reforms of education systems (Pritchett, 2001). The change in the result due to the change in the calculation of the control variable for produced capital suggests the need to emphasise the importance of intangible capital results in the development of human capital more than previously.
Secondly, the indicator measured in years of schooling does not necessarily reflect well the value of human capital, because the effectiveness of schooling at the different stages of the learning process is not the same.
This shortcoming is highlighted by all authors who use this approach (Mankiw, Romer, Weil, 1992; Savvides, Stengos, 2009). This indicator gives way to a quantitative approach for a factor where qualitative characteristics are recognised as more important (Hanushek, Kimko, 2000). Economic growth can only be generated by truly qualitative knowledge and not by time spent in school. This underlines the importance of efforts to define more precisely the value of human capital. While the ongoing work on the development of the System of National Accounts aims to produce a human capital indicator that also reflects quality (Liu, Fraumeni, 2020), such an indicator is not yet available for longer periods. Guidance
for policies to improve education can only be formulated when we can reliably estimate the quality of human capital. Nevertheless, the negative coefficient makes it clear that the future of European countries can only be adequately underpinned by better learning, not more learning.
Thirdly, changed circumstances may mean that economic growth measured by GDP is no longer the most important goal for European societies. Increasing human capital can also lead to outcomes generating social well-being which is not expressed in GDP measuring economic performance. Achieving economic growth is only one of the many tasks of human capital. If a society is successful in providing the material basis for a comfortable livelihood, it is natural that human knowledge will turn towards the achievement of higher goals that cannot be measured in monetary terms. If these goals are not reflected in the indicators of economic performance, it does not mean that human capital is inefficient, therefore we
need to rethink not only the measurement of resources, but also of goals.
specificiTies of hungary and The easTern group of counTries
In the case of European countries with lower economic performance, mainly in Central and Eastern Europe, it may be particularly striking that economic growth does not correspond to the level of school years completed. This may also have been caused in the past by that, due to a less efficient institutional environment, years of accumulated schooling did not necessarily translate into higher levels of accumulation of efficient human capital and faster economic growth (van Leeuwen, Földvári, 2013). The outdated techniques in education management, the almost entrenched financing and organisational structures have long hindered effective cooperation between Table 4 RegRession oF the human capital inDicatoR measuReD in aveRage yeaRs oF schooling completeD anD gDp gRowth in 28 euRopean countRies with a
moDiFieD moDel, 2014–2019
model: ols regression, heteroskedasticity robust standard error Dependent variable : ΔY
coefficient standard error t p
constant 0.179 0.036 5.042 0.000***
H0 –0.006 0.003 –1.964 0.062*
ΔK 0.768 0.116 6.603 0.000***
L0 –0.000 0.000 –1.724 0.098*
y0 –0.000 0.000 –2.260 0.034**
Adjusted R 2: 0,782
Note: The coefficient is significant in the case of *** at 1%, in the case of ** at 5%, in the case of * at 10%.
The coefficient is approximately -4x10⁻⁷
Source: own calculations based on eurostat, 2021; lange-wodon-carey, 2018
the education and economic sectors and ultimately the effectiveness of educational activity in terms of economic growth also in Hungary (Lentner, 2007).
This explanation is also plausible from an international perspective because the 1994 analysis showing a positive relationship did not include those Central and Eastern European countries where there was a significant gap between human capital and accumulated years of schooling and where the institutional environment was not conducive to the economic growth-generating effects of knowledge. However, the highly significant negative sign calculated for all 28 countries in the recent study may also indicate that the changed circumstances that now prevail in the more advanced Western European countries do not always ensure the effective economic growing potential of schooling. Nevertheless, between 2014 and 2019, economic growth in Central and Eastern Europe was generally already higher than in Western Europe, in line with their lower initial GDP per capita, reminiscent of the growth trend in the boom period before the crisis started in 2008 (Dombi, 2013). The regression data for Hungary are shown in Table 5.
The data show that economic growth in Hungary between 2014 and 2019 was above
the average for European countries. Although the initial GDP per capita figure for 2014 is well below the European average, in terms of regressions, it is not common for European countries to experience a growth of this magnitude from such backwardness. Given that labour force education and broader capital growth in Hungary have been average, it seems clear that the most important factor behind the relatively high growth was the increase in tangible produced capital. Even so, the residuum of Hungary is positive when the estimated regression coefficients are put into the equation, fifth highest among the 28 countries in the first regression equation and sixth highest in the second regression equation. Similar high residuum values were found by Boda et al. in an earlier study (Boda, Juhász, Stocker, 2009). This means that the variables examined here only partly explain the high growth, with other factors not examined herein also contributing significantly.
Van Leeuwen and Földvári examined the contribution of capital factors to economic growth by measuring also the monetary value of human capital for Hungary. Their results suggest that this estimation method achieves a higher explanatory power using only named and valued resources, thus the role of returns in human capital valuation is also important Table 5 RegRession Data oF hungaRy
hungary’s values average value for 28 countries
median value for 28 countries
ΔY 1.22 1.17 1.15
H0 13.12 12.95 13.26
H0MT 12.28 12.15 12.46
ΔK 0.93 0.93 0.92
ΔKT 0.90 0.89 0.87
Source: own calculations
in explaining Hungary’s growth (van Leeuwen, Földvári, 2011).
conclusions
From the very beginning, economic analyses of the relationship between human capital and economic growth have emphasised the positive relationship between the two concepts, which seemed and still seems to be theoretically logical. For this reason, any calculation that finds a negative rather than a positive relationship between these concepts seems strange and confusing, even though empirically a positive relationship has only been demonstrated at the microeconomic level. Macroeconomic research has tended to find a positive relationship only for specific components of human capital or by rejecting a linear relationship (Savvides, Stengos, 2009).
This study, based on an older model by Benhabib and Spiegel (1994), attempted to investigate the relationship between human capital value in terms of average years of schooling completed and economic growth measured by GDP using the traditional method on more recent data collected between 2014 and 2019. The data came from 28 European countries. The results obtained were contrary to the previous study by Benhabib and Spiegel and the 2003 analysis conducted by Papageorgiou (Benhabib, Spiegel, 1994;
Papageorgiou, 2003). Both previous studies found a clear positive relationship among countries with higher GDP per capita, while the more recent assessment conducted for a more narrowly defined set of countries over a shorter period in this study yielded findings that clearly showed a significant negative coefficient for this variable.
The reasons for the negative relationship between economic growth and years of schooling completed may be multifaceted.
Repeated analysis on older data suggests that the relationship examined for European countries had not been significantly positive in the past either. In the more recent period, however, the sign has become clearly negative.
This is most likely due to a previously unexamined statistical change that can now directly measure the value of some highly important intangible capital items (capitalised value of R&D, intellectual products, software) in the capital change used as a control variable.
It has thus become possible to control the growth equation also by the change in intangible capital. The calculations show that these capital items can be essential for economic growth and that the human capital variable estimated by the number of school years can only have a positive accelerating effect on economic growth if it can contribute to increasing the value of these intangible capital items. However, it is also likely that the negative sign indicates a change in the economic and social objectives as well and that in the five-year period under review, human capital development has not been able or necessarily intended to contribute effectively to GDP growth measured by current standards.
The results of the study point to the need to fundamentally reform the European education system in a changed world if human capital is to fulfil its function of developing the economy. To achieve effective results, better quality formal education systems are needed, although it is unlikely that economic statistics will be able to draw any more specific conclusions any time soon. At the same time, further research into alternative ways of measuring human capital and the value creation that it is supposed to generate, which have not yet been addressed by existing research, is also worthwhile. Perhaps, with new and more meaningful indicators, the relationship between human capital and the economy and society would be better understood.
Irodalom Notes
1 The term ‘physical capital’ is common in English literature and its translations. In earlier Hungarian terminology, the ambiguous plain ‘capital’ or the now outdated term ‘dead capital’ was used to refer to this concept. Here I have found the term
‘produced capital’ to be the most accurate, based on recent English literature.
2 Note that Becker considered health and health care expenditure as part of human capital, but subsequent literature began to distinguish between short-term and long-term factors.
3 This explanation of human capital theory is of course simplistic and ignores the possibility and impact of learning at work or in the workplace, but this does not mean that these forms of lifelong learning cannot be integrated into the theory. This consideration, however, falls outside the scope of this study.
4 I treat the value and production of intangible assets measured in economic statistics as intangible capital in this study. This includes intellectual products, capitalised R&D results and software.
Since 2010, these intangible capital items have been included in the statistics as part of the produced capital.
5 The produced capital data before the statistical changes in 2010 did not include intangible elements. In order to understand the effect of the statistical change, I have also calculated the data for the produced capital of the more recent period without intangible elements.
This produced capital, calculated using the old fashioned concept, is referred to herein as
‘tangible capital’.
Balog I. I. (2018). Accounting for human capital in the National Accounting System. In: Resperger, R. (ed.) Demographic changes, changing economic challenges. International Scientific Conference Sopron, 8 November 2018 Collection of Studies, pp. 245–258
Becker, G. S. (1962). Investment in Human Capital: A Theoretical Analysis. Journal of Political Economy, 70, pp. 9–49
Benhabib, J., Spiegel, M. M. (1994). The role of human capital in economic development.
Evidence from aggregate cross-country data. Journal of Monetary Economics 34, pp. 143–173
Boda Gy., Juhász P., Stocker M. (2009).
Knowledge as a production factor. Köz-Gazdaság
(Review of Economic Theory and Policy), 4(3), pp.
117–132
Dombi Á. (2013). Economic Growth and Development in Central and Eastern Europe after Transformation. Pénzügyi Szemle (Financial Review), 58(4), pp. 464–480
Hanushek, E. A., Kimko, D. D. (2000).
Schooling, Labor Force Quality, and the Growth of Nations. American Economic Review, 90, pp.
1184–1208,
https://doi.org/10.1257/aer.90.5.1184
Judson, R. (2002). Measuring Human Capital like Physical Capital: What Does It Tell Us? Bulletin of Economic Research, 54(3), pp. 209–231,
https://doi.org/10.1111/1467–8586.00150
Lange, G., Wodon, Q., Carey, K. (eds.) (2018).
The Changing Wealth of Nations 2018: Building a Sustainable Future. World Bank, Washington D. C.,
https://doi.org/10.1596/978–1–4648–1046–6 Lee, R., Mason, A. (2010). Fertility, Human Capital, and Economic Growth over the Demographic Transition. European Journal of Population, 26, pp. 159–182,
http://dx.doi.org/10.1007/s10680–009–9186-x Lentner Cs. (2007). The Competitiveness of Hungarian University-based Knowledge Centers in European Economic and Higher Education Area.
Transformations in Business & Economics, 6/2(12), pp. 87–99
Liu, G., Fraumeni, B. M. (2020). A Brief Introduction to Human Capital Measures. NBER Working Paper, 27561,
https://doi.org/10.3386/w27561
Mankiw, N. G., Romer, D., Weil, D. N. (1992).
A Contribution to the Empirics of Economic Growth. Quarterly Journal of Economics, 107, pp.
407–437
Mastromarco, C., Simar, L. (2021). Latent heterogeneity to evaluate the effect of human capital on world technology frontier. Journal of Productivity Analysis, 55, pp. 71–89,
https://doi.org/10.1007/s11123–021–00597-x Papageorgiou, Ch. (2003). Distinguishing Between the Effects of Primary and Post-primary
Education on Economic Growth. Review of Development Economics, 7/4, pp. 622–635, https://doi.org/10.1111/1467–9361.00213
Pritchett, L. (2001). Where Has All the Education Gone? The World Bank Economic Review, 15(3), pp. 367–391
Prescott, E. C. (1988). Robert M. Solow’s Neoclassical Growth Model: An Influential Contribution to Economics. The Scandinavian Journal of Economics, 90(1), pp. 7–12
Savvides, A., Stengos, Th. (2009). Human Capital and Economic Growth. Stanford University Press., Stanford
T. Kiss J. (2012). The Statistical Measurement of Human Capital. Statisztikai Szemle (Statistical Review), 90(1), pp. 64–88
van Leeuwen, B., Földvári P. (2011). Capital Accumulation and Growth in Hungary, 1924–2006.
Acta Oeconomica, 61(2), pp. 143–164, https://doi.org/10.1556/AOecon.61.2011.2.3
van Leeuwen, B., Földvári P. (2013). Capital Accumulation and Growth in Central Europe, 1920 – 2006. Eastern European Economics, 51(5), pp. 69–93, https://doi.org/10.2753/EEE0012–8775510503
Eurostat (2014). Manual on the changes between ESA 95 and ESA 2010. Eurostat, Luxembourg
Eurostat (2021). Eurostat database. Online:
https://ec.europa.eu/eurostat