SEMMELWEIS EGYETEM DOKTORI ISKOLA
Ph.D. értekezések
2411.
DEÁK GÁBOR GYÖRGY
Szemészet című program
Programvezető: Dr. Süveges Ildikó, professor emerita Témavezető: Dr. Resch Miklós, egyetemi docens
In vivo examination of laser induced retinal changes in patients with diabetic retinopathy
PhD thesis
Gábor György Deák MD
Clinical Medicine Doctoral School Semmelweis University
Supervisor: Miklós Resch, MD, PhD Official reviewers: Eszter Vizvári, MD, PhD
Anna Bakos-Kiss, MD, PhD
Head of the Complex Examination Committee: Judit Fidy, MD, DSc
Members of the Complex Examination Committee: Katalin Gombos, MD, PhD Antal Szabó, MD, PhD Budapest
2020
2
1 Table of contents
1 Table of contents ... 2
2 List of abbreviations ... 6
3 Introduction ... 8
3.1 Laser therapy ... 8
3.1.1 The physics of laser ... 8
3.1.2 Laser properties and radiation parameters ... 10
3.1.3 Tissue laser interactions and their implications in ophthalmology ... 12
3.1.4 The brief history of retinal photocoagulation ... 14
3.1.5 Current challenges of laser therapy in diabetic retinal disease ... 15
3.2 Optical Coherence Tomography ... 19
3.2.1 Time-Domain OCT technology ... 21
3.2.2 Spectral-Domain OCT Technology ... 23
3.2.3 Swept-source optical coherence tomography ... 25
3.2.4 OCT angiography ... 26
3.3 Diabetic retinal changes ... 29
3.3.1 Diabetes mellitus ... 29
3.3.2 Diabetic retinopathy ... 30
3.3.3 Diabetic macular edema ... 32
4 Purpose ... 34
5 Methods ... 36
5.1 In vivo examination of retinal changes following panretinal photocoagulation 36 5.1.1 Patients ... 36
3
5.1.2 Examination and documentation ... 36
5.1.3 Retinal Photocoagulation ... 36
5.1.4 Retinal Imaging Using Spectral Domain-Optical Coherence Tomography 37 5.2 In vivo examination of retinal changes following macular grid and focal photocoagulation ... 38
5.2.1 Patients ... 38
5.2.2 Examination and documentation ... 38
5.2.3 Retinal photocoagulation ... 39
5.2.4 SD-OCT Imaging ... 39
5.3 In vivo morphology of retinal changes following sub-threshold panretinal photocoagulation ... 39
5.3.1 Patients ... 39
5.3.2 Examination and documentation ... 40
5.3.3 Retinal photocoagulation ... 40
5.3.4 SD-OCT Imaging ... 40
5.4 Hyperreflective foci on OCT in patients with diabetic macular edema and their response to macular photocoagulation ... 41
5.4.1 Patients ... 41
5.4.2 Examination and documentation ... 41
5.4.3 Retinal photocoagulation ... 41
5.4.4 SD-OCT Imaging ... 41
6 Results ... 43
6.1 In vivo examination of retinal changes following panretinal photocoagulation 43 6.1.1 Early Effects of Photocoagulation ... 43
6.1.2 Healing Response after Photocoagulation ... 45
4
6.2 In vivo examination of retinal changes following macular grid and focal
photocoagulation ... 48
6.2.1 Morphologic Retinal Changes ... 48
6.2.2 Biometric Retinal Changes ... 52
6.3 In vivo morphology of retinal changes following sub-threshold panretinal photocoagulation ... 55
6.3.1 Morphology of laser burns during the follow-up ... 56
6.4 Hyperreflective foci on OCT in patients with diabetic macular edema and their response to macular photocoagulation ... 62
6.4.1 Resorption of intraretinal lipids ... 65
6.4.2 Condensation of microexudates to clinically visible hard exudates ... 66
6.4.3 Dynamic shifting of microexudates with persisting retinal swelling. ... 67
6.4.4 Dissemination of clinical hard exudates into multiple hyperreflective foci 68 7 Discussion ... 70
7.1 In vivo examination of retinal changes following panretinal photocoagulation 71 7.2 In vivo examination of retinal changes following macular grid and focal photocoagulation ... 73
7.3 In vivo morphology of retinal changes following sub-threshold panretinal photocoagulation ... 75
7.4 Hyperreflective foci on OCT in patients with diabetic macular edema and their response to macular photocoagulation ... 77
8 Conclusions ... 79
8.1 In vivo examination of retinal changes following panretinal photocoagulation 79 8.2 In vivo examination of retinal changes following macular grid and focal photocoagulation ... 79
5
8.3 In vivo morphology of retinal changes following sub-threshold panretinal
photocoagulation ... 79
8.4 Hyperreflective foci on OCT in patients with diabetic macular edema and their response to macular photocoagulation ... 80
9 Summary ... 81
10 Összefoglalás ... 83
11 References ... 85
12 List of Publications... 104
12.1 List of Publications related to the topic of the dissertation ... 104
12.2 List of Publications not related to the topic of the dissertation ... 104
13 Acknowledgement ... 110
6
2 List of abbreviations
BCVA Best corrected visual acuity
BM Bruch’s membrane
CCD Charge-coupled device
CFP Color fundus photography
CRT Central retinal thickness CRVO Central retinal vein occlusion
CSME Clinically significant macular edema
DM Diabetes mellitus
DME Diabetic macular edema
DR Diabetic retinopathy
DRCR.net Diabetic Retinopathy Clinical Research Network DRS Diabetic retinopathy study
ELM External limiting membrane
ETDRS Early treatment diabetic retinopathy study
FA Fluorescein angiography
FAF Fundus autofluorescence
GCL Ganglion cell layer
GLD Greatest linear diameter ILM Internal limiting membrane
INL Inner nuclear layer
IPL Inner plexiform layer
IR Infrared
IRMA Intraretinal microvascular abnormalities IS/OS Inner segment / outer segment *
LogMAR Logarithm of the minimal angle of resolution Nd:YAG Neodymium-doped yttrium aluminum garnet NPDR Non-proliferative diabetic retinopathy
OCT Optical coherence tomography
OCTA Optical coherence tomography angiography
ONL Outer nuclear layer
7
OPL Outer plexiform layer
PASCAL Pattern scanning automated laser PDR Proliferative diabetic retinopathy
PRL Photoreceptor layer*
PRP Panretinal photocoagulation RCT Randomized clinical trial
RF Red free
RNFL Retinal nerve fiber layer
ROI Region of interest
RPE Retinal pigment epithelium
SD Standard deviation
SD-OCT Spectral-domain optical coherence tomography SS-OCT Swept-source optical coherence tomography
SLD Super luminescent diode
TRP Thickest retinal position
VA Visual acuity
VEGF Vascular endothelial growth factor
* IS/OS and PRL can both be used to describe the same layer in OCT
8
3 Introduction
3.1 Laser therapy
3.1.1 The physics of laser
The word laser is an acronym for Light Amplification by Stimulated Emission of Radiation.1 The first publications mentioning an amplification chamber resulting with the emission of electromagnetic waves (microwaves) were published in the late 1940s simultaneously by two groups, Townes and Schawlow in the USA, and Prokhorov and Basov in the Soviet Union.2–4 Later the American group of physicists continued their experiments with amplification cavities to produce infrared and visible light. The diligent work of both groups has paid off as they were jointly awarded with the Physics Nobel Prize in 1964 and in 1981. The first description of a ruby solid state red light emitting laser was made by Maiman in his 1960 publication in Nature.5 The development of different laser “masters” has picked up pace in the following decades, and many of these laser types are still in use, such as gallium-arsenide phosphide laser diode in 1962 which is used in LEDs, CD and DVD players.6 Carbon dioxide laser and the neodymium-doped yttrium aluminum garnet (Nd:YAG) laser were both published in 1964 and are both used in medicine for surgery and the later used in ophthalmology and dermatology for multiple indications.
The theoretical principals of lasers were described by Einstein in 1917, based on the quantum theory of Bohr and the hypothesis of de Broglie that light has a dual nature of wave and particle.7 In Bohr’s theory every material has a ground state energy. If this material is influenced by an external energy i.e. light, material can absorb energy and its molecules enter in an excited state. Usually after a short period of time these molecules return in to their ground state, and during this they emit a photon with the same energy as the energy difference between the molecules excited and ground states. This process is called a spontaneous emission (b). In Einstein’s hypothesis if a molecule in an excited state is irradiated by a photon it can force a transition to ground state, and the resulting excited photon will have the same energy, the same direction and the same phase as the irradiating photon. This was called a stimulated emission (c).
9
Figure 1.: Changes in quantum systems after an interaction with electromagnetic radiation. a) material absorbing the energy of a photon (E=hv (h Planck constant, v frequency)) moves from its ground state (E1) to an excited state (E2). b) spontaneous emission occurs after the lifetime of the excited material expires. The material returns to its original ground state, and a photon is emitted with the same energy as the difference between the excited and ground states of the material (E2- E1). c) Stimulated emission happens when a photon irradiates material already in excited state. During stimulated emission the material returns to its ground state, and in the mean while two photons with the same energy (E2- E1), same direction and same phase is emitted. 8
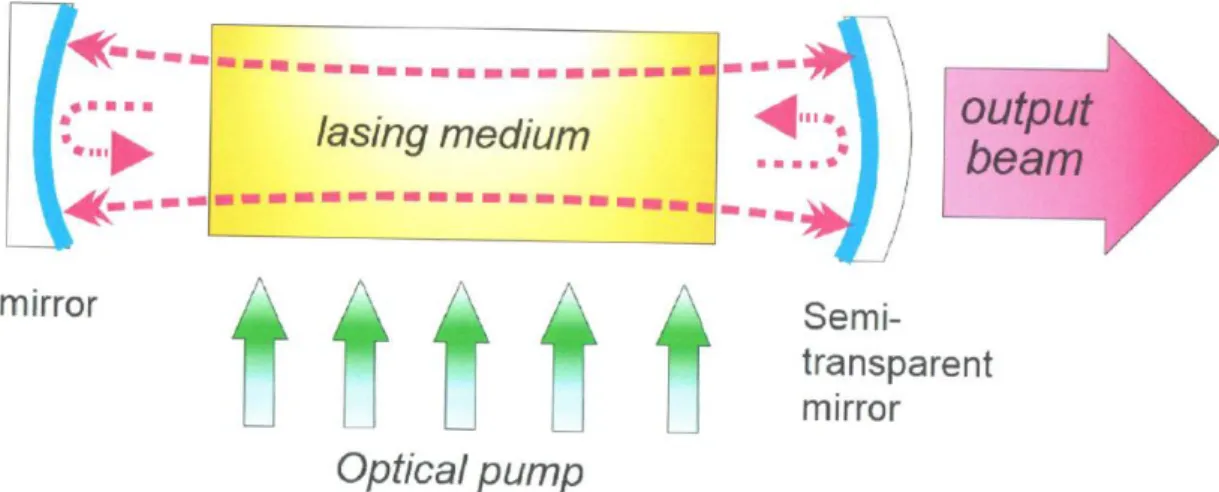
In general lasers work the following way: A cavity is filled with a material that can be excited with a so called pump (which can be a flash lamp or some electric discharge). The material than enters in a “population inversion” state, where more molecules/atoms are in excited state than in their ground state. The two ends of the cavity are closed with two mirrors. One of these mirrors is a semi-reflective mirror, so that a light beam can escape the cavity. Inside the cavity photons are emitted as the excited material returns to its ground state. These photons which are in different polarization circulate in all directions inside the cavity, causing more and more stimulated emissions. Coherent light with the same wavelength, phase and directions escapes the cavity through the aperture of the semi-reflective mirror forming a laser beam (Figure 2.).
10
Figure 2.: Schematic drawing of a laser cavity or optical (open) resonator.1
3.1.2 Laser properties and radiation parameters
The properties of a laser light can be described by the same characteristics as any other light type or electromagnetic radiation. These characteristics are directionality, coherence monochromaticity and high brightness. Laser beams are very well collimated meaning that the spread of the beam stays very small even when projected over a long distance.
This enables that high fluences can be achieved by laser beams compared to other light sources. The light waves in a laser beam are coherent meaning that they are in the exact same phase when they exit the optical resonator, and stays this way for an extended travel length. Most of the laser systems used generate a light beam with a very narrow wavelength. This property is called monochromaticity. Although some laser systems offer the possibility to change the wavelength produced such as tunable lasers, still the wavelength window of these devices is so narrow that they can still be called monochromatic. Finally, since lasers generate light with very high energy with high directionality they can achieve high brightness compared to other light sources.
The main parameters a laser beam can be described are the following: wavelength, pulse width or duration, repetition frequency, pulse energy of or mean power (depending on temporal characteristics of the laser), spot size and energy density or power density.
11
Wavelength can vary on a broad spectrum from infrared through the visible spectrum to UV and X-ray, and is generally dependent on the laser medium used. The optimal type of laser system for a specific use is mainly affected by the absorption characteristics of the target medium. The wavelength of a laser depends on the photon energy generated by the laser medium when it re-enters its ground state. Thus it has to be taken in to account, that photons of different wavelengths carry a different amount of energy, and therefore cause different effects on the target medium.
Regarding temporal characteristics, lasers can be divided in two groups: continuous lasers and pulsed lasers. A continuous laser emits a continuous beam of light as long as the laser medium is excited, whereas in pulsed laser the laser emits pulses of energy. There are three typical regimes how lasers can produce both continuous and pulsed light. Free- running regime means that the amplification process in not blocked and radiation amplifies freely within the laser resonator as long as the pumping is active. Depending upon whether the pumping is continuous or in pulses the laser emitted will also be continuous or pulsed. Q-switched lasers have a special shutter inside the resonator that prevents oscillation. The laser medium is activated by pumping, and when it reaches certain energy the shutter is opened and a very intense pulse is generated with a duration in the range of nanoseconds. If the pumping is continuous, a train of pulses is generated as long as the pumping continues. This is called a quasi-continuous Q-switched regime.
Mode-locked lasers work similarly to Q-switched, but here the shutter causes the coupling of the longitudinal modes in the resonator so that their phases are locked. The beam created by mode-locked lasers is also similar to those of a Q-switched, but the pulse duration is even shorter in the range of pico- or femtoseconds.
Energy and power of a laser are the most important parameters steering what effect the laser beam will have on the tissue. Energy –measured in Joules (J)- is usually used to characterize radiation in pulsed lasers, and power (average output power measured in watt (W)) is used to characterize radiation in continuously running lasers. In medical application the most important parameter to describe a laser radiation is fluence or energy density. It describes the total sum of energy delivered to a specific area of tissue. It is calculated by the division pulse energy with laser spot size and is expressed as J/cm2.
12
3.1.3 Tissue laser interactions and their implications in ophthalmology
Laser can induce a wide variety of reactions in human tissue ranging from photochemical changes to instant vaporization of the material. The qualities of laser that determine what happens with the irradiated tissue are wavelength, fluence and irradiation time. In general the higher the absorbed photon energy and the shorter the timespan the energy is delivered the more tissue disruption is generated.9
3.1.3.1 Photochemical interaction
Photochemical interactions are usually induced with light sources that emit light that is not absorbed by the target tissue itself, but the effect is mediated by an exogenous agent instead. To avoid tissue heating the exposure times are generally much longer (multiple minutes), and the irradiance is usually very low. Here the laser is only used to activate the exogenous material, and the tissue changes are mediated by this agent.10 The two modalities using photochemical interaction that are currently performed are photodynamic therapy and corneal crosslinking. In the prior verteporfin is administered intravenously, and then the region of interest is irradiated with a low energy continuous laser with 689 nm wavelength. There is no thermal reaction involved, but the photoactivation of verteporfin that binds to low density lipoprotein (LDL)-receptors found on the endothelial cells of choroidal vessels cause vasoocclusion of choroidal vessels in the irradiated area. Retinal vessels that lack LDL-receptors are spared.11 In corneal collagen crosslinking riboflavin is applied locally on the corneal surface (after abrasion), and is than irradiated with a low intensity (3mW/cm2) UVA light for 30 minutes. It has been shown, that corneal collagen crosslinking is able to prevent progression of corneal ectatic diseases.12
3.1.3.2 Photothermal interaction
Photothermal interaction can cause a broad range of tissue alterations depending on the amount of heat generated. Such alterations range from minor changes in cell metabolism such as cytokine expression to apoptosis and necrosis of the cell. Chromophores such as water, hemoglobin, melanin, xanthophyll and other pigments absorb the light in tissues, and their absorption spectrum defines which wavelength of light is necessary for an optimal laser effect. The amount of tissue damage is defined by the amount of intracellular proteins denaturized. This changes exponentially depending on laser power and linearly
13
depending on exposure time as described by the Arrhenius integral. The most common form of photothermal laser interaction is retinal photocoagulation.
Laser wavelength used for retinal photocoagulation varies between 488 and 694 nm (argon and ruby laser respectively), but most commonly frequency doubled Nd:YAG lasers or semiconductor lasers with 532 nm (green) or 577 nm (yellow) respectively are used. In this wavelength spectrum the two chromophores absorbing laser energy are hemoglobin and melanin in the retinal pigment epithelium (RPE) and in the choroid.
During a laser pulse application heat is generated at the level of the RPE. Depending on the power and the pulse duration this access heat diffuses to the adjacent tissue in 360°.
This phenomenon is called thermal blooming. When a laser pulse with 100 ms duration is applied to the retina, heat diffusion can reach up to 200 µm meaning not only that the tissue at the lateral edges of the lesion will be affected (and with that the effective lesion size will be larger) but also the inner retinal layers including the retinal nerve fiber layer (RNFL) will be affected causing more widespread damage as the size of the lesion alone.13 With the reduction of the pulse duration the amount of thermal blooming can be reduced, but to achieve the same visible threshold laser effect the laser energy has to be increased. After a certain reduction of the pulse duration unwanted photomechanical interactions might occur.
3.1.3.3 Photomechanical interaction
If a high energy laser with a very short exposition time (tens of ns) is applied on a tissue it causes a photoablation as the temperatures achieved are higher than the vaporization threshold. The gas bubbles created by the vaporization create small explosions that rupture nearby tissue with very high precision and only minimal tissue damage at the edges of the treatment zone. Photodisruption and dielectric breakdown happen when the pulse duration is even shorter (in the nanosecond-femtosecond region). If the energy is applied in such a short pulse plasma develops and mediates rapid explosive vaporization to the tissue. Photoablation is used in ophthalmology in laser mediated corneal surgery where nanosecond pulses of 193 nm wavelength laser irradiation causes extremely precise ablation of stromal tissue. With such short pulse duration the residual tissue damage is extremely low. Plasma mediated photodisruption is used to perform laser capsulotomies and laser iridotomies. Nd:YAG lasers cause explosive vaporization of the
14
liquid medium causing tissue rupture. With pulse durations in the femtosecond range photodisruption is used to perform the precise dissection of the corneal stroma, lens capsule and crystalline lens during femtosecond assisted cornea and cataract surgery.
3.1.4 The brief history of retinal photocoagulation
Ophthalmology is an ideal field for the use of lasers both in the treatment and in the diagnosis of diseases, since the eye is mainly built by tissue with clear optical properties.
The first description of “laser” coagulation of the retina was actually light photocoagulation developed by a German ophthalmologist Meyer-Schwickerath.14,15 He developed an elaborate conception on the roof of the Department of Ophthalmology in Hamburg-Eppendorf in the late 1940s to collect sunlight, and used a series of mirrors to bring the light ray in to the operating theater. Later in the 1950s he deployed a high pressure xenon arc lamp as light source, thus eliminating the need of direct sunlight.16 The same year Meyer-Schwickerath failed with the first attempts of light coagulation, Kettesy the chair of the Department of Ophthalmology in Debrecen performed the first successful light coagulation in a patient with a retinal tear by having the patient look in to the sunlight.17 Among others retinal detachments and diabetic retinopathy were among the first diseases to be treated with light and photocoagulation.18–20
The first truly “modern” concept of how to perform laser therapy in patients with proliferative diabetic retinopathy was described by Beetham et al in 1969.21 The first randomized clinical trial examining the beneficial effects of laser was the diabetic retinopathy study (DRS). The DRS study started in 1972 and showed that panretinal photocoagulation (PRP) reduced the risk of severe visual in loss in 4 years both in the severe nonproliferative (NPDR) as well as in the mild and high-risk proliferative diabetic retinopathy (PDR) groups, with achieving a 24% reduction in the latter group.22 The early treatment diabetic retinopathy study (ETDRS) was one of the most important landmark studies in diabetic retinopathy. It not just evaluated the effect of macular and panretinal laser treatment but also laid down the basis how we measure functional outcomes like visual acuity, how to analyze morphologic endpoints, and how to classify diabetic retinal disease.23,24 In respect of laser treatment the ETDRS study examined the effect of macular and panretinal laser therapy in patients without high risk characteristics. It showed that macular grid and focal photocoagulation reduced the loss of VA after 3 years significantly
15
in patients with clinically significant macular edema with or without macular involvement.25 Regarding PRP showed that it is safe to defer treatment in patients with severe NPDR or non-high-risk PDR until high-risk characteristics are seen.26 In the 1980s laser therapy was examined in the indications for all major retinal diseases. The branch vein occlusion study showed, that in patients with macular edema due to branch retinal vein occlusion macular grid photocoagulation treatment resulted in better visual outcomes (65% vs 37% of eyes with 2 line VA improvement laser vs sham respectively) than observation. Furthermore the study showed that sectorial PRP reduced the risk of severe VA loss in patients with retinal or iris neovascularization.27,28 The central vein occlusion study however showed that grid photocoagulation provided no benefit to patients with macular edema due to central retinal vein occlusion, but prompt panretinal photocoagulation was necessary and beneficious if neovascularization on the retina or iris occurred.29 In age-related macular degeneration the macular photocoagulation study laid out the basis of performing laser therapy in patients with choroidal neovascularisations.30 3.1.5 Current challenges of laser therapy in diabetic retinal disease
Since the results of the DRS and ETDRS studies were published laser photocoagulation was the only approved and effective therapy for patients with diabetic macular edema and proliferative diabetic retinopathy.31 This changed with the advent of novel pharmacological therapeutics in the late 2000s and early 2010s. Multicenter randomized clinical trials like the Ride/Rise, Vivid/Vista and Restore studies showed that intravitreal anti-vascular endothelial growth factor (anti-VEGF) therapy is more effective in improving visual acuity, reducing macular thickness and preventing sever visual loss than macular laser therapy in patients with diabetic macular edema (DME).32–34
The Diabetic Retinopathy Clinical Research Network (DRCR.net) conducted multiple studies regarding diabetic eye disease. In Protocol I they compared the efficacy of ranibizumab with prompt (at time of initiation of treatment) and deferred (≥24 weeks) focal/grid laser treatment. The 3-year results of the study suggested that focal/grid laser treatment at the initiation of intravitreal ranibizumab therapy was not better, and possibly worse for vision outcomes, than deferring laser treatment for ≥24 weeks in eyes with DME involving the fovea. The 1-year results showed that intravitreal ranibizumab with
16
prompt or deferred laser was more effective through 2 years compared with prompt laser alone for the treatment of DME involving the central macula.
Another landmark study from the DRCR.net -Protocol S- compared the effectiveness of panretinal photocoagulation vs. anti-VEGF therapy for proliferative diabetic retinopathy.35,36 In this randomized, multicenter, noninferiority trial, 394 eyes of 305 adults with PDR were randomized to receive either PRP or anti-VEGF therapy (pro re nata). Eyes in both groups were allowed ranibizumab if DME was present. The study showed that rates of active neovascularization or rates of regression of neovascularization were similar between the two groups. Ranibizumab was not inferior to PRP in terms of visual acuity outcomes at 2 years (+2.8 letters vs. +0.2 letters respectively P<0.001). In the ranibizumab group there was less mean reduction in peripheral visual field (-23 dB vs. -422 dB; P<0.001) than with PRP treatment. The rates for vitrectomy (15% vs. 4%;
P<0.001), and DME development (28% vs. 9%; P<0.001) was more frequent in the PRP group than in the ranibizumab group.
PRP has known side effects, most of all loss of visual field, worsening of night vision, but also reduced color vision and reduced contrast sensitivity.37 Furthermore small case series reported loss of accommodation, and atonic pupils following PRP:38,39 Despite these known side effects the DRCR.net study and its post-hoc analysis concluded, that although anti-VEGF therapy for the treatment of PDR is as good as panretinal photocoagulation, PRP is still a viable therapy option for this condition due to its long lasting effect, cost effectiveness, and less time burden due to less follow-ups on the patients and the health care system.36,40
Current guidelines rely on the clinician’s decision on how they manage PDR. Anti-VEGF therapy might be a good option for patients with simultaneous DME, while patients with historically bad compliance might benefit more from PRP.41,42 Data shows patients with poor compliance treated with anti-VEGF monotherapy often return after falling out of regular checkups with advanced PDR complications.43
In order to minimize side effects associated to PRP and to maximize patient and physician comfort a number of novel technological advances have been introduced. One of these methods is to deploy laser systems that can deliver high laser energy with shorter pulse
17
duration. Animal model studies showed that with reduction of the laser pulse duration the acute damage of the inner retinal layers can be significantly reduced (Figure 3).13,44 Furthermore when only the outer layers of the retina are acutely damaged with shorter pulse durations a considerable amount of regeneration and remodeling was observed in the retina. The continuity of the RPE monolayer was restored through RPE migration and proliferation within 1 week compared with damage of longer-duration pulses of 100 ms.45 The damage zone in the photoreceptor layer is initially filled with glial tissue, but over time, the photoreceptors from the adjacent retina shift into the damage zone, thereby reducing its size. With lesion size of 200 mm and below, and with no damage to the inner retinal layers, photoreceptors can completely refill the damage zone and rewire to local bipolar cells over time, thereby restoring retinal structure and function and avoiding the extensive glial scarring and neuronal loss associated with longer-duration retinal burns.45 Another advantage of such a laser system, that it allows the subsequent placement of multiple laser burns in predefined pattern within a short period of time in order to reduce the time needed to perform the laser procedure.
Figure 3.: The acute phase pf A) 10 and B) 100ms laser burns. A) Damage after 10ms laser pulse duration is limited to the RPE and photoreceptors. The inner retinal layers are intact. B) There is a considerable amount of damage to the choroid as well as the inner retinal layers in the acute phase. 44
Creating funduscopically and/or instrumentally non-visible subthreshold laser burns using micropulsed diode lasers is another method to reduce laser side effects. In micropulsed laser the laser pule is not applied in a continuous wave, but in trains of laser bursts (usually 100-300µs) with predefined duty cycles. The pulses are divided by regular
18
off-times. This fractioning of the laser energy enables better heat diffusion in the tissue, and therefore the RPE is treated with a sublethal effect.46 The hypothetical endpoint of subthreshold micropulsed laser therapy is not the destruction of the RPE but its modulation, to change its cytokine expression.47,48 Early retrospective and prospective studies with small patient numbers showed promising results with micropulse laser in the treatment of DME and in PDR.49–53 Randomized clinical trials to confirm these findings are currently under way.54 In other diseases such as central serous chorioretinopathy subthreshold micropulse laser was found inferior to current standard of care (halved fluence PDT), although some authors question the results due to the laser protocol used.55,56
Navigated lasers use fundus tracking technology in order to find regions of interests, and deliver laser radiation to the exact location selected by the operator. Pre-treatment planning of the treatment is possible either from fundus photography or even from fluorescein angiography (FA) images. FA images captured can be registered to the real- time fundus image, and regions of interest such as microaneurysms can be treated even if they are not visible on fundus examination. Navigated lasers promise higher accuracy when aiming at small lesions due to the eye movement tracking, and also higher safety as predefined safety zones are constantly monitored, so that inadvertent treatment of these is not possible.57 Large randomized studies like the Restore trial and Protocol I did not show benefit in combining anti-VEGF therapy with conventional ETDRS macular laser therapy for achieving better visual acuity or reducing the number of injections.33,58 Some authors suggested, that the heterogeneity in the quality of how macular laser was performed limited the additional beneficial effect. A small randomized prospective study comparing anti-VEGF therapy with either navigated laser or conventional laser did not find a statistically significant difference in the number injections nor in VA improvement and central retinal thickness loss after 12 months.59 Another study compared anti-VEGF in monthly versus treat and extend regiment versus treat and extend anti-VEGF plus navigated focal laser therapy. At 2 years the study found no significant difference between anti-VEGF alone vs. navigated laser plus anti-VEGF in terms of VA gain, central retinal thickness loss, or in the number of injections needed.60
19
In summary novel laser technologies may provide potential benefits for the patients, but these have to be confirmed in randomized clinical trials.
3.2 Optical Coherence Tomography
Optical coherence tomography (OCT) is a novel and emerging imaging modality in medicine, and in its short existence of roughly 30 years became a major diagnostic tool in everyday clinical life especially in ophthalmology. The basic functionality of OCT is somewhat similar to ultrasound, but instead of sound it uses light to penetrate and backscatter from biologic tissues. It does not possess the high penetrance of ultrasound, but has a much higher resolution than that. Although OCT had a slow start, and the first commercial instruments were difficult to use and were not widely used and accepted, as soon as more practicable instruments were presented they became widely popular in the field of ophthalmology.61 Today OCT is among the most commonly performed ocular examination, and became standard of care in the diagnosis and management of retinal diseases. The fact that it is noninvasive, quick, and extremely reproducible it became the ideal diagnostic tool to monitor patients treated with intravitreal injections, where controls are frequently necessary, and treatment decisions have to be made based on only slight changes. Further developments of OCT technology such as OCT angiography (OCTA) promise to aid an even broader spectrum of clinical decisions with valuable information.
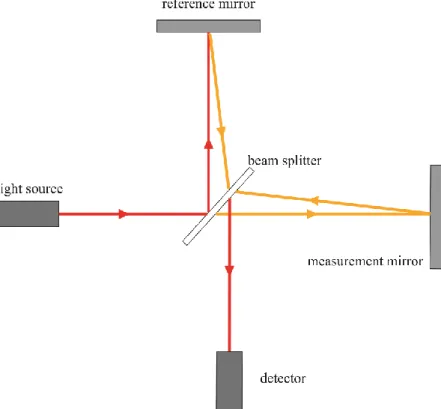
The physical background of optical coherence tomography, low-coherent of white light interferometry was first described by Sir Isaac Newton. The fist instrument that used interferometry to measure distance was constructed by Michelson who used it to measure the diameter of stars in 1921.62 A schematic drawing and description of a Michelson interferometer is shown in Figure 4. In 1988 Fercher et al. reported the first biological (and ophthalmological) use of interferometry, when they used it to measured axial length of eyes.63 This sort of interferometry is still used, and became standard of care in modern cataract surgery for measuring axial length for calculating intraocular lens power preoperatively.
20
Figure 4.: Schematic drawing of a Michelson interferometer. A light source emits a low coherent light passes through a beam splitter (half-silvered mirror). One light beam is projected on a mirror at a known distance (reference arm). The other beam is measured at the test object with unknown distance. Both reflected beams pass through the beam splitter again and the created interference is captured by a detector. (Authors own image)
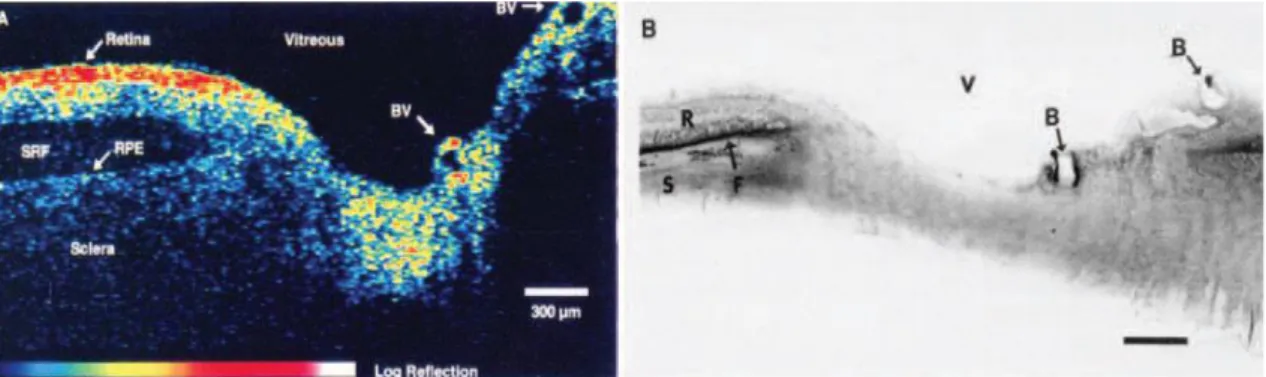
The first ever OCT image was published in 1991 by Huang et al.64 These early images demonstrated that OCT image although not completely identical, showed very high resemblance to histological sections (Figure 5). The development of OCT technology progressed rapidly, the first in vivo images were published by Fercher and Swanson in 1993, and the first commercially available OCT device was introduced in 1996 by Carl Zeiss Meditec.65,66 Although the first two generations of OCT devices, the OCT1 and OCT2 sold only a few hundred pieces, the introduction of the StratusOCT in 2001 with its enhanced handling and faster scanning times brought a breakthrough in OCT technology.61 In Hungary a fair amount of publications were published with early experience with OCT technology.67–69
21
Figure 5.: Right: The first ever OCT image published by James Fujimoto’s lab at the Massachusetts Institute of Technology of an ex vivo human retina and optic nerve head.
The axial resolution of the scan is 15 μm. Left: the corresponding histologic image.64
The most important parameters in OCT imaging are: axial image resolution to enable the detailed visualization of retinal layer architecture. Axial resolution is determined by the wavelength and bandwidth of the light source. Transverse resolution is determined by the spot size of the focused light beam. The smaller spot size (larger numerical aperture) the finer the transverse resolution will be. On the other hand the smaller the spot size is the lesser the depth of field will be. In ocular media transverse resolution is mainly limited by optical aberrations of the eye. The advent of adaptive optics technologies will help overcome these limitations.70 Data acquisition time is also an important factor, and is something that developed rapidly in the last decade with the introduction of Fourier domain detection, high speed detectors and swept light sources. Detection sensitivity determines the ease to capture a good-quality OCT scan and together with penetration depth is dependent on the wavelength of the light source, but also have an inverse relationship with acquisition speed.
3.2.1 Time-Domain OCT technology
The first three generations of OCTs were based on time-domain detection (TD-OCT) technology. In order to map the depth of different reflexes from the detector this technology uses a moving mirror in the reference arm of the interferometer. This moving mirror moves between its endpoints once for every A-scan performed (Figure 6). As light source a super luminescent diode (SLD) with a wavelength near 800 nm with a bandwidth of ca 30 nm was employed and reached an axial resolution of around 10-15 microns. This
22
axial resolution was enough to image most of the retinal layers, but the outermost retinal layers and the retinal pigment epithelium (RPE) were only displayed as a single hyperreflective band (Figure 7.). Research instruments with broad bandwidth titanium- sapphire laser were able to achieve approximately 3 µm axial resolution.71,72 The main limitation of TD-OCT technology was acquisition speed. The StratusOCT the fastest commercially available TD-OCT had 400 A-scans per second acquisition speed.61 Although this was enough to capture detailed images of the macula it was prone to image artefacts due to eye movements that would limit interpretation. Furthermore due to the slow acquisition speed it could only perform line scans, and radial patterns scans. Retinal thickness measurements that were introduced to aid clinical decision making relied on the segmentation of the innermost border of the retina the vitreoretinal interface, and the outermost part of the retina the inner border of the hyperreflective RPE band. Since large areas of the retina were not scanned between the radial scans these thickness values were interpolated. Thus segmentation errors in one of the line scans would affect a large area of the macular thickness profile. 73
23
Figure 6.: Schematic drawing of a time domain optical coherence tomography. (TD- OCT) The reference mirror moves back to forth at every A-scan captured. Once an A- scan was captured the scanning mirror moves to the next retinal location to capture the next A-scan. (Authors own figure)
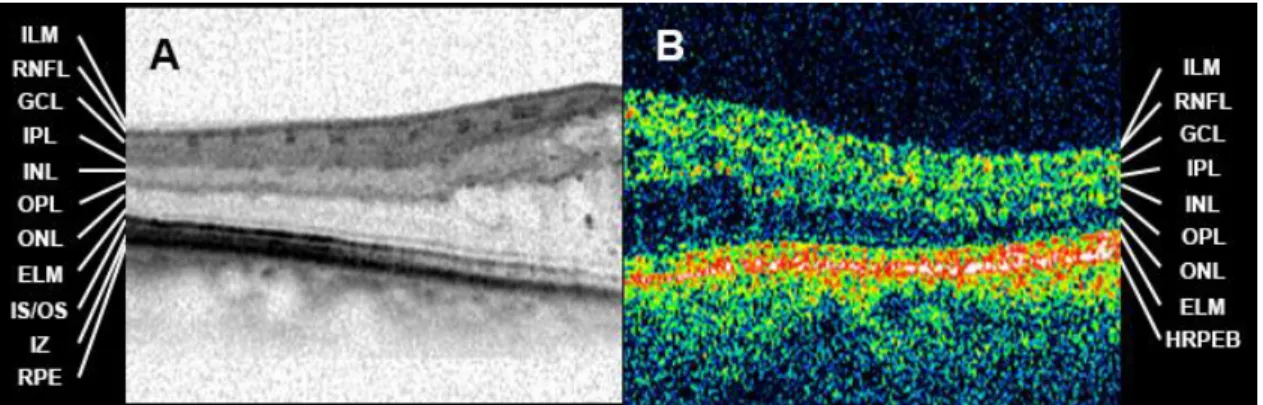
Figure 7.: Layers of the retina. A) Image captured with an SD-OCT device. B) Image captured with a TD-OCT device. ILM: internal limiting membrane, RNFL: retinal nerve fiber layer, GCL: ganglion cell layer, IPL: inner plexiform layer, INL: inner nuclear layer, OPL: outer plexiform layer, ONL: outer nuclear layer, ELM: external limiting membrane, IS/OS: inner segment / outer segment junction, IZ: interdigitation zone, RPE: retinal pigment epithelium, HRPEB: hyperreflective RPE band. (Authors own figure)
3.2.2 Spectral-Domain OCT Technology
In conclusion the greatest drawback of TD-OCT technology was slow acquisition speed.
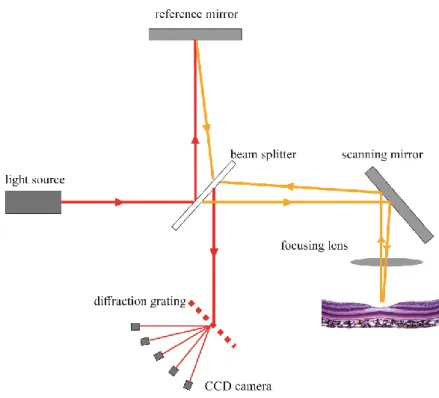
The answer to that came when a mathematical formula the Fourier transformation was applied in OCT technology. Instead of measuring optical echo signals sequentially as in time domain detection, Fourier/spectral domain OCT measure the entire optical echo signal simultaneously by using a spectrometer and a high-speed charge-coupled device (CCD) camera to detect interferometric information for the depth-resolved reflectivity profile (Figure 8.).
24
Figure 8.: Schematic drawing of an SD-OCT device. In comparison to TD-OCT (Figure 6) the mirror in the reference arm is stationary. The reflected beam of the measurement and reference arm reaches the CCD camera through a diffraction grating. (Authors own figure)
Since a constantly moving reference mirror is not necessary, image acquisition is faster, and only limited by the speed of the CCD camera. Thus commercially available SD-OCT devices can achieve acquisition speeds ranging from 20 000 to 100 000 A-scan per second. Increased speed has many advantages, first of all much more B-scans can be captured in the same time period as with TD-OCTs, thus new volumetric scan patterns imaging the complete macular or even the complete posterior pole became feasible.
Motion artefacts can still occur between individual B-scans, but not within B-scans, and this decreases the chances of false or missed diagnosis due to artefacts.74 This enables more precise thickness measurement as well. Secondly, higher acquisition speed together with advanced eye motion tracking technologies enable the capturing of multiple B-scans at the exact same retinal location. This on one hand makes image averaging to enhance signal-to-noise ration possible, and on the other hand enables the comparison of B-scans repeated within a fraction of time, and extraction of pixels with changes in reflectance or phase change between the two scans. This technology is called OCT angiography (OCTA) and is detailed later in section 3.2.4. The third advantage of higher acquisition
25
speed is that even with more B-scans to be taken the examination is still shorter than with TD-OCT, thus making the examination easier for both the patient and the examiner.
Of course there are also drawbacks of SD-OCT technology. The greatest drawback is the reduced depth measurement range. In SD-OCT technology the number of axial pixels in an A-scan is limited by the number of pixels in the CCD camera of the device. Fourier transformations halves the number of the axial pixels, meaning that there is a tradeoff between axial resolution and depth range. Due to limitations in current spectrometer resolution and pixel crosstalk effect in CCD cameras there is also a significant loss of sensitivity with increasing depth range. Post-processing algorithms can help reduce this, but depth range remains still an issue with SD-OCT technology.75
3.2.3 Swept-source optical coherence tomography
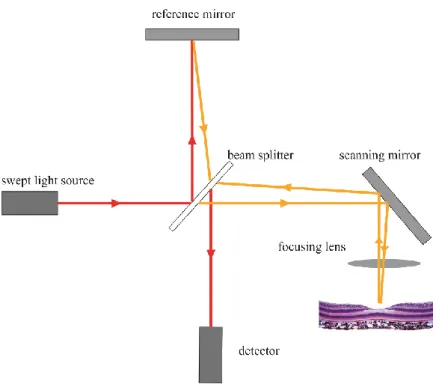
Swept-source OCT (SS-OCT) takes another approach to Fourier transformation. Instead of using a broad spectrum SLD light source and using a spectrometer to extract spectral information, SS-OCTs use a tunable laser light source with a narrow band that sweeps over the optical bandwidth and interferometric information is detected by a single photodetector.76 This eliminates the speed limit that SD-OCTs have with currently available CCD technologies, and results in a much simpler system setup (Figure 9). Thus SS-OCT systems can achieve even higher acquisition speeds than SD-OCTs with commercial devices already in the 200 000 A-scans per second range, and research devices in the MHz range.77 Higher speeds allow for even higher quality and even wider fields of view than before. Furthermore most SS-OCT devices use 1050 nm wavelength lasers. Compared to the most commonly used 800-820 nm used in SD-OCT SLDs this wavelength penetrates better and is less attenuated by optical opacities or the RPE, and has an enhanced depth range. As a downside axial resolution is somewhat less than what is achievable with 800 nm SD-OCTs. Another more practical downside of SS-OCTs is that their light sources are currently extremely costly, and their life span is limited.
26
Figure 9.: Schematic drawing of a swept-source OCT device. The light source here is a laser sweeping through the optical bandwidth with extremely high speed. This eliminates the need of a spectrometer, and a single photometer is used as a detector. (Authors own figure)
3.2.4 OCT angiography
One of the most exciting new innovation in OCT technology was the introduction of OCT angiography.78,79 On the basis of SD and SS-OCT technology OCTA enables the indirect visualization of retinal and choroidal vessels, and that in a non-invasive and three dimensional way. As briefly mentioned earlier in OCTA two OCT B-scans are taken from the same exact retinal location with only a few millisecond delay in-between. The only movement to be expected in the retinal tissue in this short time period is the flow of blood cells within retinal (and choroidal) vessels. The two most commonly used method to visualize flow are amplitude decorrelation and phase variance detection.78,79 In the former, the amplitude change between subsequent B-scans is analysed, in phase variance the change in the phase of the light reflected from moving objects in respect to the emitting light source are analysed in the repeated B-scans. Proprietary algorithms developed by different OCT companies are based on these two methods.
On OCTA flow information is usually presented by highlighting pixels where movement i.e. flow was detected. The main advantage of OCTA over conventional fluorescein
27
angiography (FA) is that the flow information on OCTA is 3 dimensional and with appropriate layer segmentation the different vascular plexuses of the retina such as the superficial, middle and deep capillary plexus can be separated and presented individually in a 2D en-face projection image that is very similar to the images ophthalmologist are used to when examining FA images (Figure 10). These deeper plexuses are not visible on FA, so with OCTA new information can be gathered about the retinal circulation.80–82 Another major difference between FA on OCTA that since no dye is used, there is no dye leakage to be seen. This has the advantage, that there is no masking effect from the leakage, but on the other hand the source of fluid accumulation cannot be so easily detected as in FA. This information can be indirectly gathered by analysing the normal reflectance OCT images, but there is still a lot to learn about the correct interpretation of OCTA images.
OCTA is a very promising modality as it is quick to perform, non-invasive, and as such repeating examination frequently is less burden to the patients as conventional FA.
Unfortunately, current OCTA technology is very prone to artefacts and this limits the interpretation of the images greatly. The most commonly seen artefacts are motion, shadowing and projection artefacts (Figure 10). Although all OCTA devices are equipped with an eye tracking hardware or software algorithm, bulk eye movement can still present in motion artefacts. They increase background noise and reduce the signal to noise ratio necessary to detect flow. Shadowing is also a known artefact in SD- and SS-OCT technology. If a lesion in the inner layers of the retina has a very high reflectivity the light that passes through it will not be enough to reflect the signal of layers beneath this object back to the detector. This will result in a darker appearing area (shadow) beneath the reflective lesion. In OCTA even a minor shadowing –where reflectance information of the outer layers can still be gathered- can reduce the signal enough that no flow information can be extracted. Such a lack of flow information can be mistaken for real lack of flow. The most dreaded and most commonly misinterpreted artefacts are projection artefacts. Since retinal vessels cast shadows to the deeper layers (especially the highly reflective RPE layer) the flow movements in the retinal vessels will cause the same amplitude and phase changes in their shadows, and will be picked up by the algorithms as flow in the deeper layers. Thus flow information of the superficial layers will be projected to the deeper layers. There are numerous software algorithms currently used to
28
reduce projection artefacts. Simpler options are to simply subtract flow information of the inner layers form outer layers. This comes with a loss of information of the flow in the outer layers. More sophisticated algorithms are being developed and show promising results in making OCTA images more easily interpretable.83,84
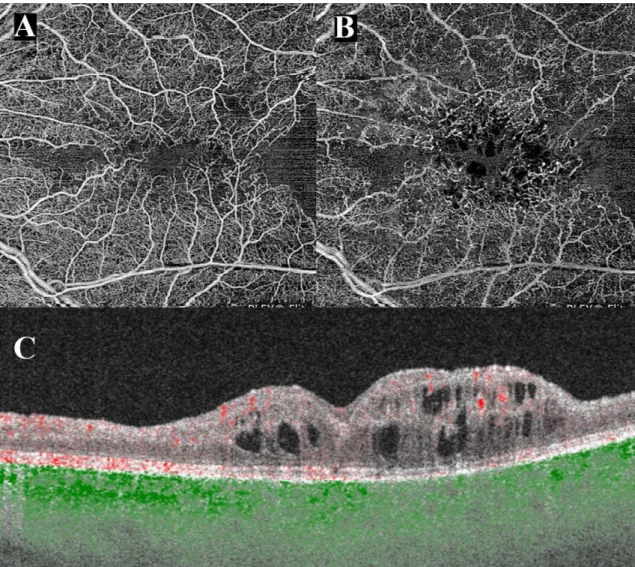
Figure 10.: OCT angiography of a patient with central retinal vein occlusion captured with an SS-OCTA system. A) En-face projection of the superficial capillary plexus. The foveal avascular zone is irregular, the perifoveal capillaries are dilated and intercapillary spaces are widened. Nasal and temporal to the fovea confluent areas without flow i.e.
ischemic areas. B) En-face projection of the deep capillary plexus, the perifoveal capillary bed is severely damaged, the ischemic areas seen in the superficial plexus are even more pronounced. Dark round areas in the center represent cystic spaces. Large and medium vessels seen in A) are projected to the deeper layer. C) B-scan through the foveal center cystoid macular edema with disorganisation of the inner layers in the center, and marked thinning and loss of inner retinal layers nasally and temporally. Red dots represent flow in the retina, green dots represent flow in the choroid. (Authors own figure)
29 3.3 Diabetic retinal changes
3.3.1 Diabetes mellitus
Diabetes mellitus (DM) is a heterogenic group of metabolic diseases affecting the body’s carbohydrate, fat and protein metabolism.85 There are two main forms of diabetes. Type 1 is characterized by the cellular mediated autoimmune inflammation and destruction of the insulin secreting β-cells of the pancreas. This form was formally known as juvenile- onset DM or insulin-dependent DM as in most of the cases (although by far not in all cases) the disease develops in younger patients, and they need insulin substitution for survival. Type 1 DM constitutes 5-10% of all diabetes cases.85 Type 2 DM is a group of diseases characterized by either increased insulin resistance or an insulin secretory defect combined with some degree of insulin resistance. In the past type 2 DM was referred to as noninsulin-dependent DM, as patient do not need insulin to survive, but still many patients with type 2 DM will need to take insulin to achieve good glycemic control.
Obesity is a major risk factor for type 2 DM as it increases insulin resistance. Type 2 DM is by far the more common disease as it comprises 90-95% of all diabetes cases. 85 A calculation based on epidemiological studies from 91 countries estimated a 6,4%
prevalence of diabetes mellitus worldwide affecting 285 million adults in 2010. They predicted an increase of prevalence to 7,7% (affecting 439 million adults) by 2030, where the increase in prevalence in the developing countries will be 69% and in the developed countries around 20% in this time period.86 In the USA according to the 2017 report of the Centers for Disease Control and Prevention 9,4% of American adults (30,2 million) are affected with DM and an additional 79 million have impaired fasting blood glucose levels.87
In summary the number of patients with diabetes is constantly and rapidly rising with the population growth of developing countries and the aging of western countries.88 Health care systems must prepare for the management of these patients especially their late sequelae like diabetic retinopathy.
30 3.3.2 Diabetic retinopathy
Diabetic retinopathy (DR) is the most common ocular sequelae of diabetes mellitus, and one of the leading causes of blindness in the working age population worldwide.89–94 The prevalence of diabetic retinopathy worldwide is estimated to affect around 93 million adults and vision threatening diabetic retinopathy worldwide is estimated to affect around 28 million adults with around 50% of these patients coming from the Asia-Pacific region.95,96
The most important risk factor for the development of diabetic retinopathy is duration of diabetes. In the Wisconsin Epidemiologic Study found that the after 5, 10 and 15 years of type 1 diabetes 25%, 60% and 80% of patient will develop diabetic retinopathy respectively.97,98 In type 2 diabetes depending whether the patients required insulin to manage their diabetes 24% or 40% (no insulin, with insulin respectively) developed DR after 5 years, and 53% or 84% (no insulin, with insulin respectively) developed DR after 19 years of DM duration.97 A study of 1433 young patient with DM showed, that diabetic retinopathy is more common and usually more severe in patients with type 1 DM than in type 2 DM (20% vs 4% respectively). In real life since there are much more patients with type 2 diabetes, most of the patients seen in the clinics with ocular complications are in fact type 2 DM patients.99 A recent study conducted in Hungary in 50 years and older population showed that the prevalence of DM was 20%, and in the patients with DM the prevalence of DR and/or diabetic maculopathy was 20.7%.100
Regarding modifiable risk factors blood sugar, blood pressure and blood lipid levels seem to be the most important. The importance of glycemic control in the development of DR and especially on the severity of DR after development have been confirmed in multiple studies, and although blood pressure and blood lipid control is beneficial in diabetes mellitus its impact on diabetic retinopathy is still to be confirmed.101–104
The most commonly accepted theory is that diabetic retinopathy is a microangiopathy caused by the hyperglycemia induced cellular changes in retinal capillaries leading to the formation of capillary occlusions and microaneurysms.105,106 There is growing evidence that parallel to these vascular changes, or even proceeding these there is a neurovascular component as well.36,107,108
31
Clinically diabetic retinopathy can be divided into two stages. Nonproliferative diabetic retinopathy (NPDR) is characterized by microaneurysms, intraretinal hemorrhages, venous dilatations and in later stages cotton wool spots, hard exudates, venous beading and intraretinal microvascular abnormalities (IRMA) (Figure 11).109
Figure 11.: Wide-field fundus photography (CF) and fluorescein angiogram (FA) of a patient with moderate nonproliferative diabetic retinopathy (NPDR). CF shows numerous microaneurysms in the posterior pole and outside the vessel arcades, as well a multiple cotton wool spots and intraretinal hemorrhages. Signs of severe NPDR such as extensive intraretinal hemorrhages in 4 quadrants, venous beading in 2 or more quadrants or prominent intraretinal microvascular abnormalities (IRMA) are not seen. FA shows the extensive amount of microaneurysms and focal areas of capillary nonperfusions.
Diabetic retinopathy progresses gradually with the increasing amount of retinal capillary occlusion. These occlusions promote the expression of various cytokines among them the most important VEGF. VEGF induces to vascular remodeling seen in the form of shunt capillary formations (i.e. IRMA), increased vascular permeability (i.e. diabetic macular edema formation), and the formation of new vessels either on the inner surface of the retina or in more severe cases in the anterior segment. Such neovascularization either on the optic nerve head, around retinal vessels or on the iris are the leading signs of a proliferative diabetic retinopathy (PDR) (Figure 12)
32
Figure 12.: Wide-field fundus photography (CF) and fluorescein angiogram (FA) of a patient with proliferative diabetic retinopathy (PDR). Neovascularizations elsewhere (NVE) are readily seen on CF as well as preretinal and intravitreal hemorrhages. The middle periphery is covered with pigmented panretinal photocoagulation (PRP) scars.
Late phase FA shows even more leaking NVEs as well as ischemic areas already covered by the PRP. The macular area shows diffuse and focal leakage.
3.3.3 Diabetic macular edema
Diabetic macular edema is sequel of diabetic retinopathy, and can develop both in NPDR as well as PDR stages. It is characterized by the increased inflow of fluid, proteins and lipids from the retinal vasculature -due to increased vascular permeability- into the extracellular space of the retina. This causes thickening of the retina, formation of intraretinal cystoid spaces, subretinal fluid accumulation, and the formation of hard exudates (Figure 13). Although retinal thickening does not directly correlate to visual acuity it is still the main cause of visual impairment in patients with diabetic retinopathy.90,110
Before the advent of OCT technology, DME was detected based on fundus examination (or fundus photography in clinical trials) aided by fluorescein angiography. The ETDRS study divided DME into clinically significant macular edema (CSME) and non-CSME based on the location and extent of the retinal thickening and hard exudates on fundus exam or fundus photography. OCT made the detection and quantification much simpler, and it made possible to detect DME before it causes obvious clinical sings or functional
33
symptoms. Randomized clinical trials (RCTs) in the OCT era usually define DME using central subfield thickness, and the presence of fluid compartments on OCT (Figure 13).
Figure 13: Infrared image with retinal thickness heat map and OCT image of a patient with center involving DME. On the heat map warmer colours represent thicker retina.
OCT shows intraretinal cystic spaces in the outer and inner nuclear layers (ONL and INL), subretinal fluid accumulation under the fovea, multiple hyperreflective foci at the apical border of the ONL, and an incomplete posterior vitreous detachment. (Authors own figure)
34
4 Purpose
Although in indications such as diabetic macular edema novel therapeutic approaches became the standard of care grid and focal laser therapies can still have their value in the armamentarium of therapies.31–33,42,111–114 In other indications like proliferative diabetic retinopathy retinal photocoagulation is still the preferred way of treatment due to its long lasting effect.35,36,115 Although the timely execution of laser therapy can save the patient from profound visual loss due to vitreous hemorrhage or tractional retinal detachment, it is well known, that panretinal laser photocoagulation has a number of side effects such as peripheral visual field loss, night blindness or central visual decrease.36,116 These side effects can have a major impact on the quality of life of patients with PDR, since many of these patients are still in the working age group, whose daily job and living might depend on their eyesight.
Novel developments in laser technology showed promising results in animal models in reducing collateral damage when performing laser therapy.13,45 It is a well-known feature that laser scars grow with time, and cover larger and larger areas of the peripheral retina further reducing the already impaired peripheral retinal function. Furthermore animal model studies confirmed, that laser burns applied with standard laser pulse durations cause disruption of the RNFL causing further functional loss.13,44 It is imperative for the wellbeing of our patients to develop and apply the most beneficial therapeutic approach with the least amount of collateral damage.
The aims of our research were the following:
1. examine the in vivo effects of a short duration continuous thermal laser onto the human peripheral retina using optical coherence tomography
2. examine the longitudinal healing process of laser burns, and quantify laser scar size changes over time
3. examine the immediate in vivo morphologic changes after macular grid photocoagulation using a short duration continuous thermal laser 4. examine the immediate and long term in vivo effects of non-visible sub-
threshold laser burns applied by a short duration continuous thermal laser on retinal morphology
35
5. to describe a novel potential biomarker seen in patients with diabetic macular edema, and observe in vivo its behavior in respect to changes in macular thickness after macular photocoagulation.
36
5 Methods
To answer the clinical questions described in the purpose section we performed four separate studies. In the following section we present the methods used in each of these studies separately.
All four studies were conducted at the Department of Ophthalmology at the Medical University of Vienna. The protocol followed the tenets of the Declaration of Helsinki and was registered at www.clinicaltrials.gov (NCT00682240) as well as approved by the responsible ethics committee of the Vienna University. In a personal interview, the interventional study design, investigations for scientific purposes, and imaging procedures were explained in detail to each patient before obtaining informed consent.
5.1 In vivo examination of retinal changes following panretinal photocoagulation
5.1.1 Patients
Ten consecutive patients (9 men, 1 woman) assigned to PRP due to proliferative diabetic retinopathy were enrolled in a prospective, interventional, and open-labelled trial.
5.1.2 Examination and documentation
Before laser treatment, each patient underwent a complete baseline evaluation, including slit-lamp examination, ophthalmoscopy, visual acuity testing, fluorescein angiography, fundus photography, and SDOCT imaging. Follow-up visits were performed at 1 day and 1 week after PRP, and at monthly intervals thereafter until month 6. The standardized examination procedures were repeated according to protocol at each follow-up visit, except fluorescein angiography, which was performed every 3 months.
5.1.3 Retinal Photocoagulation
A photocoagulator offering a fully integrated pattern scan laser system designed to treat retinal diseases using a single spot or a predetermined pattern array of up to 56 spots was used (PASCAL Pattern Scan Laser, OptiMedica Corporation, Santa Clara, CA).117 This
37
laser instrument is capable of delivering high laser powers during short laser exposure times (10-20 ms) achieving similar fluences as conventional laser settings. This faster laser application allows that a large number of identical spots can be applied by a single foot-pedal depression, which allows for constant treatment parameters to be maintained during the entire laser procedure at each spot location. For spot size uniformity and precise spot placement, identical and reproducible laser power settings were needed to obtain reproducible morphologic effects at all spot locations. Photocoagulation was performed via irradiation with a frequency doubled neodymium: yttrium-aluminium- garnet (Nd:YAG) laser diode with a 532-nm wavelength.
Before the laser procedure, pupillary dilatation was induced by the topical application of 1% tropicamide (Mydriaticum “Agepha”) and 2.5% phenylephrine hydrochloride eye drops. Topical oxybuprocaine 1% (manufactured by the institutional pharmacy) was instilled immediately before treatment initiation. Carefully maintaining a safe distance from the optic disc of 1 disc diameter, a sufficient number of laser burns were applied, to cover the retinal periphery beyond the limits of the upper and lower arcades as close to the pars plana as possible.118 A 20-msec burn duration and a 200 μm diameter laser spot size were chosen as standard laser settings.44 An Ocular Mainster wide-field contact lens (magnification 1.5; Ocular Instruments, Bellevue, WA) was used to focus the laser beam on the retina, magnifying the 200 μm diameter laser spot to approximately 300 μm on the retinal plane. The laser power (mean, 588 mW; min, 300; max, 1025) was determined based on ophthalmoscopic visibility of the treatment spot and adjusted until a distinct grey spot was observed clinically.
5.1.4 Retinal Imaging Using Spectral Domain-Optical Coherence Tomography A novel generation SD-OCT was used (Spectralis, Heidelberg Engineering GmbH, Heidelberg, Germany), combining high-resolution OCT and fluorescein angiography in one instrument, which was useful in our diabetic study population where both diagnostic procedures had to be performed. The instrument enables 40.000 A-scans per second. A super luminescence diode implemented as the light source in the system radiates an 870- nm laser beam, which confers improved light penetrating properties to the system compared with other systems and provides an axial resolution of 7 μm and a transverse resolution of 14 μm. Such optimized image quality was needed for precise identification
38
of the tissue effects at the level of individual retinal layers and for distinct delineation of the thermal damage zone. Another technologic feature relevant to the study purpose and superior to other OCT devices is the specific image alignment technique of this device for locating, tracking, and constantly aligning retinal locations. Tracking laser tomography (TruTrack) enables real-time, simultaneous imaging while tracking eye movements. Utilizing this image alignment software, the instrument continuously monitors the position of the eye using a beam of light. The tracking system enables the scanning of the same exact b-scan multiple times and averaging the images further increasing signal to noise ratio. Additionally it allows for the identification of the same retinal location throughout each follow-up visit for a precise evaluation of progressive changes during the healing response. To reproducibly identify an image location, an area closely adjacent to the upper or lower vascular arcades, which was identified by the image tracking system, was selected. This location was close to the posterior pole and provided a consistent central retinal anatomic structure.
5.2 In vivo examination of retinal changes following macular grid and focal photocoagulation
5.2.1 Patients
Thirteen consecutive patients (9 men, 4 women; mean age 58±10 years) with diabetic maculopathy showing generalized clinically significant macular edema associated with diabetes mellitus type 2 were included in the study. All patients were treatment naïve or had not received any treatment for DME at least 3 months before inclusion.
5.2.2 Examination and documentation
Color fundus photography and SD-OCT examinations for imaging structural and biometric retinal changes secondary to macular grid laser treatment with time and biomicroscopy were performed at baseline and day 1. In addition, patients were examined using a standardized protocol (ETDRS) for the assessment of best-corrected visual acuity and by fluorescein angiography at baseline.