S O M E P R O P O S A L S F O R A P O S S I B L E , E F F I C I E N T R E G I O N A L E M P L O Y M E N T P O L I C Y
KATALIN LIPTÁK1
University of Miskolc (Hungary)
ABSTRACT
7KLVVWXG\FRQVLVWVRIWKUHHPDLQWKHPHV$QRYHUYLHZLVJLYHQDERXWWKHPDLQ¿QGLQJVRIWKHHFRQRPLFWKHRULHVDVVRFLDWHGZLWK employment and labour / paid work; reinterpretation of the concept of labour is also provided, divided into pre-industrial, industrial and post-industrial periods, which the author aligns with the periods of the economic thought. The author interprets globalization DVDIDFWRULQÀXHQFLQJWKHWUDQVLWLRQEHWZHHQLQGXVWULDODQGSRVWLQGXVWULDOSHULRGVDQGVKHHODERUDWHO\LQWURGXFHVLWVHFRQRPLF social and labour market impacts. Among the potential alternatives of employment of the future, this thesis investigates the atypical forms of employment, public employment and social (solidarity) economy. (2) Central-Eastern European countries and regions are analyzed, as the territorial unit of the research, from labour market and employment aspects. Afterwards, the author evaluates the employment situation of her closer environment, Northern Hungary. (3) Afterwards, she contributes suggestions to the criteria of FUHDWLQJDPRUHHI¿FLHQWUHJLRQDOHPSOR\PHQWSROLF\7KHDLPRIWKLVUHVHDUFKZDVDQDO\VHGWKHUHJLRQDOODERXUPDUNHWVLWXDWLRQE\
the Central-Eastern European countries and regions, in particular by the North Hungarian region and was gave some proposals for a SRVVLEOHHI¿FLHQWUHJLRQDOHPSOR\PHQWSROLF\7KHUHIRUHWKURXJKWKHPXOWLSOHWUDQVIRUPDWLRQRIZRUNFRQFHSWWKHGHPDQGIRUDO- WHUQDWLYHHPSOR\PHQWIRUPVKDVLQFUHDVHGDORQJZLWKWKHVLJQL¿FDQWFKDQJHRIWKHFRQWHQW7KHDXWKRUEHOLHYHVWKDWWKHVHDOWHUQDWLYH
¿HOGVDQGWKHUHJLRQDOHPSOR\PHQWSROLF\FDQSURYLGHWKHDQVZHUIRUJOREDOODERXUPDUNHWSUREOHPVLQWKHIXWXUH$WWKHEHJLQQLQJ RIKHUUHVHDUFKVKHK\SRWKHVLVHGWKDWWKHSRVLWLRQRIWKH1RUWK+XQJDULDQUHJLRQLVVLJQL¿FDQWO\GHWHUPLQHGE\LWVVSHFLDOHFRQRPLF and social context which can be derived from the end of communism. The author used Hoover-index, tested the Okun’s law in Central-Eastern European countries and regions, calculated the Markov-chain model and used factor analysis methods.
KEYWORDS:globalization, regional employment, labour market.
JEL CODES: J64, R10, R58
I n t r o d u c t i o n
$FFRUGLQJWRWKHDXWKRU¶VRSLQLRQWKHODERXUPDUNHWLQ&HQWUDO(DVWHUQ(XURSHKDVQRWHI¿FLHQWDQGKDV a lot of problem factors which could be solved using a regional employment policy. The author assumes that globalization and its regional and local impacts have an important role in nowadays’ economics. Paradoxi- FDOO\FKDOOHQJHVDULVLQJIURPWKHXQL¿FDWLRQRIWKHZRUOGKDYHPDGHWKHQHFHVVLW\IRUUHJLRQDODQGORFDO answers stronger. The idea of an economy strengthening social inclusion and representing more solidarity increasingly appears in the concept of sustainable development. The transformation of the labour market calls for the revaluation of the notion of labour; it puts the issue of employment in another perspective. The solution for globally existing lack of employment is more and more frequently sought focusing on sustain- ability and social inclusion at regional and local levels. The following questions arise:
1. What are those global impacts that underpin the transformation of labour markets?
2. How does this transformation take place?
1 .DWDOLQ/LSWiNí8QLYHUVLW\RI0LVNROF)DFXOW\RI(FRQRPLFV'HSDUWPHQWRI/DERXUDQG6RFLDO(FRQRPLFV3K'DVVLVWDQW lecturer
E-mail: liptak.katalin@uni-miskolc.hu
3. What regional differences occur in the appearance of the challenges?
4. To what extent and how do they affect the economic and social processes of Northern Hungary?
This research focuses on the temporal and spatial regularities of the level and structure of employment, its interactions with the processes of globalization and the employment strategies seeking solution to the problems in the regions of Central-Eastern Europe and Hungary, with special attention to Northern Hungary.
1 . L a b o u r- p a r a d i g m s h i f t s i n e c o n o m i c t h e o r i e s
The purpose of the theoretical overview is to draw a complex picture of the development of the em- SOR\PHQWUHODWHGHOHPHQWVRIWKHHFRQRPLFVFKRROVRIWKRXJKWWKHPDLQLGHDVDQGWKRXJKWVRIWKHVSHFL¿F VFKRROVDQGWKHLUPRVWVLJQL¿FDQWUHSUHVHQWDWLYHVWKHLUFRUHHOHPHQWDQGIDFWXDOVWDWHPHQWVDQGDWWKHVDPH time, the change of the labour concept. The author of this thesis has reviewed the following economic peri- ods and labour-related theories.
1.1. Concept of work in pre-industrial societies
In prehistoric times people worked irregularly, 3 to 4 hours a day, necessary for their means of subsist- ence. Decent work at that time covered the range of useful social activities done voluntarily in and for the community. Ancient philosopher Aristotle posed the question as to what the essence of happiness was and what can be regarded as work. He argued that the essence of happiness was the actual work of man. “The VSHFL¿FZRUNRIPDQLVQRWKLQJGLIIHUHQWIURPWKHVHQVLEOH±RUDWOHDVWQRWLQVHQVLEOH±DFWLYLW\RIVRXO´
(Aristotle, 1997: 19).
In ancient societies social status was not determined by work, that had no value. Goods come from ownership and not from work. Ancient philosophers (Plato and Aristotle) also claimed that citizens did not have to work, there was a distinct social stratus for that purpose. Work gained a double interpretation: on the one hand, classical work was what slaves did and, on the other hand, it was also a work what citizens did as intellectual activity (Aristotle, 1997: 25).
At the same time, one should not forget about the world of medieval guilds: assistants and workers workingWKHUHDOVRDFWHGLQDVSHFL¿FIRUPRISDLGZRUN6HZHOOFDOOVWKLVSHULRG³FRUSRULVWZRUOGRUGHU´WKDW determines the process-technical organization of production as the social organization of work. This world order regards craft as community property that provides employment only to the members of the community (Castel, 1998: 102).
,QPHGLHYDOWLPHWKHYDOXHRIZRUNZDVWRWDOO\LQVLJQL¿FDQWLWZDVDOPRVWFODVVL¿HGLQWRWKHJURXSRI obligatory bad; however, at the same time, Calvin put forth another interpretation of labour, at the end of the
³GDUN0LGGOH$JH´DFFRUGLQJWRZKLFKHYHU\IRUPRIGRLQJZRUNPHDQWVHUYLQJ*RG
1.2. Labour concept of the industrial societies
:LOOLDP3HWW\íOLYLQJLQWKHth century put forth view different from the mainstream ap- proach of the mercantilist era; he suggested that land and labour are regarded as the source of wealth. Petty LVFRQVLGHUHGWREHWKH¿UVWFUHDWRURIWKHODERXUWKHRU\RIYDOXHKHDUJXHGWKDWRQO\VSHFL¿FW\SHVRIODERXU can be seen as value creating work, such as that producing precious metal serving as the raw material of money (Mátyás, 1969: 44).
&ODVVLFDOHFRQRPLVH$GDP6PLWKíFODLPVWKDWDVRFLHW\¶VHFRQRP\GHSHQGVRQWZRIDFWRUV the proportion of population dealing with productive work and the productivity of labour determined by the division of labour. He linked the change of number of population to the amount of wage. He explains in his work: “In that early and rude state of society which precedes both the accumulation of stock and the appro-
priation of land, the proportion between the quantities of labour necessary for acquiring different objects, VHHPVWREHWKHRQO\FLUFXPVWDQFHZKLFKFDQDIIRUGDQ\UXOHIRUH[FKDQJLQJWKHPIRURQHDQRWKHU´6RPH- where he mentions that agricultural labour creates a larger value than industrial labour (Smith, 1959: 38).
'DYLG5LFDUGRíOLYHGDQGZRUNHGLQWKHSHULRGRIWKHLQGXVWULDOUHYROXWLRQDQGVWXGLHG which made it possible to study the advanced capitalist conditions. He agreed with the Smithian natural order, however individual interest appeared as a class interest in his case. His theoretical system is pervaded by class antagonism that appeared between mainly between industrialists and landowners. He traced the categories of capitalist economy he studied back to the labour theory of value (Kaldor, 1955).
7KRPDV0DOWKXVíDJUHHGZLWKWKH6PLWKLDQODERXUWKHRU\RIYDOXHKRZHYHUKHclaimed that labour cannot be regarded as the accurate and valid measure of the actual exchange value. He made dif- ference between productive and unproductive labour, in his opinion both physiocrats and Smith agreed that productive labour results in wealthiness (Malthus, 1944: 32).
The problemRIH[FKDQJHRIVDPHYDOXHUH¿QLQJWKH6PLWKLDQWKRXJKWVZDVVROYHGE\.DUO0DU[
íLQKLVERRNWLWOHG&DSLWDOE\PDNLQJGLVWLQFWLRQEHWZHHQWKHFRQFHSWVµODERXU¶DQGµODERXU force’. He emphasized the useful nature of labour: “The value of labour force, as that of any other commod- ity, is determined by the working time necessary for the production, that is also the re-production, of this special commodity... which also means that the value of labour force is the value of means of subsistence QHFHVVDU\WRPDLQWDLQLWVRZQHU´ (Zalai, 1988: 41). The Marxian concept of labour placed an emphasis on XVHYDOXHZKLFKGLGQRWDSSHDUHGLQWKHGH¿QLWLRQRIVXEVHTXHQWUHVHDUFKHUV)XUWKHUPRUHKHZURWHGRZQ that the simple moments of labour process is the expedient activity that is the labour itself, the object of labour and the means of labour. The worker worked under the control of the capitalist whom his labour belonged to an the given time. He divided the society into three parts: landowners, capitalist and worker. Ac- cording to Marx labour also becomes commodity in a completely developed capitalist system. That means, the worker markets his or her labour force and working ability the price of which is the wage; in this way VDPHYDOXHVDUHH[FKDQJHG0DU[í
Marx, in his letter written to Engels, made relatively new statements:
x he described the dual nature of labour (partly labour appearing in the value of the product and partly labour appearing in use-value) he investigated labour from both qualitative and quantita- tive perspectives;
x he considered labour force to be a commodity rather than labour;
x he investigated surplus value regardless of its forms of appearance (Mátyás, 1969: 51).
$OIUHG0DUVKDOO±DPRQJQHRFODVVLFDOHFRQRPLVWVFDPHWRWKHFRQFOXVLRQWKDWODERXUFUH- ates surplus over wages the worn-out value of work-assisting tools; however, this surplus is not given to the ZRUNHULWLVWDNHQDZD\IURPKLPíWKLVLVDSUREOHPRIVRFLDOGLVWULEXWLRQ'HDQH
-RKQ0D\QDUG.H\QHV¶íDSSURDFKFRQWUDVWHG6PLWK¶VYLHZV7KHWKHRUHPVRIWKHQHRFODV- sical theoryFRPSOHWHO\RYHUWXUQHGGXHWRWKHJOREDOHFRQRPLFFULVLVRIíWKHUHIRUHWKHGHYHORS- ment of a new economic paradigm became necessary. Many associate the notion of total employment with Keynes’ name, however, this category had appeared in the work of the neoclassical economists as well. In Keynes’ work total employment could occur only at the time of the disappearance of involuntary unemploy- ment (Zboróvári, 1988: 14). Keynes’ ideas make state intervention necessary and possible in the labour mar- ket so that the level of unemployment can be kept low. “Even Keynes does not suggest that unemployment can totally be eliminated from developing economies. Structural and frictional unemployment are necessary SURGXFWVRIKHDOWK\UHVWUXFWXULQJRIWKHHFRQRP\LQ.H\QHV¶VFKRRODVZHOO´%iQIDOY\í
Social attitudes associated with work and the lack of work began changing in the 18th century. Work was interpreted as a way to achieve wealth, whereas the lack of work was seen as the medieval conviction related to the lack of work (that is, idleness is a sin) began to be replaced by the view that the lack of work causes an economic loss to both the individual and the society. Arendt properly gave a precise account of the develop- ment of paid work. “The sudden spectacular upward career of labour, that catapults it from the lowest row, the most disdained position to a precious one, so that it becomes the top-rated human activity, began when
Locke discovered the source of all property in labour. Its triumphant advance continued when Adam Smith explicitly made it clear that labour is the source of all wealth. It reached its climax in Marx’s system where ODERXUEHFDPHWKHVRXUFHRIDOOSURGXFWLYHDFWLYLW\PRUHRYHUWKHH[SUHVVLRQRIWKHKXPDQQDWXUHRIPDQ´
(Arendt, 1958: 114).
1.3. Labour concept of the post-industrial societies
0RGHUQVRFLHWLHVDUHULJKWO\FDOOHGWKH³VRFLHW\RISDLGZRUN´KRZHYHUWKHWHUP³ODERXUVRFLHW\´DOVR appears frequently in the literature. One can read about the crisis of paid work since the 1960s, its heyday ZDVWKH¿UVWTXDUWHUFHQWXU\XSXQWLOWKH¿UVWRLOFULVLV7KHFULVLVFKDQJHZDVQRWRQO\DERXWWKHFKDQJHDQG transformation of the world of work, it was also about the atypical forms of employment becoming increas- ingly popular. Part of the society was excluded from the world of paid work after the period of industrializa- tion, it can be regarded as nowadays’ period as well. The beginning of the crisis of labour paradigm started with Arendt’s (1958) statement: “What is ahead of us is a labour society that is running out of work that is IURPWKHRQO\DFWLYLW\LWLVJRRGDW:KDWFRXOGEHPRUHWHUULEOHWKDQWKDW"´(Arendt, 1958: 54). He likens paid work to slave work and not to a voluntarily undertaken activity of free man. Gorz suggested that the socially useful activity should be placed at the centre of the society instead of paid work. Beck spoke of civic work done in favour of the community (Csoba, 2010: 58).
It can be seen that the concept of paid work is gradually loosing that of labour, which is a consider- DEOHSUREOHP7KHUHGH¿QLWLRQRISDLGZRUNLVQHFHVVDU\EHFDXVHDVLJQL¿FDQWSDUWRIWKHVRFLHW\KDVEHHQ excluded from the classical paid work. A smaller proportion of people of working age works in one of the traditional forms of employment, atypical forms of employment can be regarded as typical in the developed European countries, since they dominate.
Thesis 1: ,WLVQHFHVVDU\WRUHGH¿QHSDLGZRUNLQSRVWLQGXVWULDOLVWSHULRGHVSHFLDOO\QRZDGD\VEH- cause labour, interpreted as paid work is the privilege of a smaller social group in the transformation process DFFHOHUDWHGE\JOREDOL]DWLRQWKXVLWLVDOUHDG\QRWDSSURSULDWHWRFRPSOHWHO\IXO¿OOLWVIRUPHUVRFLDOIXQFWLRQ 2 . I n v e s t i g a t i o n o f t h e l a b o u r m a r k e t s i t u a t i o n
o f t h e C e n t r a l - E a s t e r n E u r o p e a n R e g i o n a n d N o r t h e r n H u n g a r y
The change in the mass of global labour force and the evolution of differences among continents and countries between 1991 and 2009 are illustrated by means of Hoover-index. It is one of the most widespread index to show regional disparities. “The index expresses in percentages as to how much percent of a social- economic phenomenon has to be transferred among regional units so that its regional distribution becomes WKDWRIDQRWKHUHJSRSXODWLRQ´(Péter, 2010).
2
1
¦
ni
i
i f
x
h (1)
xi and fi are distribution ratios, to which the followings apply (Nemes Nagy, 2005):
100
¦
n1 ixi 100
1
¦
ni
xi
Krugman index, analogous with Hoover index, is appropriate to compare the employment structure of two regional units, which does not divide the absolute value of the differences of the distribution by two, in this way the maximum value of the index can be 200. Its disadvantage is that the interpretation of the results obtained from it is cumbersome; Nemes Nagy et al (2005) does not recommend its application.
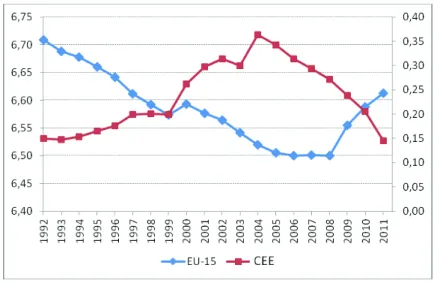
Figure 1. Evolution of Hoover index Source: Own work based on World bank data
The author has strived to explore the regional peculiarities of Central-Eastern Europe in order to make the processes taking place in Northern Hungary more understandable. Having analyzed the Hoover index values between the population and the employed in EU-15 and Central-Eastern Europe, a special develop- ment path, that is lagging behind, of Eastern Bloc can be seen well, totally opposite processes take place )LJXUH:KLOHFRPSHWLWLRQLVLQWHQVLI\LQJZLWKLQ(8PHPEHUVWDWHVWKHGLIIHUHQFHVDUHDSSDUHQWO\
decreasing in Eastern countries; however it does not mean development or convergence, it rather means a joint divergence. A question arises here whether it is caused by the impact of the change of regime or the phase lag is of different nature.
Thesis 2: Labour market competition has intensifying since the expansion of the European Union in 2004, while an apparent equalization is taking place in Central-Eastern European countries; however this equalization is not coupled with convergence it rather results in a joint divergence.
3 . E x a m i n a t i o n o f O k u n ’s L a w
The author applied Okun’s Law to explore regional differences and peculiarities. Okun’s Law suggests that every 2 % decline of GDP compared to the potential GDP entails a 1 % increase of unemployment rate.
Okun’s Law expresses the basic connection between the commodity market and labour market; it describes the connection between the short-term movements of GDP and the changes of unemployment. This sur- vey can reveal the presence of disparities in the labour market of the Central-Eastern European countries.
The slowing-down of the economy entails increasing unemployment. This negative connection is shown by Okun’s Law that was elaborated by Arthur Okun in 1960 (Boda, Scheiring, 2011: 76).
Okun’s Law is true for the countries in almost each case, except for Poland where the processes does not FRUUHVSRQGWR2NXQ¶V/DZVLQFHWKHYDOXHRIWKHFRHI¿FLHQWLVQRWUHJXODU7DEOH
Table 1.3URYLQJ2NXQ¶V/DZIRUYDULRXVFRXQWULHVí Okun’s Law Output gap
(if unemployment rate is zero)
Natural unemployment rate (if output gap is zero)
Natural unemployment rate
(is output gap is -2 %)
Czech Republic x= -1.853u + 13.328 13.328 7.193 8.272
Estonia x= -1.958u + 19.207 19.207 9.809 10.083
Latvia x= -1.740u + 20.057 20.057 11.527 12.676
Lithuania x= -1.451u + 16.646 16.646 11.472 12.850
Hungary x= -2.061u + 15.570 15.570 7.555 8.525
Poland x= -0.582u + 8.107 8.107 13.930 17.367
Slovenia x= -2.969u + 18.820 18.820 6.339 7.012
Slovakia x= -1.218u + 18.603 18.603 15.273 16.915
Source: Lipták, 2012, p. 38
7KHGHEDWHDERXWWKHYDOXHRIWKH2NXQFRHI¿FLHQWLVXQ¿QLVKHGLQWKHOLWHUDWXUH)D]HNDV2]VYDOG í:KHQ2NXQFDUULHGRXWKLV¿UVWFDOFXODWLRQIRUWKH8QLWHG6WDWHVKHDFFHSWHGWKHYDOXHRIWKHFR- HI¿FLHQWDVDURXQGíZKLFKZDVYDOLGLQWKHVDVZHOOKRZHYHULWFDQQRWEHVHHQDVJHQHUDOO\DF- FHSWHG,Q-DSDQWKHYDOXHRIWKHFRHI¿FLHQWZDVDVDUHVXOWRIWKHFDOFXODWLRQVIRUWKHperiod between DQGZKLOHLQWKH)HGHUDO5HSXEOLFRI*HUPDQ\DWWKDWWLPHLWZDV7DFKLEDQDNL6DNXUDL
±5HVHDUFKHUVDSSO\YDULRXVHFRQRPHWULFSURFHGXUHVWRDQDO\]HWKHWLPHVHULHVRIQDWXUDO unemployment rate and potential output. The calculations carried out to the same time series using different PHWKRGVSURGXFHFRHI¿FLHQWYDOXHVRIWRWDOO\GLIIHUHQWRUGHURIPDJQLWXGH0iWpí
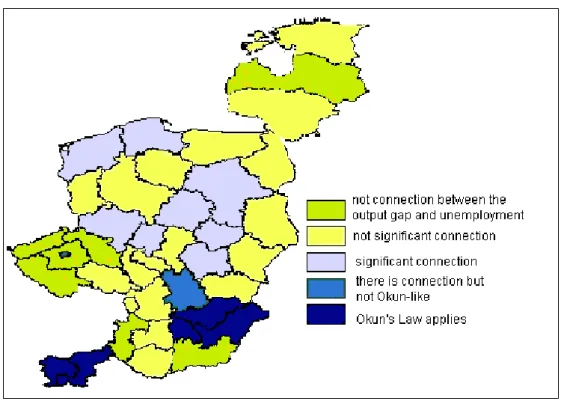
Okun’s Law is not true in each case at regional level that is, this connection cannot be applied with com- SOHWHFRQ¿GHQFHWRLQYHVWLJDWHUHJLRQDOSURFHVVHVKRZHYHULWPD\OHDGWRLQWHUHVWLQJUHVXOWVWKHGLVVHUWDWLRQ contains the results of the regional calculations). Okun’s Law is true for three regions of Hungary and the whole area of Slovenia which has developed along a line reminiscent of a West-East slope.
Figure 2. Evolution of Okun’s Law in Central-Eastern European Regions Source: Own work
T h e s i s 3 : Okun’s Law is true at the level of countries, however it does not apply at regional levels in each FDVH±ZKLFKPHDQVWKDWWKLVFRQQHFWLRQFDQQRWEHXVHGWRLQYHVWLJDWHUHJLRQDOSURFHVVHVZLWKFRPSOHWHFRQ¿- GHQFH+RZHYHU³DQRPDOLHV´FDQEHGHWHFWHGDWUHJLRQDOOHYHO7KHUHJLRQVFDQEHFDWHJRUL]HGLQWRWKUHHJURXSV
x Okun’s Law applies.
x There is a connection between the unemployment rate and the output gap, however it is not Okun-like (with a 2 % decrease of output gap the unemployment rate increases multiple times, DSSUR[í
x There is no connection between the two indicators.
4 . A n a l y s i s o f t h e l a b o u r m a r k e t p e c u l i a r i t i e s o f N o r t h e r n H u n g a r y
The author has carried out (factor analysis) for Hungary’s micro-regions. She aimed to select indicators IURPDVZLGHDUDQJHDVSRVVLEOHIXUWKHUPRUHVKHDWWHPSWHGWRDSSO\WKHLQGLFDWRUVXVHGE\)D]HNDV LQKLVFDOFXODWLRQV)D]HNDVVRXJKWDQVZHUWRWKHODERXUPDUNHWEDVHGUHJLRQDOIUDJPHQWDWLRQRI+XQJDULDQ micro-regions, for the period after the change of regime; he used 14 indicators with data referring to the year +HREWDLQHGWKUHHIDFWRUJURXSVQDPHGXUEDQL]DWLRQGLVWDQFHDQGLQGXVWULDOL]DWLRQ)D]HNDV í'DEDVL+DOiV]IXUWKHUH[SDQGHGWKHUDQJHRILQGLFDWRUVWRH[SORUHWKHODERXUPDUNHWVLWXDWLRQ after the change of regime (Dabasi Halázs, 2011: 59). A criterion for the author of selecting indicators was that the freshest data series are analyzed, and that the indicators generally used in regional analyses are taken LQWRFRQVLGHUDWLRQ/XNRYLFVí.ROOiUíKRZHYHUVKHSODFHGWKHPDLQHPSKDVLV on the evolution of the labour market, therefore, she aimed to minimize the number of indicators in other groups when setting up the set of indicators:
x economic indicators;
x infrastructural indicators;
x labour market indicators;
x social indicators.
Figure 3. Results of the principal component analysis of year 2008 by factors
7KHUHVXOWVRIWKRVHFDOFXODWLRQKDVEHHQSORWWHGRQDPDS)LJXUHZKLFKVKRZVWKDW1RUWKHUQHun- gary’s position within the country proves the region’s relative lagging behind the more developed regions of the country.
The complex labour market situation is the most unfavourable in the case of micro-regions belonging WRWKH¿YHJURXSVRIWKH/DERXUDQG,QFRPH)DFWRUWKHORZHVWYDOXHVZHUHDWWULEXWHGWR1RUWKHUQ+XQJDU\
and Tiszántúl (Trans-Tisza) Region. The rank of regions from the most disadvantaged to the most advan- taged position is reminiscent of the illustration of the unemployment rate on a map. The previously already DSSOLHGFODVVL¿FDWLRQLQWRJURXSKDVEHHQFKRVHQIRUWKH3XEOLF6HUYLFH)DFWRUDQGRWKHUVDVZHOOIRUWKH VDNHRIWKHHDVLHUFRPSDULVRQRIWKHUHVXOWV7KH3XEOLF6HUYLFH)DFWRUH[SOLFLWO\VKRZVWKH:HVW(DVWVORSH and the difference between the two parts of the country. The Miskolc micro-region belongs to the favourable JURXSRQWKHEDVLVRIWKHFDOFXODWLRQV7KH6RFLDO9LWDOLW\)DFWRUPDNHVWKHGLYLVLRQRIWKHFRXQWU\LQWRWZR SDUWVWKHPRVWREVHUYDEOH7KH6RFLDO9LWDOLW\)DFWRUFRPSULVHVWKHGHPRJUDSKLFDOGDWDLQWRRQHIDFWRUWKH (DVWHUQSDUWRIWKHFRXQWU\KDVPXFKZHDNHUGDWD7KHSRZHUFHQWHUVRIWKH6RFLDO5HVSRQVLELOLW\)DFWRUFXW the country in the length; where the eigenvalues are strong the outward migration is low and the number of QRQSUR¿WRUJDQL]DWLRQVLVKLJK
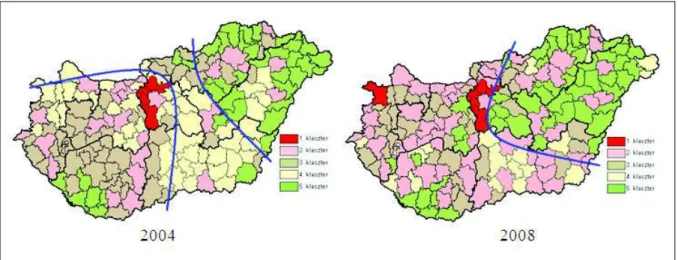
The author did not think at this point that the result of the principal analysis is totally appropriate for making groups among micro-regions; therefore, she carried out a cluster analysis. Various types (K-Means and hierarchical) have been prepared for the basic data of years 2004 and 2008 and the eigenvalues of the IRXUIDFWRUVHDFKFDVHSURGXFHGVLPLODUUHVXOWV)LQDOO\WKHUHVXOWVRIWKH.0HDQVFOXVWHUDQDO\VLVZHUH analyzed for the factors of the above principal component. It was investigated whether the variables used VWURQJO\FRUUHODWHZLWKHDFKRWKHUVWKHYDOXHRIWKH9,)LQGLFDWRUGLGQRWLQGLFDWHGLVWXUELQJPXOWLFROOLQHDU- LW\LQWKHPRGHO)XUWKHUFDOFXODWLRQVDSSOLHGWKHVTXDUHG(XFOLGHDQGLVWDQFHEHFDXVHWKHOLWHUDWXUHDFFHSWVLW in most cases. The K-Means procedure was preferred over the hierarchical cluster analysis since the author has a large-number.
Figure 4. Result of the cluster relating regional differences analyses for years 2004 and 2008 Source: Own work
The author made 5 cluster-groups in each cross-sectional year; the change in the complex position of PLFURUHJLRQVLVZHOOSHUFHLYDEOH)LJXUH6KHGLGQRWQDPHWKHFOXVWHUJURXSVVKHZDVLQWHUHVWHGLQ ZKHWKHUWKHGHJUHHRIFKDQJHZDVVLJQL¿FDQWLQWKHFDVHRI1RUWKHUQ+XQJDU\8QIRUWXQDWHO\WKHFKDQJHZDV equal to stagnation, while the positions of Transdanubian regions strengthened during 4 years and the earlier D[HVRIGHYHORSPHQWLQWHQVL¿HGDVLPXOWDQHRXVLPSURYHPHQWDQGGHFOLQHZDVREVHUYDEOHLQFHUWDLQ1RUWK Hungarian micro-regions. Markov model is used in many disciplines of science; nevertheless, it cannot be regarded as a common analytical method. It is used to illustrate income inequality in regional economics (Major, 2007); to describe labour market dynamics of EU member states (Christodoulakis, Mamatzakis,
2009) and to investigate segmented labour market in labour market studies (Gabuert, Cottrell, 1999). Since WKHQXPEHURIUHJLVWHUHGMREVHHNHUVLVLQDSSURSULDWHIRUFRPSDULVRQ¿UVWWKHDXWKRUFRUUHFWHGWKHQXPEHURI job-seekers by constant population number and divided it by 1000 persons, so that the dataset can be handled with the help of weighting. Too many and two few classes do not yield appropriate results. The author estab- lished 4 classes for the number of registered job-seekers per thousand inhabitants. Then she investigated the H[LVWHQFHRIWUDQVLWLRQSUREDELOLWLHVDPRQJWKHSRWHQWLDOFODVVHVDIWHUWKHFODVVL¿FDWLRQRIPLFURUHJLRQVLQWR the given states. She determined the transition from the initial state (year 2004) to the next one (year 2008), that is, the micro-regions in the absolutely low initial unemployment group stay in the same class for the next year or they take low or medium unemployment values.
Table 2. One-step transition matrix of North Hungarian micro-region according to the number of registered job- seekers (from year 2004 to year 2008)
(unit of measure: number of micro-regions)
Classes 2008
Total (2004)
Low Medium High Very high
2004
low 3 4 0 0 7
medium 0 3 3 1 7
high 0 0 6 2 8
very high 0 0 0 6 6
Total (2008) 3 7 9 9 28
Source: Own work based on own calculations
7KHUHDOLJQPHQWVDPRQJSDUWLFXODUFODVVHVDUHPXFKPRUHVLJQL¿FDQWZLWKLQ1RUWKHUQ+XQJDU\7KH position of three out of those micro-regions in the low unemployment class did not change to year 2008, 4 PLFURUHJLRQVJRWLQWRWKHPHGLXPXQHPSOR\PHQWFODVVWKHVHDUH5pWViJ7LV]D~MYiURV0H]ĘN|YHVGDQG Balassagyarmat micro-regions). 3 micro-regions’ position remained unchanged in the medium unemploy- ment class, 3 got into the high and further 1 into higher unemployment group (Szécsény micro-region).
Table 3. Value of mobility index by regions from years 2004 to 2008
Region Mobility index
Southern Great Plain 94.4%
Southern Transdanubia 72.2%
Northern Great Plain 76.2%
Northern Hungary 46.4%
Central Transdanubia 56.3%
Central Hungary 100.0%
Western Transdanubia 69.5%
Source: Own work based on own calculations
Belonging to the high unemployment group did not mean a realignment for 6 micro-regions; deteriora- tion was observable in the case of two, these micro-regions (Ózd and Tokaj) shifted to the very high unem- ployment class). No change was observable in the case of micro-regions in the very high unemployment group, compared to other groups, from year 2004 to year 2008. The value of mobility index is 46.4 % in Northern Hungary.
Thesis 4: The results of principal component analysis, cluster analysis and transition matrices prove the regional realignment in the spatial structure of Hungary. The country’s split into two parts, the growth of differences among and the homogenisation within the parts had become even more obvious by 2008. The further exclusion of Northern Hungary can be experienced having analysed the complex indicators. The re- JLRQFDQQRWFDSLWDOL]HRQWKH*HUVFKHQNURQHIIHFWWKDWLVWKH³DGYDQWDJHRIODWHFRPHUV´
Table 4. One-step transition matrix of North Hungarian micro-region according to the number of registered job- seekers (from year 2008 to year 2010)
(unit of measure: number of micro-regions)
Classes 2010
Total (2008)
Low Medium High Very high
2008
low 4 3 0 0 7
medium 0 3 3 1 7
high 0 1 2 4 7
very high 0 0 0 7 7
Total (2010) 4 7 5 12 28
Source: Own work based on own calculations
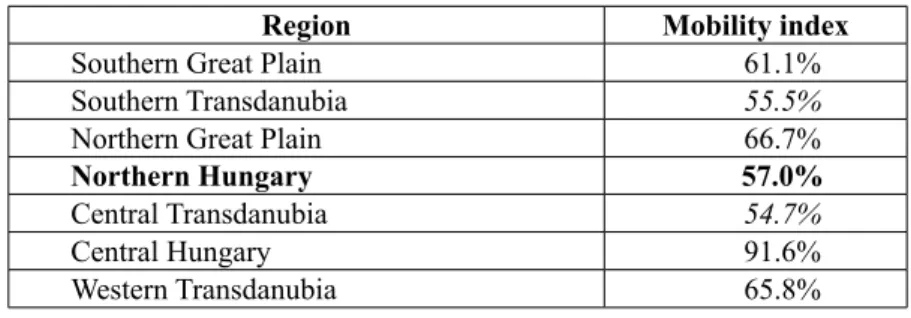
7KHUHDOLJQPHQWVDPRQJSDUWLFXODUFODVVHVDUHPXFKPRUHVLJQL¿FDQWZLWKLQ1RUWKHUQ+XQJDU\1R change was observable in the case of micro-regions in the very high unemployment group, compared to other groups, from year 2008 to year 2010 (naturally, there were intra-group realignments in each micro-region but the transition matrix does not examine them). The value of mobility index is 57 % in Northern Hungary. The DXWKRUFDOFXODWHGPRELOLW\LQGLFHVIRUWKHUHVWRIWKHUHJLRQVDVZHOOWU\LQJWR¿QGHYLGHQFHDVWRZKHWKHUWKH realignment among groups was the lowest in Northern Hungary (Table 7).
Table 5. Value of mobility index by regions from years 2008 to 2010
Region Mobility index
Southern Great Plain 61.1%
Southern Transdanubia 55.5%
Northern Great Plain 66.7%
Northern Hungary 57.0%
Central Transdanubia 54.7%
Central Hungary 91.6%
Western Transdanubia 65.8%
Source: Own work based on own calculations
In summary, the realignment of micro-regions among classes is of much lower degree within Northern Hungary than in the rest of Hungarian regions, except for Southern Transdanubia and Central Transdanubia.
The intra-country realignment was 47.8 % from years 2004 to 2008, and it was 53.7 % from 2008 to 2010. At the same time, the intra-regional realignment from 2008 to 2010 was of lower degree than in the previous period; that is, a process of inter-regional equalization began in terms of the number of registered job-seekers.
Thesis 5: The realignment of the number of registered job-seekers among groups (so called classes) in 1RUWKHUQ+XQJDU\ZDVQRWDVVLJQL¿FDQWDVLQWKHUHVWRIWKHUHJLRQVLQ+XQJDU\VLQFHWKHHFRQRPLFFULVLV The reason for that is that the crisis shook less developed regions to a lesser extent also from labour market perspective. The least realignment in Northern Hungary took place among the least favourable (very high unemployment) and the unfavourable labour market (high unemployment) classes.
5 . R e c o m m e n d a t i o n s f o r d e v e l o p i n g a n e ff i c i e n t r e g i o n a l e m p l o y m e n t p o l i c y
There is no experience of regionally differentiated employment policy in Hungary. No examples can be found to this in Europe either, however, the existence of a regional employment policy with be reasonable.
The summary of the author’s recommendations for the establishment of a system of criteria to underpin a regional employment policy are listed below:
x A multi-channel employment policy would be reasonable in the long term that combines the traditional forms of employment and alternative solutions. A regional level decision is not suf-
¿FLHQW IRU LWV UHDOL]DWLRQ UDWKHU PDFUROHYHO VRFLDOHFRQRPLF FRQGLWLRQV KDYH WR EH HQVXUHG moreover an attitudinal change is essential. An increasing focus is placed on the application of non-traditional forms of employment due to the changing meaning of work-concept and also DORQJZLWKWKHFKDQJHLQWKHZD\RIGRLQJZRUN)XWXUHHPSOR\PHQWSROLFLHVKDYHWRWUHDWWUDGL- tional and alternative forms of employment together.
x Regions having similar characteristics and similar labour market features should cooperate and act jointly in the European Union; joint asserting of interests and joint representation would EULQJVLJQL¿FDQWUHVXOWV7KHEDVLVIRUWKHFODVVL¿FDWLRQRIUHJLRQVLQWRVDPHW\SHVFDQEHVLPL- lar economic-social situation and same labour market conditions. The results of proving Okun’s ODZKDYHEHHQSORWWHGRQDPDSZKLFKFRXOGVHUYHDVDV\VWHPRIFULWHULDIRUWKHFODVVL¿FDWLRQ A synergy among similar regions could be created in Hungary as well. The results of principal component analysis, cluster analysis and transition matrices well illustrate which regions should cooperate, which regions are in similar situation. The economic crisis shook disadvantaged re- gions less than those in more favourable situation. The values of the mobility indices explicitly prove the degree of realignment within regions from labour market aspect. The special (unfa- YRXUDEOHVLWXDWLRQRI1RUWKHUQ+XQJDU\ZDVREVHUYHGZKHQFDOFXODWLQJERWK±DQG
±WUDQVLWLRQPDWULFHV
x 7KHÀRZRIVHFWRUDOODERXUIRUFHPD\H[HUWOHVVDQGOHVVLQÀXHQWLDOSRZHUIRUUHJLRQDOHPSOR\- ment policy in the future.
x Regional employment policy should give priority to the supporting of human potential by way of, within the active employment policy tools, increasing the amount spent on labour market train- ings; it requires taking the demands and emerging needs of employers.
x Various labour market forecasting models are available to support regional employment policy.
x A strategy capitalizing on internal features and naturally taking external processes into account should be formulated instead of continuously eliminating the European Union’s employment policy.
x The issue of employment has to be addressed in a complex manner, it is necessary to coordinate WD[SROLF\HGXFDWLRQDOSROLF\DQGRWKHUVXESROLFLHVIRUHQKDQFLQJHI¿FLHQF\
x Developing an independent regional employment policy that sets up regional objectives and has independent measures and institutional system would be reasonable.
C o n c l u s i o n s
At the beginning of the research, the author hypothesised that the position of the North Hungarian region LVVLJQL¿FDQWO\GHWHUPLQHGE\LWVVSHFLDOHFRQRPLFDQGVRFLDOFRQWH[WZKLFKFDQEHGHULYHGIURPWKHHQGRI communism.
+XQJDU\LVQRWVLJQL¿FDQWO\VHSDUDWHGLQWKH&HQWUDO(DVWHUQ(XURSHDQVSDFHXQIDYRXUDEOHODERXUPDU- ket position characterises all of the transitional countries. She carried out some calculations at different ter- ULWRULDOOHYHOV)LUVWVKHFRPSDUHGWKHODERXUPDUNHWVRI&HQWUDO(DVWHUQ(XURSHDQDQG:HVWHUQ(XURSHDQ countries. She demonstrated territorial inequalities with the use of Hoover-index. She analysed Okun role at the regional level: in some regions, there is relationship between output gap and unemployment, while there is no such relationship in other regions. The regional estimation of HDI shows the territorial realignment of labour market. The extent to which Hungary lags behind the Central-Eastern European area is getting more DQG PRUH VLJQL¿FDQW DQG LQ WKH PHDQWLPHWKH &HQWUDO(DVWHUQ (XURSHDQ DUHD ODJV EHKLQG WKH (XURSHDQ Union. She examined the variables explaining the labour market position of the North Hungarian region ZLWKSULQFLSDOFRPSRQHQWDQDO\VLVDQGFOXVWHUDQDO\VLV7KHUHVXOWVFRQ¿UPWKHWHUULWRULDOUHDOLJQPHQWLQ
the spatial structure of Hungary. While the development axes strengthened in the Transdanubian areas from 2004 to 2008 and therefore the spatial structure became more balanced, the North Hungarian region lagged behind to a greater extent based on complex measures. Because of this cumulative phase lag, the economic crisis still has an effect on the domestic labour market, and to a greater extent on the labour market of the North Hungarian region. To examine the extent of realignment, she applied Markov chain model and transi- tion matrices. The results show that the smallest realignment among the classes was realised in the North Hungarian region.
The North Hungarian region has a special position within Central-Eastern Europe, therefore regional employment policy should be special, too. Such a special regional employment policy can be found neither LQWKH(XURSHDQ8QLRQQRULQWKH&HQWUDO(DVWHUQ(XURSHDQDUHDHYHQLILWZRXOGEHMXVWL¿HG$FRQGLWLRQ RIWKHIXQFWLRQRIHI¿FLHQWSROLFLHVLVWKHFRRUGLQDWHGIXQFWLRQRIWKHDLPVPHDQVSULRULWLHVDQGLQVWLWXWLRQV
&XUUHQWO\DFHQWUDOO\GLVWULEXWHGGHFRQFHQWUDWHGHPSOR\PHQWSROLF\LVUHDOLVHG,WLVGLI¿FXOWWRLPDJLQHWKDW a regional employment policy takes shape within a reasonable time frame taking into account that only the institution system is available out of the above listed four functions in the case of the regions.
R e f e r e n c e s
Arendt, H. (1958). Vita Activa oder Vom tätigen Leben. München: Piper Kiadó.
Aristotle. (1997). Nikomakhoszi etika. Budapest: Európa Kiadó, 455 p.
Bánfalvy, C. (1989). A munkanélküliség%XGDSHVW0DJYHWĘ.LDGyS
Boda, Z., Scheiring, G. (2011). *OREDOL]iFLypVIHMOĘGpVDIpOSHULIpULiQYiOViJpVDOWHUQDWtYiN. Budapest: Védegylet Kiadó, 208 p.
Castel, R. (1998). A szociális kérdés alakváltozásai, A bérmunka krónikája. Budapest: Kávé Kiadó, 453 p.
Christodoulakis, G., Mamatzakis, E. C. (2009). Labour market dinamics in EU: a Bayesian Markov Chain Approach.
Department of Economics Discussion Paper6HULHVS±
Csoba, J. (2010). $WLV]WHVPXQND$WHOMHVIRJODONR]WDWiVDV]i]DGHVpO\HYDJ\XWySLiMD"±.tVpUOHWHNDPXQND WiUVDGDOPiQDNIHQQWDUWiViUDVDMyOpWLiOODPDODSYHWĘIHOWpWHOHNpQWGH¿QLiOWWHOMHVIRJODONR]WDWiVEL]WRVtWiViUD. Bu- dapest: L’Harmattan Kiadó, 271 p.
'DEDVL + = $ JD]GDViJL YiOViJ KDWiVD ± N|]|WW D PXQNDHUĘSLDF WHUOHWL NO|QEVpJHLUHÉszak- magyarországi Stratégiai FüzetekpYIV]iPS±
Deane, P. (1997). $N|]JD]GDViJLJRQGRODWRNIHMOĘGpVH%XGDSHVW.|]JD]GDViJLpV-RJL.|Q\YNLDGyS
)D]HNDV.2]VYDOGe1|YHNYĘPXQNDQpONOLVpJUXJDOPDVDEEPXQNDHUĘSLDF±DMDSiQVWtOXV~IRJODONR]WD- tási modell átalakulása. Közgazdasági SzemlepYIV]iPS±
)D]HNDV.9iOViJpVSURVSHULWiVDPXQNDHUĘSLDFRQ±$PXQNDQpONOLVpJUHJLRQiOLVVDMiWRVViJDL0DJ\DURU- V]iJRQ±N|]|WWTér és TársadalompYIV]iPS±
Gaburt, P., Cottrell, M. (1999). A dynamic analysis of segmeted labor market. Fuzzy Economic Review, 4. évf. 2. szám, Kaldor, N. (1955). Alternative theories of distribution. The Review of Economic Studies9RO1RS±S±
Kollár, K. (2012). $KD]DLKiWUiQ\RVKHO\]HWĦNLVWpUVpJHNIĘEEWpUJD]GDViJL|VV]HIJJpVHL3K'pUWHNH]pV*|G|OOĘ 165 p.
/LSWiN.$QDO\]LQJWKHODERXUPDUNHWVLWXDWLRQE\WKH&HQWUDO(DVWHUQ(XURSHDQFRXQWULHV±,PSURYHPHQWRU decline? Theory, Methodology, Practise9RO1RS±
Lukovics, M. (2007). A lokális térségek versenyképességének elemzése. Ph.D. értekezés. Szeged, 251 p.
Major, K. (2008). Markov-modellek – Elmélet, becslés és társadalomtudományi alkalmazások. Regionális Tudományi 7DQXOPiQ\RN%&(0DUNR|NRQyPLD7DQV]pN±(/7(5HJLRQiOLV7XGRPiQ\L7DQV]pNS
Malthus, T. R. (1944). A közgazdaságtan elvei tekintettel gyakorlati alkalmazásukra. %XGDSHVW0DJ\DU.|]JD]GDViJL Társaság Kiadó, 463 p.
Marx, K. (1955). $WĘNH$WĘNHWHUPHOpVLIRO\DPDWD. Budapest: Kossuth Kiadó, 820 p.
0iWp'$NLERFViWiVpVDPXQNDWpQ\H]ĘNDSFVRODWDD]RNXQLSRV]WXOiWXPV]HPV]|JpEĘOStatisztikai Szemle, pYV]iPS±
Mátyás, A. (1969). )HMH]HWHNDN|]JD]GDViJLJRQGRONRGiVW|UWpQHWpEĘO. Budapest: Kossuth Kiadó, 259 p.
Nemes, N. J. (2005). Regionális elemzési módszerek. Regionális Tudományi Tanulmányok 11, 284 p.
Péter, Z. (2010). A turizmus térségi folyamatainak összefüggései, különös tekintettel az Észak-magyarországi régióra.
Ph.D. értekezés. Miskolc, 180 p.
Smith, A. (1959). Nemzetek gazdagsága: E gazdaság természetének és okainak vizsgálata. Budapest: Akadémiai Ki- adó, 413 p.
Zalai, E. (1988). Munkaérték és sajátérték: Adalékok az értéknagyság elemzéséhez. Budapest: Akadémiai Kiadó, 219 p.
Zboróvári, K. (1988). $IHMOHWWWĘNpVRUV]iJRNPXQNDQpONOLVpJHÈWPHQHWLVWUXNWXUiOLV]DYDURNYDJ\WDUWyVYiOWR]iVRN"
%XGDSHVW.|]JD]GDViJLpV-RJL.|Q\YNLDGyS
Acknowledgment
This research was realized in the frames of TÁMOP 4.2.4. A/2-11-1-2012-0001 “National Excellence 3URJUDP±(ODERUDWLQJDQGRSHUDWLQJDQLQODQGVWXGHQWDQGUHVHDUFKHUSHUVRQDOVXSSRUWV\VWHPFRQYHUJHQFH SURJUDP´7KHSURMHFWZDVVXEVLGL]HGE\WKH(XURSHDQ8QLRQDQGFR¿QDQFHGE\WKH(XURSHDQ6RFLDO)XQG
3$ 6 , Nj /< 0 $ , . 8 57 , 9 ( , . 6 0 , 1 * Ą 5 ( * , 2 1 , 1 , 2 8 ä , 0 7 8 0 2 3 2 / , 7 , . Ą
KATALIN LIPTÁK
Miskolc Universitetas (Vengrija) S a n t r a u k a
âLDPH VWUDLSVQ\MH QDJULQơMDPRVWU\V SDJULQGLQơV WHPRV DSåYHOJLDPRVYLVRVSDJULQGLQơV VX ƳGDU ELQLPXVXVLMXVLRVHNRQRPLQơVWHRULMRVSDWHLNLDPDQDXMDdarbo VąYRNRVLQWHUSUHWDFLMDDSWDULDPLLNLLQGXV- WULQLVLQGXVWULQLVLUSRLQGXVWULQLVSHULRGDL$XWRUơƳYHUWLQDJOREDOL]DFLMRVSRYHLNƳSHUHLQDQWQXRLQGXVWULQLR SULHSRLQGXVWULQLRODLNRWDUSLRSULVWDWRMRVSRYHLNƳGDUERULQNDL.DLSSRWHQFLDOLDVƳGDUELQLPRDOWHUQDW\YDV DXWRUơDQDOL]XRMDDWLSLQHVGDUERIRUPDVWRNLDVNDLSYLHãDVXåLPWXPDVLUVRFLDOLQơVROLGDUXPRHNRQRPLND DQDOL]XRMDPRV9LGXULRLU5\Wǐ(XURSRVãDOLǐGDUERULQNRVGHWDOLDXDSWDULDPDãLDXULQơV9HQJULMRVGDUER ULQNDSDWHLNLDPDSDVLnjO\PǐNDLSNXUWLYHLNVPLQJHVQĊUHJLRQLQĊXåLPWXPRSROLWLNą7UDQVIRUPXRMDQWLV darboVąYRNDLDWVLUDQGDDOWHUQDW\YLǐƳGDUELQLPRIRUPǐSRUHLNLV$XWRUơƳVLWLNLQXVLNDGãLRVDOWHUQDW\YRV LUUHJLRQLQơXåLPWXPRSROLWLNDJDOLSDGơWLLãVSUĊVWLDWHLWLHVGDUERULQNRVSUREOHPDV.HOLDPDKLSRWH]ơNDG ãLDXULQơV9HQJULMRVUHJLRQRVLWXDFLMDQXOHPWDVRFLRHNRQRPLQLRNRQWHNVWRNXULVVXVLMĊVVXNRPXQL]PRSDEDL- JD$XWRUơWDLNơHoover LQGHNVąWLNULQROkunoGơVQƳ9LGXULR5\Wǐ(XURSRVãDO\VHLUUHJLRQXRVHVNDLþLDYR Markovo JUDQGLQơVPRGHOƳLUWDLNơIDNWRULQơVDQDOL]ơVPHWRGą
3$*5,1',1,$,ä2'ä,$,JOREDOL]DFLMDUHJLRQLQLVXåLPWXPDVGDUERULQND -(/./$6,),.$&,-$-55