1073
Integrative Analysis Reveals a Molecular Stratification of Systemic Autoimmune Diseases
Guillermo Barturen,
1Sepideh Babaei,
2Francesc Català- Moll,
3Manuel Martínez- Bueno,
1Zuzanna Makowska,
2Jordi Martorell- Marugán,
1Pedro Carmona- Sáez,
1Daniel Toro- Domínguez,
1Elena Carnero- Montoro,
1María Teruel,
1Martin Kerick,
4Marialbert Acosta- Herrera,
4Lucas Le Lann,
5Christophe Jamin,
5Javier Rodríguez- Ubreva,
3Antonio García- Gómez,
3Jorge Kageyama,
2Anne Buttgereit,
2Sikander Hayat,
2Joerg Mueller,
2Ralf Lesche,
2Maria Hernandez- Fuentes,
6Maria Juarez,
6Tania Rowley,
6Ian White,
6Concepción Marañón,
1Tania Gomes Anjos,
1Nieves Varela,
1Rocío Aguilar- Quesada,
7Francisco Javier Garrancho,
7Antonio López- Berrio,
7Manuel Rodriguez Maresca,
7Héctor Navarro- Linares,
7Isabel Almeida,
8Nancy Azevedo,
8Mariana Brandão,
8Ana Campar,
8Raquel Faria,
8Fátima Farinha,
8António Marinho,
8Esmeralda Neves,
8Ana Tavares,
8Carlos Vasconcelos,
8Elena Trombetta,
9Gaia Montanelli,
9Barbara Vigone,
9Damiana Alvarez- Errico,
3Tianlu Li,
3Divya Thiagaran,
10Ricardo Blanco Alonso,
11Alfonso Corrales Martínez,
11Fernanda Genre,
11Raquel López Mejías,
11Miguel A. Gonzalez- Gay,
11Sara Remuzgo,
11Begoña Ubilla Garcia,
11Ricard Cervera,
12Gerard Espinosa,
12Ignasi Rodríguez- Pintó,
12Ellen De Langhe,
13Jonathan Cremer,
13Rik Lories,
13Doreen Belz,
14Nicolas Hunzelmann,
14Niklas Baerlecken,
15Katja Kniesch,
15Torsten Witte,
15Michaela Lehner,
16Georg Stummvoll,
16Michael Zauner,
16Maria Angeles Aguirre- Zamorano,
17Nuria Barbarroja,
17Maria Carmen Castro- Villegas,
17Eduardo Collantes- Estevez,
17Enrique de Ramon,
18Isabel Díaz Quintero,
18Alejandro Escudero- Contreras,
17María Concepción Fernández Roldán,
19Yolanda Jiménez Gómez,
17Inmaculada Jiménez Moleón,
20Rosario Lopez- Pedrera,
17Rafaela Ortega- Castro,
17Norberto Ortego,
19Enrique Raya,
20Carolina Artusi,
21Maria Gerosa,
21Pier Luigi Meroni,
21Tommaso Schioppo,
21Aurélie De Groof,
22Julie Ducreux,
22Bernard Lauwerys,
22Anne- Lise Maudoux,
22Divi Cornec,
5Valérie Devauchelle- Pensec,
5Sandrine Jousse- Joulin,
5Pierre- Emmanuel Jouve,
23Bénédicte Rouvière,
5Alain Saraux,
5Quentin Simon,
5Montserrat Alvarez,
24Carlo Chizzolini,
24Aleksandra Dufour,
24Donatienne Wynar,
24Attila Balog,
25Márta Bocskai,
25Magdolna Deák,
25Sonja Dulic,
25Gabriella Kádár,
25László Kovács,
25Qingyu Cheng,
26Velia Gerl,
26Falk Hiepe,
26Laleh Khodadadi,
26Silvia Thiel,
26Emanuele de Rinaldis,
27Sambasiva Rao,
28Robert J. Benschop,
29Chris Chamberlain,
6Ernst R. Dow,
29Yiannis Ioannou,
6Laurence Laigle,
30Jacqueline Marovac,
6Jerome Wojcik,
31Yves Renaudineau,
5Maria Orietta Borghi,
32Johan Frostegård,
10Javier Martín,
4Lorenzo Beretta,
9Esteban Ballestar,
3Fiona McDonald,
2Jacques- Olivier Pers,
5and Marta E. Alarcón- Riquelme
33Objective. Clinical heterogeneity, a hallmark of systemic autoimmune diseases, impedes early diagnosis and
effective treatment, issues that may be addressed if patients could be classified into groups defined by molecular pattern. This study was undertaken to identify molecular clusters for reclassifying systemic autoimmune diseases independently of clinical diagnosis.
Supported by the Innovative Medicines Initiative Joint Undertaking of the Spanish Health Ministry (grant 115565) and in- kind and in- cash contributions from the European Federation of Pharmaceutical Industries and Associations partners. Dr. Barturen’s work was supported by the Instituto de Salud Carlos III through the Sara Borrell subprogram (grant CD18/00153).
1Guillermo Barturen, PhD, Manuel Martínez- Bueno, PhD, Jordi Martorell- Marugán, MSc, Pedro Carmona- Sáez, PhD, Daniel Toro- Domínguez, PhD, Elena Carnero- Montoro, PhD, María Teruel, PhD, Concepción Marañón, PhD, Tania Gomes Anjos, PhD, Nieves Varela, PhD: Pfizer– University of Granada– Junta de Andalucía Centre for Genomics and Oncological Research, Granada, Spain; 2Sepideh Babaei, PhD, Zuzanna Makowska, PhD, Jorge Kageyama, PhD, Anne Buttgereit, PhD, Sikander Hayat, PhD, Joerg Mueller, PhD, Ralf Lesche, PhD, Fiona McDonald, PhD: Bayer, Berlin, Germany; 3Francesc Català- Moll, PhD, Javier Rodríguez- Ubreva, PhD, Antonio García- Gómez, PhD, Damiana Alvarez- Errico, PhD, Tianlu Li, PhD,
Esteban Ballestar, PhD: Bellvitge Biomedical Research Institute, Barcelona, Spain; 4Martin Kerick, PhD, Marialbert Acosta- Herrera, PhD, Javier Martín, MD, PhD: Institute of Parasitology and Biomedicine “López Neyra”, Spanish National Research Council, Granada, Spain; 5Lucas Le Lann, PhD, Christophe Jamin, PhD, Divi Cornec, MD, PhD, Valérie Devauchelle- Pensec, MD, PhD, Sandrine Jousse- Joulin, MD, Bénédicte Rouvière, MD, Alain Saraux, MD, PhD, Quentin Simon, PhD, Yves Renaudineau, PhD, Jacques- Olivier Pers, PhD: Université de Brest, Centre Hospitalier Universitaire de Brest, INSERM, and Labex IGO, Brest, France; 6Maria Hernandez- Fuentes, PhD, Maria Juarez, PhD, Tania Rowley, PhD, Ian White, PhD, Chris Chamberlain, PhD (current address: Merck KGaA, Darmstadt, Germany), Yiannis Ioannou, MD, PhD, Jacqueline Marovac, MSc: UCB, Slough, UK;
7Rocío Aguilar- Quesada, PhD, Francisco Javier Garrancho, MSc, Antonio López- Berrio, MD, PhD, Manuel Rodriguez Maresca, MD, PhD, Héctor Navarro- Linares, BSc: Andalusian Public Health System Biobank, Granada,
Methods. Unsupervised clustering of integrated whole blood transcriptome and methylome cross- sectional data
on 955 patients with 7 systemic autoimmune diseases and 267 healthy controls was undertaken. In addition, an inception cohort was prospectively followed up for 6 or 14 months to validate the results and analyze whether or not cluster assignment changed over time.
Results. Four clusters were identified and validated. Three were pathologic, representing “inflammatory,”
“lymphoid,” and “interferon” patterns. Each included all diagnoses and was defined by genetic, clinical, serologic, and cellular features. A fourth cluster with no specific molecular pattern was associated with low disease activity and included healthy controls. A longitudinal and independent inception cohort showed a relapse– remission pattern, where patients remained in their pathologic cluster, moving only to the healthy one, thus showing that the molecular clusters remained stable over time and that single pathogenic molecular signatures characterized each individual patient.
Conclusion. Patients with systemic autoimmune diseases can be jointly stratified into 3 stable disease clusters
with specific molecular patterns differentiating different molecular disease mechanisms. These results have important implications for future clinical trials and the study of nonresponse to therapy, marking a paradigm shift in our view of systemic autoimmune diseases.
INTRODUCTION
The systemic autoimmune diseases are entities diagnosed based on different clinical and laboratory criteria. The diseases are highly heterogeneous with varied progression of disease severity.
In general, the time from disease onset to diagnosis can be many years, leading to damage accrual and poor prognosis. Moreover, some individuals never fulfill the clinical criteria for a specific sys- temic autoimmune disease and remain undiagnosed for years or a lifetime (undifferentiated connective tissue disease [UCTD]).
Patients with different systemic autoimmune diseases share some clinical features. A number of patients with systemic lupus erythematosus (SLE) may develop joint deformities in the hands and feet, similar to those found in rheumatoid arthritis (RA), albeit without erosions, and all may share autoantibody specificities (1).
Patients with mixed connective tissue disease (MCTD) may have clinical manifestations observed in SLE, RA, or systemic sclerosis (SSc) (2,3). While patients with SLE and RA may present with sec- ondary Sjögren’s syndrome (SS), many patients have the primary entity (primary SS) without evidence of RA or SLE (4). Similarly,
Spain; 8Isabel Almeida, MD, PhD, Nancy Azevedo, PhD, Mariana Brandão, MD, Ana Campar, MD, Raquel Faria, MD, Fátima Farinha, MD, António Marinho, MD, Esmeralda Neves, MD, Ana Tavares, MD, Carlos Vasconcelos, MD, PhD: Centro Hospitalar do Porto, Porto, Portugal; 9Elena Trombetta, BSc, Gaia Montanelli, MD, Barbara Vigone, MD, Lorenzo Beretta, MD, PhD:
Fondazione IRCCS Ca’ Granda Ospedale Maggiore Policlinico, Milan, Italy;
10Divya Thiagaran, PhD, Johan Frostegård, MD, PhD: Karolinska Institutet, Stockholm, Sweden; 11Ricardo Blanco Alonso, MD, PhD, Alfonso Corrales Martínez, MD, PhD, Fernanda Genre, MD, PhD, Raquel López Mejías, MD, PhD, Miguel A. Gonzalez- Gay, MD, PhD, Sara Remuzgo, MD, PhD, Begoña Ubilla Garcia, MD: Hospital Universitario Marqués de Valdecilla, IDIVAL, Universidad de Cantabria, Santander, Spain; 12Ricard Cervera, MD, PhD, Gerard Espinosa, MD, PhD, Ignasi Rodríguez- Pintó, MD, PhD: Hospital Clínic and Institut d’Investigacions Biomèdiques August Pi i Sunyer, Barcelona, Spain; 13Ellen De Langhe, MD, PhD, Jonathan Cremer, PhD, Rik Lories, MD, PhD: Katholieke Universiteit Leuven and Universitair Ziekenhuis Leuven, Leuven, Belgium; 14Doreen Belz, MD, Nicolas Hunzelmann, MD: Klinikum der Universitaet zu Koeln, Cologne, Germany; 15Niklas Baerlecken, MD, PhD, Katja Kniesch, MD, Torsten Witte, MD, PhD: Hannover Medical School, Hannover, Germany; 16Michaela Lehner, MD, Georg Stummvoll, MD, PhD, Michael Zauner, MD, PhD: Medical University Vienna, Vienna, Austria;
17Maria Angeles Aguirre- Zamorano, MD, PhD, Nuria Barbarroja, PhD, Maria Carmen Castro- Villegas, MD, PhD, Eduardo Collantes- Estevez, MD, PhD, Alejandro Escudero- Contreras, MD, PhD, Yolanda Jiménez Gómez, PhD, Rosario Lopez- Pedrera, PhD, Rafaela Ortega- Castro, MD, PhD: Reina Sofia University Hospital and University of Cordoba, Cordoba, Spain; 18Enrique de Ramon, MD, PhD, Isabel Díaz Quintero, BSc: Hospital Regional Universitario de Málaga, Málaga, Spain; 19María Concepción Fernández Roldán, PhD, Norberto Ortego, MD, PhD: Hospital Universitario San Cecilio, Granada, Spain; 20Inmaculada Jiménez Moleón, MD, PhD, Enrique Raya, MD, PhD:
Hospital Virgen de las Nieves, Granada, Spain; 21Carolina Artusi, MD, PhD, Maria Gerosa, MD, PhD, Pier Luigi Meroni, MD, PhD, Tommaso Schioppo, MD: Università degli Studi di Milano, Milan, Italy; 22Aurélie De Groof, PhD,
Julie Ducreux, PhD, Bernard Lauwerys, MD, PhD, Anne- Lise Maudoux, BSc:
Université Catholique de Louvain and Cliniques Universitaires Saint- Luc, Brussels, Belgium; 23Pierre- Emmanuel Jouve, PhD: AltraBio, Lyon, France;
24Montserrat Alvarez, MD, PhD, Carlo Chizzolini, MD, PhD, Aleksandra Dufour, PhD, Donatienne Wynar, BSc: Geneva University Hospital, Geneva, Switzerland; 25Attila Balog, MD, PhD, Márta Bocskai, MD, Magdolna Deák, MD, PhD, Sonja Dulic, MD, PhD, Gabriella Kádár, MD, László Kovács, MD, PhD: University of Szeged, Szeged, Hungary; 26Qingyu Cheng, MD, PhD, Velia Gerl, PhD, Falk Hiepe, MD, PhD, Laleh Khodadadi, PhD, Silvia Thiel, MD, PhD: Charité Universitätsmedizin Berlin, Berlin, Germany; 27Emanuele de Rinaldis, PhD: Sanofi, Cambridge, Massachusetts; 28Sambasiva Rao, PhD:
Sanofi- Genzyme, Framingham, Massachusetts; 29Robert J. Benschop, PhD, Ernst R. Dow, PhD: Eli Lilly, Indianapolis, Indiana; 30Laurence Laigle, PhD:
Institut de Recherches Internationales Servier, Suresnes, France; 31Jerome Wojcik, PhD: QuartzBio, Geneva, Switzerland; 32Maria Orietta Borghi, PhD:
Università degli Studi di Milano and Istituto Auxologico Italiano, Milan, Italy;
33Marta E. Alarcón- Riquelme, MD, PhD: Pfizer– University of Granada– Junta de Andalucía Centre for Genomics and Oncological Research, Granada, Spain, and Karolinska Institutet, Stockholm, Sweden.
Drs. Babaei and Català- Moll contributed equally to this work.
Drs. Babaei, Makowska, Kageyama, Buttgereit, Hayat, Mueller, Lesche, and McDonald are employees of Bayer. Drs. Benschop and Dow are employees of Eli Lilly. Drs. Hernandez- Fuentes, Juárez, Rowley, White, Chamberlain, Ioannou, and Marovac are employees of UCB. Drs. de Rinaldis and Rao are employees of Sanofi. Dr. Laigle is an employee of IRIS Servier.
No other disclosures relevant to this article were reported.
Address correspondence to Marta E. Alarcón- Riquelme, MD, PhD, Department of Medical Genomics, Pfizer– University of Granada– Junta de Andalucía Centre for Genomics and Oncological Research, Andalusian Regional Government, Health Sciences Technology Park, 18016, Granada, Spain. Email: marta.alarcon@genyo.es.
Submitted for publication July 13, 2020; accepted in revised form December 1, 2020.
SLE patients may have secondary antiphospholipid syndrome (APS), but other patients have primary APS and do not develop SLE, even after many years (5). This overlapping clinical landscape hinders diagnosis, prognosis estimations, and adequate early treatment.
Genetic studies have shown that systemic autoimmune diseases share susceptibility genes (6) and molecular features, such as increased expression of interferon- inducible genes (inter- feron signature) (7,8), mainly observed in SLE patients. But not all patients with SLE have the interferon signature. Some patients with SSc have disease limited to the skin (9), and not all patients who fulfill the diagnostic criteria for RA have anti– citrullinated pep- tide antibodies (~70%) (10). A number of patients with SLE and primary SS have anti- SSA and anti- SSB antibodies, and these associate with alleles of the HLA class II gene DRB1*0301 (11).
This heterogeneity impedes identification of new therapies, the selection of response end points, and the overall results of clinical trials, hindering treatment advances (12,13). Therefore, develop- ment of new therapies, prescription of existing ones, and even the early diagnosis of systemic autoimmune diseases might benefit from a uniform molecular classification that allows their stratifica- tion and considers their commonalities.
Some efforts have been made to stratify individual systemic autoimmune diseases into homogeneous molecular groups of patients (12– 14), and very recently, to reclassify 3 different auto- immune clinical outcomes into a molecular classification based solely on mass spectrometry (15). The findings of all of those studies support the hypothesis that molecular reclassification is of utmost importance, but they lacked sufficient numbers of patients and multiple layers of information needed for this purpose— not least, the proper validation. Thus, in this unprece- dented study in systemic autoimmunity, high- dimensional molec- ular data from whole blood shows how 7 autoimmune diseases (SLE, RA, SSc, primary SS, MCTD, primary APS, and UCTD) stratify into groups based on molecular patterns that are stable over time, each having defined serologic, cellular, genetic, and clinical characteristics.
PATIENTS AND METHODS
Samples and data types. Two cohorts of individuals with 7 different systemic autoimmune diseases were recruited: a cross- sectional cohort composed of 955 patients and 267 healthy con- trols, and an inception cohort of 113 patients followed up and sampled at the time of recruitment and at 6 and/or 14 months (Supplementary Table 1, available on the Arthritis & Rheumatology website at http://onlinelibrary.wiley.com/doi/10.1002/art.41610/
abstract). Inclusion and exclusion criteria are detailed in Supple- mentary Table 2, available on the Arthritis & Rheumatology website at http://onlin elibr ary.wiley.com/doi/10.1002/art.41610/ abstract.
Quality control information, diagnosis distributions, demographic information, and prescriptions are listed in Supplementary
Tables 3–6, available on the Arthritis & Rheumatology website at http://onlin elibr ary.wiley.com/doi/10.1002/art.41610/ abstract.
Blood and serum samples were obtained from all patients.
High- dimensional genome- wide genotype, transcriptome, and DNA methylome data, and proportions of relevant cell types were analyzed in whole blood. Low- dimensional information including selected serologic findings, such as the presence of autoantibodies, cytokines, chemokines, and inflammatory medi- ators, was obtained (Supplementary Tables 7–9, available on the Arthritis & Rheumatology website at http://onlinelibrary.wiley.com/
doi/10.1002/art.41610/abstract). A detailed description of all pro- tocols and methods can be found in the Supplementary Methods, available on the Arthritis & Rheumatology website at http://onlin e libr ary.wiley.com/doi/10.1002/art.41610/ abstract.
All ethics committees from the participating institutions approved the protocols of both studies (see Supplementary Meth- ods). All patients signed the informed consent prior to recruitment.
Statistical analysis. Integrative unsupervised clustering was performed, with a discovery cohort, using a similarity network fusion (SNF) algorithm (16) optimized with a nested cross- validation and validated in an independent set of patients (Supplementary Figure 1, available on the Arthritis & Rheumatology website at http://onlinelibrary.wiley.com/doi/10.1002/art. 41610/abstract).
The functional modules were defined by means of weighted gene coexpression network analysis (WGCNA) (17) and characterized using immunologic terms defined by Chaussabel et al (18) and Li et al (19). Enrichments, linear regressions, and genome- wide asso- ciation (GWA) analysis were used to characterize the clusters in functional, serologic, clinical, and genetic terms. Each P value was properly corrected for multiple testing if necessary. Each time point in the inception cohort was assigned to the clusters by means of the SNF model trained with the cross- sectional cohort, and the results were summarized by patients. Details on the statistical analy sis can be found in the Supplementary Methods.
Data and code availability. Data are hosted by ELIXIR Luxembourg (20). Data are available upon request, and the access procedure is described on the data landing page (doi.
org/10.17881/th9v-xt85). Gene expression and DNA meth- ylation data can be found online at http://bioin fo.genyo.es/
preci sesad sdata/. The R code used for clustering is available online at https://github.com/bartg 01/Neste dFCV.SNF.
RESULTS
Reclassification of systemic autoimmune diseases into functional clusters independent of diagnosis, as determined by integrative molecular analysis. Genome- wide transcriptome and methylome information from a discovery set of 759 patients with systemic autoimmune diseases was used in an unsupervised protocol to perform an integrative molecular analysis.
After selection of features, that is, genes and CpGs with significantly increased variability in cases compared to controls, 4 clusters of patients were identified (see Patients and Methods). WGCNA (17) grouped the selected features into 5 gene and 3 CpG modules
(Supplementary Figure 2, available on the Arthritis & Rheumatology website at http://onlin elibr ary.wiley.com/doi/ 10.1002/art.41610/
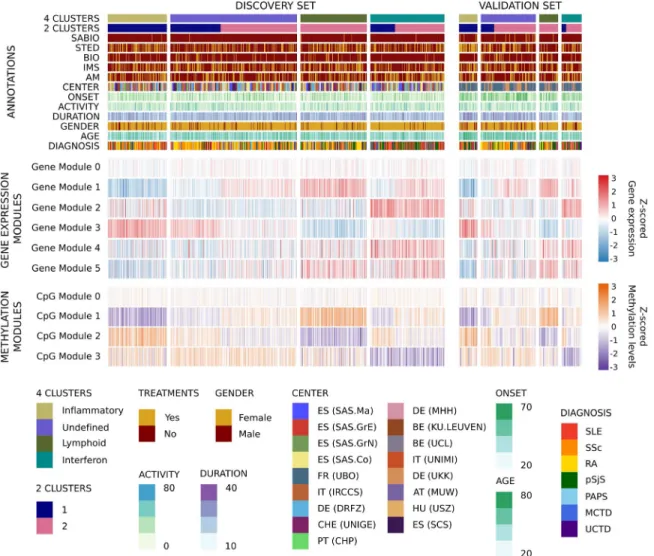
abstract). These modules differentiated the clusters obtained in the discovery set (Figure 1 and Supplementary Figure 3, available on
Figure 1. The molecular pattern of distribution of the systemic autoimmune diseases is limited to 4 validated clusters. A heatmap of the distribution of gene and CpG functional modules across the 4 autoimmune disease clusters is shown. Columns show patient groups by cluster assignment, and rows show the functional modules of the features with their scaled median values. The two subsets of patients comprising the discovery and validation sets are shown. For the transcriptome, red represents overexpression and blue represents underexpression. For the methylome, purple represents hypomethylation and orange represents hypermethylation. At the top of the figure the annotation shows 2 configurations of clusters for 4-cluster and 2-cluster groups, each of the treatment groups for each individual (systemic antibiotics [SABIO], steroids [STED], biologic agents [BIO], immunosuppressants [IMS], and antimalarials [AM]), recruitment center distribution, age at onset, disease activity as determined by physician global assessment, disease duration since diagnosis, sex, age, and diagnosis. ES (SAS.Ma) = Spain (Servicio Andaluz de Salud, Hospital Regional Universitario de Málaga); ES (SAS.GrE) = Spain (Servicio Andaluz de Salud, Complejo hospitalario Universitario de Granada [Hospital Universitario San Cecilio]); ES (SAS.GrN) = Spain (Servicio Andaluz de Salud, Complejo hospitalario Universitario de Granada [Hospital Virgen de las Nieves]); ES (SAS.Co) = Spain (Servicio Andaluz de Salud, Hospital Universitario Reina Sofía); FR (UBO) = France (Centre Hospitalier Universitaire de Brest, Hospital de la Cavale Blanche); IT (IRCCS) = Italy (Referral Center for Systemic Autoimmune Diseases, Fondazione IRCCS Ca’ Granda Ospedale Maggiore Policlinico di Milano); DE (DRFZ) = Germany (Charité);
CHE (UNIGE) = Switzerland (UNIGE); PT (CHP) = Portugal (Centro Hospitalar do Porto); DE (MHH) = Germany (Medizinische Hochschule Hannover); BE (KU.LEUVEN) = Belgium (Katholieke Universiteit Leuven); BE (UCL) = Belgium (Pôle de pathologies rhumatismales systémiques et inflammatoires, Institut de Recherche Expérimentale et Clinique, Université catholique de Louvain); IT (UNIMI) = Italy (Università degli studi di Milano); DE (UKK) = Germany (Klinikum der Universitaet zu Koeln, Cologne); AT (MUW) = Austria (Medical University Vienna); HU (USZ) = Hungary (University of Szeged); ES (SCS) = Spain (Servicio Cantabro de Salud, Hospital Universitario Marqués de Valdecilla); SLE = systemic lupus erythematosus; SSc = systemic sclerosis; RA = rheumatoid arthritis; pSjS = primary Sjögren’s syndrome; PAPS = primary antiphospholipid syndrome; MCTD = mixed connective tissue disease; UCTD = undifferentiated connective tissue disease.
the Arthritis & Rheumatology website at http://onlinelibrary.wiley.
com/doi/10.1002/art.41610/abstract). The same signatures were observed in an independent validation set of 196 patients using the discovery model (Figure 1).
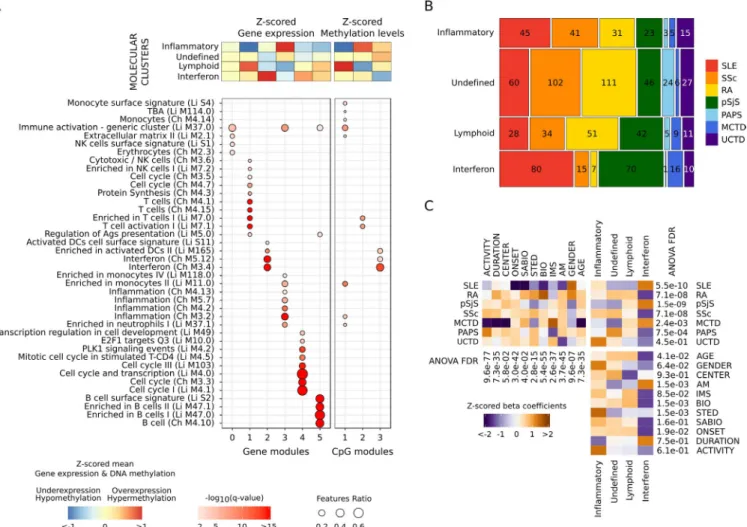
Importantly, gene and CpG modules showed high func- tional concordance according to the definitions of Chaussabel et al (18) and Li et al (19). Overexpressed gene and hypo- methylated CpG modules in the same clusters were enriched with the same functionalities (Figure 2A). An inflammatory cluster was defined by overexpression of genes and hypo- methylation of CpGs from modules driven by monocytes and
neutrophils (gene module 3 and CpG module 1). A lymphoid cluster was composed of T and natural killer (NK) cell functions (gene module 1 and CpG module 2), while an interferon clus- ter was defined by interferon, viral, and dendritic cell functions (gene module 2 and CpG module 3). One cluster had no clearly defined functional modules (undefined cluster). Other function- alities complemented the information. Cell cycle and transcrip- tional up- regulation (gene module 4) was associated with the interferon cluster, and B lymphocyte functions (gene module 5) were observed in both the lymphoid and interferon clusters (Figure 2A).
Figure 2. High- level - omic layers of information functionally characterize each of the molecular clusters of systemic autoimmune diseases, do not correspond to clinical diagnoses, and are not conditioned by confounders. A, Annotation of selected features according to the hypergeometric enrichment of their modular functional assignment. The module annotations were obtained using blood immunologic signature databases defined by Chaussabel et al (Ch) and Li et al (Li). Significant results are shown (q < 0.01). Columns show significant modules, and rows show their annotation. B, Mosaic plot showing the distribution of diseases in each cluster. Values inside each block are the number of patients. Diseases are represented by a color in columns. Horizontal sizes represent the frequency of each disease per cluster, and vertical sizes represent the proportion of samples per cluster. There are 3 pathologic clusters, the inflammatory, lymphoid, and interferon clusters, and 1 undefined cluster. C, Association of covariates with clinical diagnoses, molecular clusters, and the associations between them. The direction of the association is shown as the z- scored beta coefficient. Orange indicates enrichment; purple indicates depletion. The significance of confounder effects across groups was determined by analysis of variance (ANOVA) false discovery rates (FDRs), which are shown for each analysis. Pairwise comparisons of means were performed by Tukey’s range test (see Supplementary Figures 4–6, available on the Arthritis &
Rheumatology website at http://onlin elibr ary.wiley.com/doi/10.1002/art.41610/ abstract). TBA = unannotated module; NK = natural killer;
Ags = antigens; DCs = dendritic cells; PLK1 = polo-like kinase 1 (see Figure 1 for other definitions).
To define the extent to which the clusters depended on the proportions of blood cell types, features were analyzed in linear regression models with and models without flow cytometry infor- mation for major blood cell types obtained at the time of sampling (B lymphocytes, T lymphocytes, monocytes, and neutrophils).
Up to 98% of genes and 75% of CpGs were significantly differ- ent (false discovery rate [FDR] < 0.01) between clusters when flow cytometry information was not included in the model; 95%
(n = 1,693) and 63% (n = 1,933), respectively, remained significant when flow cytometry data were included in the model. This means that the majority of selected features did not depend exclusively on cell proportions but also depended on specific changes within the cells. Additionally, the classification can be recovered with significant accuracy by machine learning methods (Supplemen- tary Table 10, available on the Arthritis & Rheumatology website at http://onlinelibrary.wiley.com/doi/10.1002/art.41610/abstract) and with a single layer of information (Supplementary Tables 11 and 12, available on the Arthritis & Rheumatology website at http://onlinelibrary.wiley.com/doi/10.1002/art.41610/abstract).
Patients with each clinical diagnosis were found in all 4 clusters (Figure 2B). Not unexpectedly, the interferon cluster was enriched for SLE and primary SS (Figure 2C and Supple- mentary Figure 4, available on the Arthritis & Rheumatology web- site at http://onlin elibr ary.wiley.com/doi/10.1002/art.41610/
abstract), and was the only cluster enriched for any disease.
The undefined cluster had a nonsignificant increase in RA, SSc, and primary APS and included ~40% of all patients. The inflam- matory and lymphoid clusters had no enrichment. Interestingly, no cluster had an enrichment or depletion of UCTD patients (Figure 2C and Supplementary Figure 4). Most patients with MCTD, whose existence as a disease entity has been a subject of controversy (3,21,22), fell into the interferon cluster.
Covariates associated with the transcriptome and the methy- lome principal components (PCs; Supplementary Figure 7, Arthri- tis & Rheumatology website at http://onlin elibr ary. wiley.com/doi/
10.1002/art.41610/ abstract) were unevenly distributed across clinical diagnoses (Figure 2C), and did not condition the molecular clusters (Figure 2C). The significant associations that remained after clustering were related to treatment (antimalarials, biologic agents, and steroids), but the associations were due to enrich- ment for the clinical diagnoses (Figure 2C) and not the treatments themselves. For example, the interferon cluster was enriched for hydroxychloroquine- treated patients, which was driven by enrich- ment for SLE, primary SS, and MCTD (Supplementary Table 4).
No cluster was enriched for time since diagnosis (duration in Figure 2C).
Associations between CpGs and genes in the functional mod- ules revealed various regulatory relationships. Cis associations linked CpG modules with their counterpart gene modules, while trans associations did not show major relationships between homologous functional modules (Supplementary Figure 8A, available on the Arthritis & Rheumatology website at http://onlin e
libr ary.wiley.com/doi/10.1002/art.41610/ abstract). A major dif- ference between clusters was that >80% of CpGs in the inter- feron modules had cis associations with genes in the interferon gene modules, whereas most features in the rest of the modules had few cis associations (11– 17%) (Supplementary Figure 8B).
Thus, these complex relationships between methylation and gene expression modules revealed a deeper view of the molec- ular state than what a single layer may provide. Analysis of the regulation of CpG methylation, cell type– specific histone marks, and transcription factor binding site enrichment confirmed the functionalities of the CpG modules (Supplementary Figures 8C and 8D).
The undefined cluster shows a molecular pattern similar to that in healthy controls and is associated with low disease activity. To gain insight into the type of patients grouped into the undefined cluster, several analyses were per- formed. Healthy individuals were assigned to the molecular clusters by means of the discovery model. Of these, 74% were grouped into the undefined cluster, compared to 12%, 11%, and 3% assigned to the lymphoid, inflammatory, and interferon clus- ters, respectively (Figure 3A). Differential expression and methyla- tion analyses were performed between each patient cluster and healthy controls (Figures 3B and C). The inflammatory cluster had the highest number of differentially expressed genes (DEGs;
n = 2,898) and differentially methylated CpGs (DMCs; n = 8,502).
The lowest numbers were found in the interferon cluster (n = 820 DEGs and 104 DMCs) and the lymphoid cluster (n = 294 DEGs and 1,297 DMCs). In contrast, only 9 DEGs and no CpGs were observed in the undefined cluster when patients were compared with controls.
This observation could be due to 2 non– mutually exclusive reasons. The diseases most represented in this cluster, RA and SSc, could have undergoing processes in target tissues (syn- ovia and skin, respectively), with limited detection of the patho- logic molecular patterns in blood. Also, the undefined cluster might be grouping patients whose disease is in remission or who have low disease activity. To test this possibility, disease activity was compared between clusters. Disease activity indexes are designed for each clinical diagnosis through scores measuring specific clini- cal manifestations (23) and not across all diseases. For this analy- sis, 138 patients with SLE with SLE Disease Activity Index (SLEDAI) scores available and 79 patients with SS with European League Against Rheumatism Sjögren’s Syndrome Disease Activity Index (ESSDAI) scores available were included. For both diagnoses, higher disease activity scores were shown in all clusters compared to the undefined cluster (Figures 3D and E). Significant differences in the SLEDAI were found between the inflammatory cluster and the undefined cluster and between the interferon cluster and the undefined cluster (P = 0.04 and P = 0.02, respectively, by Wilcox- on’s rank sum test), and the ESSDAI showed a similar tendency.
These results suggest that low disease activity could lie behind the
undifferentiated patterns of this cluster. Given these results, the undefined cluster might be considered to include patients with a healthy- like molecular pattern, while the pathologic clusters visual- ize the molecular patterns occurring during disease activity.
To further investigate the relationship of the undefined cluster with low disease activity, molecular signatures previously corre- lated with disease activity in SLE in blood (13) and RA in synovial tissue (14) were scored for each individual in the cross- sectional Figure 3. Healthy individuals are assigned primarily to the undefined cluster, which also includes patients with systemic autoimmune disease with low disease activity and few differentially expressed genes as compared to healthy controls. A, Distribution of healthy individual assignments to the molecular classification of systemic autoimmune diseases. The pie chart shows that nearly 74% of controls are similar to patients in the undefined molecular cluster. B, Differentially expressed genes (DEGs) between clusters and healthy controls. Top, Number of shared DEGs across clusters. Bottom left, Intersections across clusters. Bottom right, Number of DEGs by cluster. C, Differentially methylated CpGs (DMCs) between clusters and healthy controls. Top, Number of shared DMCs across clusters. Bottom left, Intersections across clusters. Bottom right, Number of DMCs by cluster. D, Systemic Lupus Erythematosus Disease Activity Index (SLEDAI) scores by molecular cluster. P values are shown at the top. E, European League Against Rheumatism Sjögren’s Syndrome Disease Activity Index (ESSDAI) scores by molecular cluster. In D and E, data are shown as box plots. Each box represents the first and third quartiles. Lines inside the boxes represent the median. Whiskers represent 1.5 times the upper and lower interquartile ranges. Symbols represent individual patients.
cohort (Supplementary Figure 9, Arthritis & Rheumatology website at http://onlin elibr ary.wiley.com/doi/10.1002/art.41610/ abstract).
The undefined cluster did not show any of these molecular sig- natures, showing on average null scores for all of them. The 3 pathologic clusters showed increased scores for specific signa- tures. For both disease signatures, the inflammatory and lymphoid clusters showed increased myeloid and lymphoid lineage scores, respectively. The interferon cluster was related to the SLE inter- feron response score, and the SLE plasmablast score was slightly increased in the lymphoid and interferon clusters (Supplementary Figures 9A and B). The scores that differed between clusters were split by clinical diagnosis (Supplementary Figure 9C). This analysis showed that the molecular signatures were present in all diagno- ses grouped in each cluster, namely, that the molecular signature did not come from the individual clinical diagnoses, and confirm that the pathologic molecular clusters are mainly detected dur- ing relapses or disease activity. These results were confirmed in the inception cohort (Supplementary Figure 10, available on the Arthritis & Rheumatology website at http://onlin elibr ary.wiley.com/
doi/10.1002/art.41610/ abstract).
Characterization of clusters by additional molecular information. Data on autoantibodies, cytokines, small lipid moi- ety (natural) autoantibodies, and cell surface antigens (24) were used to characterize the clusters. The lymphoid cluster was slightly enriched for anti– citrullinated peptide, anticentromere B, and IgM anti-phosphorylcholine natural autoantibodies, while strong depletion was observed in the interferon cluster. The interferon cluster was enriched for anti– double- stranded DNA, anti- Sm, anti- SSA, anti- SSB, anti- U1 RNP, and protein- free light chains, and had increased interferon- γ– inducible 10- kd protein (IP- 10), BAFF, monocyte chemotactic protein 2 and tumor necrosis factor (TNF). The inflammatory cluster had increased matrix metallopro- teinase 8 (MMP- 8) and C- reactive protein, and high levels of inter- leukin- 1 receptor A and CXCL13 were shared by the inflammatory and interferon clusters (Figure 4A). In general, the association of serologic markers followed the molecular functions that defined the clusters. For example, the interferon cluster was associated with cytokines regulated by type I interferons, such as IP- 10 and BAFF, but also with TNF, which may induce type I interferon in some situations (25), and protein- free light chains, a novel finding, as well as several other new and previously known associations (26). On the other hand, C- reactive protein and MMP- 8 are mark- ers of acute inflammatory processes (27,28).
The cell population composition of the clusters revealed a high proportion of neutrophils in the inflammatory cluster, and a slightly elevated proportion of NK cells in the undefined cluster.
T cells, B cells, NK cells, and NK T cells were increased in the lymphoid cluster. With the exception of a slight increase in B cells, the interferon cluster was not enriched for any particular cell type (Figure 4A). Consistent with other data, these results reflect the expression of an interferon signature by all cells (29).
Clinical information was summarized into PCs (Supplemen- tary Figure 11, available on the Arthritis & Rheumatology website at http://onlinelibrary.wiley.com/doi/10.1002/art.41610/abstract) and associations were observed for each cluster (Figure 4B).
The interferon cluster was associated with some of the most extreme phenotypes, such as kidney function abnormalities (including nephritis), thrombosis, nervous system involvement, and leukopenia, in addition to minor comorbidities. The inflam- matory cluster was enriched for fibrosis complications in both the skin and the musculoskeletal system, in addition to kidney- related clinical features. The lymphoid cluster was enriched for less aggressive phenotypes, including dyslipidemias and gas- trointestinal manifestations, such as abdominal pain, diarrhea, and constipation. An association with sicca syndrome was also found in this cluster. Some clinical complications were found in the healthy- like cluster, mainly related to fibrosis, skin manifesta- tions, and arthritis, consistent with the predominance of RA and SSc in this cluster.
The association analysis was also performed for each of the main clinical diagnoses (SLE, RA, SS, and SSc), each divided into the molecular clusters. Despite the reduced number of sam- ples for some subgroups, such as the number of RA patients in the interferon cluster (Figure 2B), most of the associations previ- ously shown were observed for ≥1 clinical diagnosis, and some were observed for multiple clinical diagnoses. For example, dif- ferential cell type proportions in the inflammatory and lymphoid clusters were shared across all diseases. Enrichment for BAFF and IP- 10 cytokines in the interferon cluster was shared by SLE, RA, and SS, and enrichment for MMP- 8 in the inflammatory clus- ter was observed across all diagnoses. This result supports the notion that differences found between clusters are shared across individual clinical diagnoses (Supplementary Tables 13– 17, availa- ble on the Arthritis & Rheumatology website at http://onlin elibr ary.
wiley.com/doi/10.1002/art.41610/ abstract).
A GWA analysis was performed for each cluster. The only signal with a genome- wide significance level (P < 5 × 10⁻⁸) came from alleles located in HLA class II genes, covering HLA– DRA, DRB5, DRB1, DQA1, DQB1, DQA2, DQB2, and DOB genes in the interferon cluster (Supplementary Figure 12, available on the Arthritis & Rheumatology website at http://onlin elibr ary.wiley.
com/doi/10.1002/art.41610/ abstract). This specific and class II– limited association contrasted with the wider HLA associ- ation usually observed in Europeans when the analyses were performed by disease (Supplementary Figure 13, available on the Arthritis & Rheumatology website at http://onlin elibr ary.wiley.
com/doi/10.1002/art.41610/ abstract). The weak HLA asso- ciation found in the other clusters was located toward the HLA class I gene region. This result implies that the genetic associ- ations observed for some systemic autoimmune diseases (i.e., SLE) actually reflect the molecular mechanisms occurring only in those individuals whose molecular disease pathway is the type I interferon pathway. A GWA analysis between clusters, corrected
for clinical diagnosis, showed that the significant genetic associ- ations remained. Thus, the genetic associations do not depend on the underlying clinical diagnosis (data not shown) but on the cluster the patients belong to.
To expand our knowledge about the relationship between genetics and the differential features driving the clusters, expres- sion quantitative trait locus (eQTL) and methylation QTL (mQTL) analyses were performed on defined DEGs and DMCs. Overall, Figure 4. Association of each systemic autoimmune disease cluster with specific serologic, cellular, and clinical information. A, Heatmap showing hierarchical clustering of serologic and flow cytometry data in the 4 clusters. The serologic information included data on autoantibodies, cytokines, and antibodies against small lipid moieties or natural autoantibodies. B, Principal components (PC) analysis of clinical data. The PCs most significantly associated with each cluster are shown. Clinical items that had a significant contribution to each significant PC (where the observed contribution was higher than the expected contribution) are depicted. The PCs and clinical features were sorted by hierarchical clustering.
Values are Z- scored beta coefficients determined by analysis of variance (ANOVA) (false discovery rate [FDR] < 0.01). Pairwise comparisons of means were performed by Tukey’s range test (see Supplementary Figures 14 and 15, available on the Arthritis & Rheumatology website at http://onlin elibr ary.wiley.com/doi/10.1002/art.41610/ abstract). CCP2 = anti– cyclic citrullinated peptide antibody; CENT B = anticentromere protein B; DNA = anti– double- stranded DNA; SM = anti- Sm; SSB = anti- SSB/anti- La; U1 RNP = anti- U1 RNP; PFLC = protein- free light chain;
SSA = anti- SSA/Ro; TNF = tumor necrosis factor; MCP- 2 = monocyte chemotactic protein 2; IP- 10 = interferon- γ– inducible 10- kd protein;
IL- 1RA = interleukin- 1 receptor A; CRP = C- reactive protein; MMP- 8 = matrix metalloproteinase 8; PC.IGM = IgM anti-phosphorylcholine;
NK = natural killer; Lab = laboratory finding; Gastro = gastrointestinal; CNS = central nervous system; BMI = body mass index.
97,854 single- nucleotide polymorphisms (SNPs) were associated (FDR < 1 × 10⁻⁵) with 1,208 DEGs, while 107,059 SNPs were associated with 1,289 DMCs. In summary, 35% of the DEGs were associated with ≥1 SNP, including cis and trans associations (36%, 30%, and 30% for the inflammatory, lymphoid, and inter- feron clusters, respectively). Regarding DMCs, 21% were asso- ciated with ≥1 SNP (20%, 13%, and 64% for the inflammatory, lymphoid, and interferon clusters, respectively). At an r2 > 0.80, associated SNPs were grouped into 12,916 independent eQTL and 17,608 mQTL linkage disequilibrium blocks. Most genes and CpGs associated with ≥1 SNP were also associated with
>1 linkage disequilibrium block (Supplementary Figure 16A, the Arthritis & Rheumatology website at http://onlin elibr ary.wiley.com/
doi/10.1002/art.41610/ abstract). On average, 16% of eQTL and 17% of mQTL linkage disequilibrium blocks were tagged with
≥1 SNP recorded in the GWA study catalog. While some SNPs were shared across clusters, many were uniquely linked to indi- vidual molecular clusters (Supplementary Figures 16B and C).
Most SNPs within the linkage disequilibrium blocks had previously been associated with autoimmune diseases and shared across clusters, especially for mQTLs where significant enrichment was found as compared with the entire GWA study catalog (Supple- mentary Table 18, Arthritis & Rheumatology website at http://onlin e libr ary.wiley.com/doi/10.1002/art.41610/ abstract).
Stability of pathologic molecular patterns over time.
It is possible that the aberrant clusters represent a disease state of the individual patients at a given point in time and that patients could “move” to different clusters as disease progresses. Further- more, the long disease duration combined with years of treatment
Figure 5. The pathologic molecular patterns of systemic autoimmune diseases are stable in time and related to relapsing disease. A and B, Jaccard stability index between molecular cluster assignments at baseline and at 6 months (A) and between molecular cluster assignments at baseline and at 14 months (B). Color intensity and size of the circles represent the Jaccard index for each pair of time points and cluster assignment. C, Classification of patients according to cluster assignments at the 3 different time points. Stable patients were those assigned to the same cluster at all 3 time points; relapse– remission patients were those who were assigned to only 1 pathologic cluster but were assigned to the undefined cluster at any given time point; and unstable patients were those who were assigned to more than 1 pathologic cluster throughout the 3 time points. D, Alluvial plot of molecular cluster assignments over the 3 time points for the relapse– remission patients.
(12 years on average since diagnosis for the cross- sectional cohort) could lie behind the configuration of the clusters that we observed. In order to determine whether the clusters could be observed in patients with recently diagnosed disease and if these were stable over time, patients from an independent and newly recruited inception cohort were assigned to clusters using the dis- covery model.
Stability values for patients with information at recruitment and at 6 months (n = 103) or 14 months (n = 78) showed sim- ilar results (Figures 5A and B). In both comparisons, most of the patients remained in the same cluster after follow- up (62– 63%), and 33% moved from a pathologic cluster to the undefined clus- ter, or vice versa. Only 4% of the patients moved between different pathologic clusters. Analysis of patients who had data available for all 3 time points (n = 68) confirmed this. Only 4 patients (6%) moved between pathologic clusters, while 33 patients (48%) remained in the same cluster throughout 14 months (Figure 5C). The remain- ing patients (46%) showed a relapse– remission dynamic typical of the diseases: their pathologic clusters were stable (i.e., they were never assigned to a different pathologic cluster), but they were assigned at a given point in time to the undefined (healthy- like) cluster (Figures 5C and D).
DISCUSSION
Using an unsupervised model integrating transcriptome and methylome data, we observed 3 pathologic clusters of sys- temic autoimmune diseases that we describe as inflammatory, lymphoid, and interferon clusters. Additionally, an undefined clus- ter was observed, where most healthy controls were assigned, with very few DEGs and no DMCs as compared to controls, and where patients with low disease activity were grouped. Further- more, gene signatures previously shown to correlate with disease activity in SLE and RA associated exclusively with the 3 pathologic clusters, supporting the notion that patients were classified into the pathologic clusters during active disease periods or states.
Other layers of molecular information followed the molecu- lar functions associated with the pathways that differentiated the clusters. For instance, differences in cell type proportions and specific types of cytokines, as well as clinical characteristics, differentiated the clusters. Importantly, we showed that the pro- portions of cell types did not exclusively determine the clusters themselves, but made an important contribution. In addition, the GWA analysis suggested that clustering leads to homogenization of the individuals; and particularly only for those belonging to the interferon cluster, the HLA class II locus is relevant genetically.
Therefore, the association reflects the reliability of the classifica- tion method, grouping together patients with different systemic autoimmune diseases who share common pathologic molec- ular patterns that might be driven by a common genetic back- ground, which is not shared with the other clusters. The small cohort of patients available, by GWA study standards, suggests
that additional genetic analysis using our clustering approach in larger groups of patients might lead to the discovery of additional genes that are relevant during active disease states. Instead, we performed eQTL and mQTL analyses and observed that the most significant loci corresponded to genes and polymorphisms previ- ously associated with different autoimmune diseases according to the GWA study catalog.
The results from the independent inception cohort suggest that cluster assignment does not depend on time since diagnosis or on treatment and is stable over time. This implies that each patient has a single pathologic molecular pathway out of 3 pos- sible pathways. The predominance of patients assigned to the healthy- like cluster in the inception cohort reflects a decision made during the design of the study, namely, that patients would not be heavily treated at baseline in order to analyze if posterior ther- apy would interfere with the results. This criterion resulted in a large number of patients with low disease activity remaining in the healthy- like cluster. Patients were treated as needed during the follow- up period, supporting the notion that therapy did not con- dition the structure of the clusters. The large number of patients assigned to the healthy- like cluster in the cross- sectional cohort is also partly explained by the inclusion criteria that required patients to be receiving low doses of treatments, particularly steroids, in order to avoid biases in gene expression, which are usually found in patients undergoing relapse control.
The molecular analyses in this study were performed on whole blood, which is not the final target tissue of some diseases. How- ever, most cell types implicated in autoimmune pathologies infil- trate tissues from blood, and therefore some molecular signatures from tissues can also be detected in blood (30,31), although not all (32). Previous analyses in SLE (13) have shown that blood molec- ular signatures correlate with disease activity, and those same sig- natures were associated to a different extent with the 3 pathologic clusters. Additionally, 2 disease activity– correlated gene expres- sion signatures in RA synovial tissue (14) were associated with the inflammatory and lymphoid clusters, supporting the notion that tissue signatures might be visible in whole blood. However, addi- tional tissue– blood paired sample analyses are needed to confirm this finding. Furthermore, since patients with active disease were found in all 3 clusters, it is clear that disease activity does not define each of the pathologic clusters. The healthy- like cluster can be viewed as a remission cluster, supporting the reasoning that during active disease patients may have 1 of 3 possible pathologic patterns, and possibly 1 of 3 potential therapeutic approaches.
Interventional clinical trials can use the modeling method presented here with much fewer patients (even just 1 patient) to assign each patient to a cluster and follow up on disease pro- gression in relation to drugs to be tested. For SLE it has been shown that patients with a positive interferon score respond better to an anti– interferon- α monoclonal antibody than patients without a positive interferon score (33). Accordingly, patients in the inter- feron cluster, regardless of their clinical diagnosis, might respond
to an anti- interferon drug better than patients in the other clus- ters. In addition, since not all patients with an interferon signature respond to such treatment (33), it is feasible that many of these patients belong to the inflammatory cluster, which also has a small increase in interferon signature genes (gene module 2 in Figure 1), and would require additional treatment to limit the inflammatory process.
The door is open to have a closer look and identify endo- phenotypes or pathotypes that relate to these blood clusters.
Future single- cell tissue studies may distinguish cell- specific and tissue- specific mechanisms that substratify patients within a particular cluster. For example, we observed that the inflam- matory and interferon clusters are enriched for kidney disease, leading to the question of whether the kidney disease of the patients in each cluster may show different pathotypes. Inter- estingly, some patients with erosive arthritis were grouped into the lymphoid cluster (PC3 and PC4) (Figure 4B). Accordingly, this cluster was associated with the lymphoid synovial molecular sig- nature described in RA, a molecular signature associated with joint damage progression (14). Therefore, in our model, blood is indeed recognizing molecular signatures of clinical relevance, and with the proper model can be used to follow a patient’s disease progression.
This study shows for the first time, and in an unprecedented number of individuals, that systemic autoimmune disease patients with 7 different clinical diagnoses share molecular clusters defined by specific molecular patterns that are stable over time. The clusters have specific clinical and serologic characteristics, but also have quite different regulatory and genetic landscapes. Our findings suggest that each patient’s illness might be defined by 1 of 3 different molecular pathways. The results obtained in this study are a first step toward laying the foundations for personal- ized medicine in systemic autoimmune diseases.
ACKNOWLEDGMENTS
The authors would like to particularly express their gratitude to the patients, nurses, and many others who helped directly or indirectly in the conduct of this study. This work is supported by ELIXIR Luxembourg via its data hosting service.
AUTHOR CONTRIBUTIONS
All authors were involved in drafting the article or revising it critically for important intellectual content, and all authors approved the final version to be published. Dr. Alarcón- Riquelme had full access to all of the data in the study and takes responsibility for the integrity of the data and the accuracy of the data analysis.
Study conception and design. Laigle, Beretta, Ballestar, McDonald, Pers, Alarcón- Riquelme.
Acquisition of data. Makowska, Le Lann, Jamin, Rodríguez- Ubreva, García- Gómez, Buttgereit, Mueller, Lesche, Hernandez- Fuentes, Juarez, Rowley, White, Marañón, Gomes Anjos, Varela, Aguilar- Quesada, Garrancho, López- Berrio, Rodriguez Maresca, Navarro- Linares, Almeida, Azevedo, Brandão, Campar, Faria, Farinha, Marinho, Neves, Tavares, Vasconcelos, Trombetta, Montanelli, Vigone, Alvarez- Errico, Li, Thiagaran,
Blanco Alonso, Corrales Martínez, Genre, López Mejías, Gonzalez- Gay, Remuzgo, Ubilla Garcia, Cervera, Espinosa, Rodríguez- Pintó, De Langhe, Cremer, Lories, Belz, Hunzelmann, Baerlecken, Kniesch, Witte, Lehner, Stummvoll, Zauner, Aguirre- Zamorano, Barbarroja, Castro- Villegas, Collantes- Estevez, de Ramon, Díaz Quintero, Escudero- Contreras, Fernández Roldán, Jiménez Gómez, Jiménez Moleón, Lopez- Pedrera, Ortega- Castro, Ortego, Raya, Artusi, Gerosa, Meroni, Schioppo, De Groof, Ducreux, Lauwerys, Maudoux, Cornec, Devauchelle- Pensec, Jousse- Joulin, Jouve, Rouvière, Saraux, Simon, Alvarez, Chizzolini, Dufour, Wynar, Balog, Bocskai, Deák, Dulic, Kádár, Kovács, Cheng, Gerl, Hiepe, Khodadadi, Thiel, de Rinaldis, Rao, Benschop, Chamberlain, Dow, Ioannou, Marovac, Renaudineau, Borghi, Frostegård.
Analysis and interpretation of data. Barturen, Babaei, Català- Moll, Martínez- Bueno, Martorell- Marugán, Carmona- Sáez, Toro- Domínguez, Carnero- Montoro, Teruel, Kerick, Acosta- Herrera, Kageyama, Hayat, Wojcik, Martín.
ADDITIONAL DISCLOSURES
Authors Babaei, Makowska, Kageyama, Buttgereit, Hayat, Mueller, Lesche, and McDonald are employees of Bayer. Authors Hernandez- Fuentes, Juarez, Rowley, White, Ioannou, and Marovac are employees of UCB. Author Chamberlain was an employee of UCB at the time of the study and is now an employee of Merck. Author de Rinaldis is an employee of Sanofi. Author Rao is an employee of Sanofi- Genzyme.
Authors Benschop and Dow are employees of Eli Lilly. Author Laigle is an employee of Institut de Recherches Internationales Servier. Author Wojcik is an employee of QuartzBio.
REFERENCES
1. Tani C, D’Aniello D, Delle Sedie A, Carli L, Cagnoni M, Possemato N, et al. Rhupus syndrome: assessment of its prevalence and its clinical and instrumental characteristics in a prospective cohort of 103 SLE patients [review]. Autoimmun Rev 2013;12:537– 41.
2. Alarcon- Segovia D, Cardiel MH. Comparison between 3 diagnostic criteria for mixed connective tissue disease: study of 593 patients.
J Rheumatol 1989;16:328– 34.
3. Sharp GC, Irvin WS, Tan EM, Gould RG, Holman HR. Mixed con- nective tissue disease: an apparently distinct rheumatic disease syn- drome associated with a specific antibody to an extractable nuclear antigen (ENA). Am J Med 1972;52:148– 59.
4. Skopouli FN, Drosos AA, Papaioannou T, Moutsopoulos HM.
Preliminary diagnostic criteria for Sjogren’s syndrome. Scand J Rheumatol Suppl 1986;61:22– 5.
5. Wilson WA, Gharavi AE, Koike T, Lockshin MD, Branch DW, Piette JC, et al. International consensus statement on preliminary classifi- cation criteria for definite antiphospholipid syndrome: report of an international workshop. Arthritis Rheum 1999;42:1309– 11.
6. Li YR, Li J, Zhao SD, Bradfield JP, Mentch FD, Maggadottir SM, et al. Meta- analysis of shared genetic architecture across ten pediat- ric autoimmune diseases. Nat Med 2015;21:1018– 27.
7. Baechler EC, Batliwalla FM, Karypis G, Gaffney PM, Ortmann WA, Espe KJ, et al. Interferon- inducible gene expression signature in peripheral blood cells of patients with severe lupus. Proc Natl Acad Sci U S A 2003;100:2610– 5.
8. Bennett L, Palucka AK, Arce E, Cantrell V, Borvak J, Banchereau J, et al. Interferon and granulopoiesis signatures in systemic lupus erythematosus blood. J Exp Med 2003;197:711– 23.
9. Peterson LS, Nelson AM, Su WP. Classification of morphea (local- ized scleroderma). Mayo Clin Proc 1995;70:1068– 76.
10. Murphy D, Mattey D, Hutchinson D. Anti- citrullinated protein anti- body positive rheumatoid arthritis is primarily determined by rheuma- toid factor titre and the shared epitope rather than smoking per se.
PLoS One 2017;12:e0180655.
11. Morris DL, Fernando MM, Taylor KE, Chung SA, Nititham J, Alarcón- Riquelme ME, et al. MHC associations with clinical and autoantibody manifestations in European SLE. Genes Immun 2014;15:210– 7.
12. Toro- Domínguez D, Martorell- Marugán J, Goldman D, Petri M, Carmona- Sáez P, Alarcón- Riquelme ME. Stratification of systemic lupus erythematosus patients into three groups of disease activ- ity progression according to longitudinal gene expression. Arthritis Rheumatol 2018;70:2025– 35.
13. Banchereau R, Hong S, Cantarel B, Baldwin N, Baisch J, Edens M, et al. Personalized immunomonitoring uncovers molecular networks that stratify lupus patients. Cell 2016;165:551– 65.
14. Humby F, Lewis M, Ramamoorthi N, Hackney JA, Barnes MR, Bombardieri M, et al. Synovial cellular and molecular signatures strat- ify clinical response to csDMARD therapy and predict radiographic progression in early rheumatoid arthritis patients. Ann Rheum Dis 2019;78:761– 72.
15. Van der Kroef M, van den Hoogen LL, Mertens JS, Blokland SL, Haskett S, Devaprasad A, et al. Cytometry by time of flight iden- tifies distinct signatures in patients with systemic sclerosis, sys- temic lupus erythematosus and Sjogrens syndrome. Eur J Immunol 2020;50:119– 29.
16. Wang B, Mezlini AM, Demir F, Fiume M, Tu Z, Brudno M, et al.
Similarity network fusion for aggregating data types on a genomic scale. Nat Methods 2014;11:333– 7.
17. Langfelder P, Horvath S. WGCNA: an R package for weighted corre- lation network analysis. BMC Bioinformatics 2008;9:559.
18. Chaussabel D, Quinn C, Shen J, Patel P, Glaser C, Baldwin N, et al. A modular analysis framework for blood genomics studies:
application to systemic lupus erythematosus. Immunity 2008;29:
150– 64.
19. Li S, Rouphael N, Duraisingham S, Romero- Steiner S, Presnell S, Davis C, et al. Molecular signatures of antibody responses derived from a systems biology study of five human vaccines. Nat Immunol 2014;15:195– 204.
20. ELIXIR Luxembourg. URL: https://elixir-luxembourg.org/.
21. Alarcon- Segovia D. Mixed connective tissue disease: some state- ments [editorial]. Clin Rheumatol 1982;1:81– 3.
22. Ciang NC, Pereira N, Isenberg DA. Mixed connective tissue disease- enigma variations? Rheumatology (Oxford) 2017;56:326– 33.
23. Barturen G, Beretta L, Cervera R, van Vollenhoven R, Alarcón- Riquelme ME. Moving towards a molecular taxonomy of autoim- mune rheumatic diseases [review]. Nat Rev Rheumatol 2018; 14:
75– 93.
24. Jamin C, Le Lann L, Alvarez- Errico D, Barbarroja N, Cantaert T, Ducreux J, et al. Multi- center harmonization of flow cytometers in the context of the European "PRECISESADS" project [review].
Autoimmun Rev 2016;15:1038– 45.
25. Yarilina A, Ivashkiv LB. Type I interferon: a new player in TNF signal- ing. Curr Dir Autoimmun 2010;11:94– 104.
26. Reynolds JA, Briggs TA, Rice GI, Darmalinggam S, Bondet V, Bruce E, et al. Type I interferon in patients with systemic autoimmune rheu- matic disease is associated with haematological abnormalities and specific autoantibody profiles. Arthritis Res Ther 2019;21:147.
27. Sproston NR, Ashworth JJ. Role of C- reactive protein at sites of inflammation and infection [review]. Front Immunol 2018;9:754.
28. Manicone AM, McGuire JK. Matrix metalloproteinases as modula- tors of inflammation. Semin Cell Dev Biol 2008;19:34– 41.
29. Arazi A, Rao DA, Berthier CC, Davidson A, Liu Y, Hoover PJ, et al.
The immune cell landscape in kidneys of patients with lupus nephri- tis. Nat Immunol 2019;20:902– 14.
30. Peterson KS, Huang JF, Zhu J, D’Agati V, Liu X, Miller N, et al.
Characterization of heterogeneity in the molecular pathogenesis of lupus nephritis from transcriptional profiles of laser- captured glomer- uli. J Clin Invest 2004;113:1722– 33.
31. Gardner H, Shearstone JR, Bandaru R, Crowell T, Lynes M, Trojanowska M, et al. Gene profiling of scleroderma skin reveals robust signatures of disease that are imperfectly reflected in the transcript profiles of explanted fibroblasts. Arthritis Rheum 2006;54:1961– 73.
32. Van Baarsen LG, Wijbrandts CA, Timmer TC, van der Pouw Kraan TC, Tak PP, Verweij CL. Synovial tissue heterogeneity in rheumatoid arthritis in relation to disease activity and biomarkers in peripheral blood. Arthritis Rheum 2010;62:1602– 7.
33. Khamashta M, Merrill JT, Werth VP, Furie R, Kalunian K, Illei GG, et al. Sifalimumab, an anti- interferon- α monoclonal antibody, in moderate to severe systemic lupus erythematosus: a ran- domised, double- blind, placebo- controlled study. Ann Rheum Dis 2016;75:1909– 16.