E ARLY DIAGNOSIS AND OBJECTIVE ASSESSMENT OF PATIENTS WITH NEURAL
AND CARDIOVASCULAR DISEASES
Ákos Jobbágy
Thesis (Doctor of the Hungarian Academy of Sciences)
2005.
Table of contents
Introduction……….4
1 Movement analysis... 9
1.1 History, methods, device types ... 9
1.2 Image-based movement analysis... 14
1.2.1 Marker-based analysis... 14
1.2.2 Image processing to determine the marker positions ... 16
1.2.3 The necessary sampling rate for recording human movements ... 17
1.3 Devices ... 19
1.3.1 General purpose motion analysers ... 19
1.3.2 A device for routine clinical applications (PAM) ... 21
1.3.3 Resolution, accuracy and precision of motion analysers ... 22
1.4 Biomedical/clinical applications of movement analysis ... 26
1.4.1 Rehabilitation ... 27
1.4.2 Assessment of the actual state of patients with neural diseases... 29
1.4.3 Long-term monitoring of the locomotor activity of rats ... 30
2 Characterising the motor functions of patients based on movement analysis... 32
2.1 Movement patterns tested in our research... 32
2.1.1 Finger-tapping ... 32
2.1.2 Hand tapping ... 34
2.1.3 Pinching and circling... 34
2.1.4 Twiddling ... 35
2.1.5 Pointing movements... 36
2.1.6 Tap heel on ground... 37
2.1.7 Hand tremor... 37
2.2 Feature extraction methods I suggest ... 39
2.2.1 Parameters to characterise movements ... 40
2.2.2 Finger-tapping and hand-tapping ... 43
2.2.3 Twiddling ... 45
2.2.4 Pinching and circling... 46
2.2.5 Slow- and fast pointing ... 49
2.2.6 Tap heel on ground... 50
2.2.7 Hand tremor... 50
2.3 Human factors influencing the movements recorded... 51
3 Early detection and staging of Parkinsonian patients... 53
3.1 Rating scales... 54
3.2 Assessment based on movement analysis ... 55
3.3 The subjects and patients tested ... 56
3.4 Recordings... 58
3.4.1 Finger-tapping ... 58
3.4.2 Twiddling ... 63
3.4.3 Pinching and circling... 64
3.5 Staging of patients... 65
3.5.1 The finger-tapping test ... 65
3.5.2 Twiddling ... 70
3.5.3 Pinching and circling... 71
3.5.4 Personalisation of tests ... 72
3.6 Conclusions ... 72
4 Assessment of stroke patients ... 74
4.1 The tested subjects ... 74
4.2 Recordings... 75
4.3 Staging of patients... 85
4.3.1 Comparison to conventional ratings... 85
4.3.2 The smoothness of the movement... 88
4.3.3 Bad sequence during the finger-tapping test ... 89
4.3.4 Assessment of increasing performance of patients ... 90
4.4 Conclusions ... 91
5 Non-invasive methods for blood pressure measurement ... 92
5.1 The oscillometric method... 93
5.2 Other methods ... 95
5.3 Accuracy of non-invasive methods ... 95
5.4 Testing oscillometric devices ... 97
6 New method for non-invasive blood pressure measurement ... 100
6.1 Averaging ... 100
6.2 The photoplethysmographic (PPG) signal as an aid ... 101
6.2.1 Pulse wave velocity... 103
6.2.2 Time delay between ECG and PPG signal... 104
6.2.3 PPG signal during slow inflation and deflation ... 105
6.3 The suggested new method ... 109
6.3.1 Testing the relaxation before the measurement... 110
6.3.2 The cuff pressure profile ... 112
6.3.3 Determining the systolic pressure ... 113
6.3.4 Determining the diastolic pressure... 114
6.3.5 Testing the proper placement of the cuff ... 115
6.4 Results using the suggested method... 116
7 New results of the dissertation ... 118
8 References ... 122
9 Acknowledgement... 131
10 Appendix ... 133
Introduction
Many cardiovascular and neural diseases remain undetected until the symptoms are stressed. Usually this means a progressive stage of the disease. Early diagnosis and the corre- sponding treatment would mean a better quality of life for the patient and a more effective and cost saving health care system for the society.
As the expected life time increases the problem of sustaining the good health of the society needs to be addressed. World life expectancy more than doubled over the past two centuries, from roughly 25 years to about 65 for men and 70 for women. The change in life expectancy for women published in [Oeppen and Vaupel, 2002] is shown in Figure 1.
Figure 1 Change in life expectancy for women in 5 countries.
It is estimated that life expectancy further increases. National health care systems should be accommodated; the prevalence rates of many diseases substantially change over age. In Japan, where the expected life time is longer than in other developed countries (78 year for men and 85 for women in 2002), sustaining of good health is promoted by home health monitoring [Togawa, 1998]. The average medical expenditure per person is signifi- cantly higher for the elderly than for younger people. In Japan the increase in national medical expenditure by far exceeded the increase in GDP in the last decade of the XXth century.
Home health monitoring accounts for an increasing share in Japan’s medical expenditure. It is estimated that in the United States 20 – 30 % of patients receive inappropriate care [Starfield, 2000]. Many diseases can be treated more effectively and at a lower cost if early signs are detected. The continuous monitoring requires appropriate instrumentation, including sensors
and signal processing. However, the monitored person gets a better care only if the processed patient data are seen by medical experts in time.
In Hungary cardiovascular diseases are the leading cause of death, being responsible for about half of the deaths [Farsang 1997], [www.bel2.sote.hu/hipertonia], [Nagy 2002]. Fur- thermore, hypertonia and arteriosclerosis affect a high percentage of the population. It is esti- mated that 30 % of the Hungarian population has hypertonia, over age 65 this ratio increases to approximately 65 % [Losonczy and Rosivall 1997]. Diagnosis in the early stage would make it possible to start medication and treatment to prevent the deterioration of the patients.
The presently existing blood pressure meters either require trained operator or do not assure accurate measurement [NHBPEP/NHLBI/AHA Working Meeting on Blood Pressure Meas- urement, 2002]. An easy-to-use and accurate device would help in early detection and home self-monitoring. This latter would mean an effective aid for the general practitioner to monitor the patient; giving a feedback for treatment and medication. Good solutions exist to transmit medical recordings of the patient to the doctor. [Kékes, 2003] describes a tele-ECG system, [Celler et al., 1999] shows that home telecare improves care and reduces cost. Further advan- tage of such systems is that the medical expert and the patient do not have to be at the same place. [Anliker et al., 2004] describes a wearable device that permanently monitors physio- logical parameters.
The early diagnosis of Parkinson’s disease and the continuous monitoring of the pa- tients’ state would result in a more effective medication. The diagnosis – especially the early diagnosis – of neural diseases is a sophisticated problem. There are symptoms common for different neural diseases. Elderly people above age 65 may exhibit symptoms of parkinsonism (Parkinson’s syndrome) in mild form even if they are not affected by the disease. [Duncan and Wilson, 1989] noticed that nearly one-half of the neurologically normal elderly seen in a community had at least one feature of parkinsonism. At least 20 % of Parkinsonian patients are misdiagnosed in the early stage [Findley, 1993], [Groset, 2001], [Schrag et al., 2002]. This usually means a wrong medication causing unnecessary discomfort to the patient and ex- penses to society. In the United States Parkinson’s disease affects more than one million peo- ple. 15 % of Parkinsonian patients are diagnosed under 40, incidence increases with age [www.pdf.org/AboutPDF/index.cfm, the web page of the Parkinson’s Disease Foundation].
The research work co-ordinated and led by me at the Department of Measurement and Information Systems, Budapest University of Technology and Economics has aimed at objec- tively characterising persons’ state based on the measured data. The research work has been
aided by medical doctors. Co-operation with the Semmelweis University, Szt. Imre Hospital, National Rehabilitation Institute and Szt. János Hospital has been extremely helpful.
The human control mechanisms are very sophisticated and the related models are rarely quantitative. For the engineer it is rather unusual to experience that even the same per- son under seemingly identical conditions exhibits different observables without a known rea- son. Instead of strict rules being applied for non-living systems, we can usually identify ten- dencies and relate probabilities to them at the present level of knowledge while modelling living systems. The more we know of the human organism the better we realise that its opera- tion is difficult to understand and describe by the general methods originally developed for non-living systems. Many parallel control loops exist, the majority of relations are nonlinear and taking into account all effects that influence a certain parameter would result in a model too complex to be handled by the present computational systems and also by the present ex- perts. Certainly the ability of both experts and computers to handle complex problems will increase thus leading to a better understanding of biological systems and human organism.
The complex models will be built up by using the simplified ones created and validated by contemporary researchers.
This dissertation summarises the results of the research work in two fields. The first is the analysis of human movement in order to objectively diagnose and assess the actual state of patients with neural diseases. The score of a patient performing movement patterns is in- fluenced also by the central nervous system not only by the muscles. This is the reason why detailed analysis of finger-, hand- and arm movements can reveal neural diseases and also help determine the actual state of patients. This latter could be helpful to set the optimal medication. The research work led by me has resulted in a better understanding of human movements and made possible to define the measurement technique and feature extraction algorithms necessary to quantify the performance during movement. The results can be ap- plied in the clinical routine as well. This required the development of a motion analyser that is affordable for this purpose. The passive marker-based motion analysis is an appropriate procedure as the markers are lightweight thus do not influence the movement tested. The cheap analyser and the assessment method my research group offers to clinicians are sup- posed to be applicable to gather data from a great number of patients. The evaluation of such data will lead to an objective diagnosing tool for screening tests and early diagnosis. The method has been applied to assess also stroke patients during rehabilitation.
The second field in which the dissertation gives valuable results aims at testing the cardiovascular system. Hypertension is called the “silent killer”, as it causes no easily detect-
able primer symptoms. When the secondary symptoms appear and the patient visits the doc- tor, organs might be severely and incurably damaged. Regular check-up of the population would be necessary. Devices applicable for self measurement [O’Brien, 2001 (b)] and provid- ing the necessary accuracy would help involve people to care for their own health. Self meas- urement is advantageous also for patients already diagnosed to have hypertension. The major- ity of present day (semi)automatic blood pressure meters offered for home use apply the oscil- lometric technique. This method detects the mean pressure in the artery and calculates only an estimate of the systolic and of the diastolic pressure. British and American standards for home blood pressure meters allow substantial deviation between the displayed values and the results measured by a trained operator manually [O’Brien et al., 2001], [O’Brien, 2001(a)], [Asmar et al., 2000]. Self blood pressure measurement might be complementary to 24-hour ambulatory blood pressure monitoring (AABPM). Usually oscillometric blood pressure meters give cor- rect results for those with normal values and may give erroneous results for those with car- diovascular diseases. The method I suggest assures accurate systolic and diastolic readings without a trained operator. Furthermore, the state of the arteries can also be assessed during the measurement. This parameter is usually more important than the systolic and diastolic pressures. For the widespread application a device has been developed that can be used by persons at home without the aid of medical experts. The results of daily measurements are stored in the device for two months so that the general practitioner gets detailed and objective information about the patient’s state between visits. Should the device detect an emergency situation or should the trend of the daily measurements show a possible deterioration of the patient’s state, the device is able to transmit a request for attention via mobile phone. If the national health care system equipped patients living at home alone with these devices then patients would get a better, more efficient health service. Furthermore, operating such a sys- tem would cost much less for the society.
The national health care system needs to be modified to improve the presently inaus- picious health state of Hungarian people. My results offer the technical background for it in two fields.
The first chapter gives an introduction to image-based movement analysis. A brief his- tory is given, followed by an overview of the devices used in biolocomotion studies. The overview comprises the Passive Marker-based Analyser for Movement, PAM, developed at the Dept. Measurement and Information Systems, Budapest University of Technology and Economics. The chapter summarises the biomedical applications of image-based movement analysis.
The second chapter describes the movement patterns and the feature extraction meth- ods I have been using to characterise the motor functions of patients. I suggest a scoring method applicable to the movement patterns. The method is clinically applicable; it is ex- pected to help understand the effect of different neurological diseases on human motor con- trol.
Chapters 3 and 4 give the details of the research I have been conducting and co- ordinating in the field of movement analysis. Chapter 3 describes the early detection and stag- ing of Parkinsonian patients. Chapter 4 summarises a measurement method to assess the ac- tual state of stroke patients during rehabilitation.
Chapters 5 – 6 concern indirect blood pressure measurement. Chapter 5 is an overview of presently used procedures with an emphasis on the oscillometric method. Chapter 6 depicts my research work that resulted in a new indirect blood pressure measurement method. The method exploits the extra information retrieved from the photoplethysmographic (PPG) signal recorded at the fingertip. Contrary to the oscillometric method, the new method directly measures the systolic and diastolic pressures. The simultaneous recording of ECG and PPG signal gives the possibility to assess the rigidity of the brachial arteries. Chapter 7 summarises the new results and formulates the theses. There are 176 references listed, adapted to the rapid increase in electronic accessibility quite many of them are available on the web. Details of presently existing rating scales for Parkinsonian and stroke patients are given in the appendix.
Further details about the research work on human movement analysis are available at the web:
http://home.mit.bme.hu/~jobbagy/parkinson/parkinson.htm.
Movies shot during movement analysis of both Parkinsonian and stroke patients and healthy subjects are accessible. The trajectories of markers are also given in separate files.
The web portal at the address below offers a free service for neurologists who want to use the tests described in this dissertation.
http://aisrv.mit.bme.hu/~zsombor/pamweb
1 Movement analysis
Neurologists observed specific changes in the movement co-ordination of their patients – compared to healthy control subjects – a long time ago. In the early, preclinical phase the sub- tle changes cannot be detected by visual inspection. Similarly, variations in the performance of a patient resulting from slow progress of the disease remain undetected for the human ob- server. Evaluation of movement aids the diagnosis – even early diagnosis – and assessment of the actual state of patients if
− the movement patterns are well defined,
− movements are recorded with satisfactory sampling rate and spatial resolution,
− appropriate feature extraction methods generate meaningful parameters.
Neurologists use a number of movement patterns to test their patients. The recordings at the Department of Measurement and Information Systems revealed that the movement pat- terns are usually not defined accurately enough. This deteriorates the reproducibility of these tests.
Passive marker-based motion analysis is especially suitable for testing human movements.
The markers are lightweight (1...10 gram), and no wires are needed between the markers and the analyser. The markers and the analysis cause absolutely no discomfort to the persons. The performance of commercially available motion analysers by far exceeds the requirements needed to record and evaluate the movement of patients with neural diseases. As a conse- quence, these devices are too expensive for the task. I developed a simple device that is appli- cable for movement analysis and affordable for routine medical and clinical use.
The tracking of markers has made it possible to characterise the performance of a person on the basis of the complete movement. This is a substantial improvement compared to evaluation based on contact sensors. I have defined parameters that characterise both the swiftness and the regularity of movements.
1.1 History, methods, device types
Movement has been considered an important attribute of objects as well as living crea- tures. It is difficult to assess parameters of movement based on visual observation. Although the human image processing ability is excellent, it is valid only for static images. Details of a
movement can be accurately estimated based on human observation only if it is slow enough.
Methods applied for describing and explaining movements date back to Pythagoras and other Greek philosophers. Characteristic statements are cited in [Cappozzo et al. eds.1992]:
"Movement is harmony (the heavenly spheres, music)." "Space and time are not absolute con- cepts but only philosophically detectable bodies."
Although it made no fixed output, the camera obscura was able to render movement per- ceptible. Figure 1.1 gives an example.
Figure 1.1. Camera obscura. Source: www.precinemahistory.net/1600.htm
Methods and devices to measure and quantify movements have been available since the XIXth century. The first "fixed photograph" was taken in 1826 by Niépce, "View from the window at Le Gras", see Figure 1.2. The equipment (called heliograph) was a camera obscura, the exposition time was eight hours. A number of experts and scientists - some of them fa- mous for activities in different fields - contributed to the development of photography and the projection of photographs. During the XIXth century, Daguerre, Brewster, Roget, Wheatstone, Plateau, Stampfer, von Uchatius, Horner, Talbot, Moigno, von Madler, Herschel, Bayard, Childe, Hunt, Houdin, Muller, von Marten, St.Victor, Clarke, Langenheim, Evrard, Archer, Duboseq, Masher, Martin, Quinet, Melhiush, Cutting, Disderi, Poitevin, Relandrin, Fenton, Skaife, Tornachon, Chevalier, Rose, Desvignes, Ponti, Du Mont, Shaw, Parkes, Holmes, Sell- ers, Pepper, Dircks, Du Hauron, Laing, Molteni, Smith Beale, Lincoln, Pollock, Hyatt, Maddox, Linnett, Brown, Maxwell, Heyl, Ross, Janssen, Rudge, Donisthorpe, Edison, Reynaud, Skladanowsky, Beale, Lumière brothers, Casler, Dickson, Mach, Le Prince, Stirn, Anschutz, Friese-Greene, Evans, Ives, Demeny, Paul, Acres, Jenkins, Richard, Wray, Latham, Armat, Bloch, Smith, Pathe, Messter, Bunzli, Continsouza, Goodwin, Kamm, Eastman,
Braune, Fischer, Bernstein, Marey and Muybridge all added something to photography and to image-based motion capture. Many interesting details can be found on the website:
www.precinemahistory.net created by Paul Burns.
Figure 1.2. The first "fixed photograph", View from the window at Le Gras (in Saint-Loup-de-Varennes).
Two citations prove that the commercial value of motion picture was not realised at the time of its birth. "The cinema is an invention without a future" - Louis Lumière.
"Our invention can be exploited for a certain time as a scientific curiosity, but apart from that, it has no commercial future whatsoever." - Auguste Lumière.
I would like to stress the role of Etienne-Jules Marey (Figure 1.3) and Eadweard James Muybridge (Figure 1.4) (born as Edward James Muggeridge) in capturing motion on still im- ages. Both lived between 1830 and 1904.
Figure 1.3. Etienne-Jules Marey, 1830 - 1904. www.ctie.monash.edu.au/hargrave/marey.html
In 1859 Marey defended his thesis for Doctor of Medicine, but already from 1854 on he studied human movements. His research interest focused on both internal (intracardiac pres- sure, arterial pulse, pulmonary ventilation and muscle contraction) and external body move- ments. He created different mechanical and optical tools to study motion; the best known is the chronophotographic box that was able to take 60 images per second. Further details are in [http://web.inter.nl.net/users/anima/chronoph/marey/index.htm]. Its modified version, the photographic rifle could take images at intervals of 1/100 seconds using a rotating wheel with 10 spokes. Marey was not interested in replaying the motion; he used photography to study
quantitatively human and animal motion. In 1892, three years prior to the first public projec- tion by the Lumière brothers Marey invented the cinecamera and in 1895 he was elected president of the French Academy of Sciences. He is considered to be the father of biomechan- ics by many researchers in this field.
Figure 1.4. Eadweard Muybridge, 1830 - 1904.
Eadweard Muybridge (see Figure 1.4) became famous by applying "serial photography"
to capture fast motion. He was commissioned by Leland Stanford to decide whether or not there is a moment when all feet of a galloping horse leave the ground. To do so, he could reach a 1/2000 s exposure time. The photographs surprised the experts; different concepts had been widely accepted concerning the galloping. Figure 1.5 shows twelve moments of the gal- loping horse 'Occident'. Images of another horse are on the front cover of the Scientific American, issued October 19, 1878.
Figure 1.5. Phases of a galloping horse, taken by E. Muybridge in 1877.
Muybridge applied his method of serial photography to record phases of different human and animal locomotion. Between 1872 and 1885 he shot more than 100,000 images. He published a great number of image series in three books. A collection of his work is re- published [Muybridge, 1973]. Twelve phases of a head spring are shown from front and side view in Figure 1.6. Not a scientist but rather a brilliant technician, Muybridge was
acknowledged even by the greatest contributors of the early era of studying biolocomotion.
Further interesting details can be found at:
http://photo.ucr.edu/photographers/muybridge/contents.html.
Figure 1.6. Head-spring, a Flying Pigeon Interfering 1885.
Biolocomotion studies date back to cinematography (Marey) and kymography (Ludwig).
A number of paintings and sculptures demonstrate that visual (human) assessment of motion is very difficult and even such excellent observers as artists frequently portrait moving hu- mans and animals in not existing positions. [Cappozzo et al. eds, 1992] gives a good summary of the first century of research on biolocomotion using moving pictures.
Presently available equipment range from simple home video cameras with 25 frames/s up to sophisticated equipment with more than 10,000 frames/s. The Phantom® V5.0 system from Photo-Sonics Inc. offers 1024 x 1024 resolution with 1000 full frame/s speed. Reducing the resolution allows for increasing the recording speed, with 32 x 256 resolution the maximum is 60,000 frames/s. Photron APX from Digital West Imaging is able to record 2,000 frames per second with 1024 x 1024 resolution and 120,000 frames per second with 128 x 16 resolution.
The cellular neural network (CNN) technology offers local image processing for each pixel.
128 x 128 resolution and 1,000 frames/s recording speed is available [Orzó L., Tőkés Sz., Roska T., 2002], [http://lab.analogic.sztaki.hu/publications.html], further improvement is ex- pected.
Presently image-based motion analysis is by far the most widespread for studying biolo- comotion. Mechanical solutions like goniometers have a very limited field of application.
Ultrasound based devices (e.g. Zebris) and magnetic devices (e.g. Flock of Birds, Ascension) are able to track a limited number of markers with low sampling rate. They are applied mainly in rehabilitation. Polhemus offers magnetic and laser based devices [www.polhemus.com].
Manual tracking of markers is offered by the cost-effective APAS system [www.sportscience.org].
1.2 Image-based movement analysis
Image-based movement analysis for biomedical purposes requires the identification of anatomical landmark points on humans or on animals. After identification, these points are tracked, i.e. the co-ordinates of these points are determined on the images. Movement analysis is based on the trajectories of the landmark points. Marker free analysis [Lanshammar, 2001, Courtney et al., 2001, Marchesetti et al, 2004] would be very advantageous; however, at pre- sent the method is not elaborated enough, the achievable accuracy is modest.
1.2.1 Marker-based analysis
Marker-based movement analysis uses markers that are attached to the anatomical land- mark points, cf. Figure 1.7.
Figure 1.7 Marker placement and feature extraction in motion analysis.
The markers are tracked, based on the position of markers the positions of the anatomical landmark points are determined. The marker should keep its relative position to the anatomi- cal landmark point during the analysed movement. Basically as a result of skin displacement this relative position does not remain constant. The best practice is to attach markers to the tested human or animal by ribbons that are tight enough; stripes equipped with adhesive lay- ers on both sides should be avoided. The markers applied in biolocomotion studies are light- weight; they minimally influence the analysed movements.
In image-based analysis the markers must be seen by the camera(s) otherwise their posi- tion cannot be determined. A good summary of marker-based movement analysis is given in [Furnée, 1989, Cappozzo et al., (eds.), 1992].
Markers
In general motion analysis requires an appropriate model and measurements should be carried out according to it. The important – landmark - points can be tracked if markers are attached to them. Markers are carriers then, after acquiring a picture, only the midpoint co- ordinates are important, provided the midpoint always fully determines the position of the corresponding landmark point.
In general the marker images are excessively bright thus providing a means for feature ex- traction: by thresholding the luminosity the marker images can be separated from their sur- roundings.
There are basically two types of markers, active and passive ones. Active markers emit light. Their advantage is that the identification of a marker is easy; it is possible to light only one marker at a time. The disadvantage is that active markers either require an energy source or there must be wiring between the markers and the motion analyser. The use of active markers in biolocomotion studies is inconvenient in most cases. Another – less bothering – drawback of active markers is the time shift between sampling their positions. It is an inherent feature, as markers are lighted one after the other.
Passive markers have the important advantage that they mean almost no discomfort for the human or animal, as they are lightweight (< 10 gram) and need no wired connection. The form of the marker must be selected so that its projection to the sensor plane has always the same shape. It follows that the marker shape should result in a circular projection: spherical shape is needed for three-dimensional applications, hemispheres and disks are also satisfac- tory for two-dimensional use. The relative brightness of markers compared to their environ- ment (it can also be expressed as ambient light suppression) is increased in two ways: the cover of a passive marker is made of retroreflective material and a stroboscopic infrared illu- mination is applied.
The main drawback of passive markers is that they need to be identified on each frame because the relative positions of the markers may change as a result of their displacement.
When the trajectories of two markers cross each other the identification of the markers after the crossing requires a priori knowledge about the studied movement. If there is an object between the marker and the camera the marker image is missing from the sensor. This is called occlusion. Based on a priori knowledge and interpolation it is possible to determine the missing part of a trajectory. The longer is the missing part the greater distortion might result from the interpolation.
Cameras
In marker-based motion analysis a camera consists of the following parts:
- light source for illumination, - optical lens(es),
- shutter,
- light sensor, - interface circuitry.
The aim is to get a picture, on which the intensity of a marker image is much greater than its environment (the ambient light suppression is high). This assures that all the markers can be sampled simultaneously (the marker images can be extracted from the image by threshold- ing the intensity). This aim cannot be achieved in general but might well be approximated with restrictions that can usually be fulfilled in practical applications. The most important restriction is that the markers remain within a defined volume. The smaller is this volume the better the aforementioned aim can be approximated. Selecting the proper wavelength of the applied illumination assures the relative brightness of marker images. The most widely used solution is to apply infrared illumination in harmony with the frequency dependent properties of the retroreflective cover of markers.
The ambient light suppression can be substantially increased if the aperture time is only a fraction of the time that elapses between two consecutive frames. It can be achieved by shut- tering and stroboscopic illumination, synchronised to the frame rate. This solution has a fur- ther advantage: assures equidistant, simultaneous sampling and reduces smearing.
During the tests reported in this dissertation the PRIMAS [Furnée, 1989] and the PAM analysers were used. PRIMAS uses high-quality HTH cameras (100 samples/s) with elec- tronic shuttering (0.25 ms) and 604 x 288 resolution. PAM uses the SONY TR8100E DV camera equipped with a 1-ms infrared flash. PAM processes every field (50 samples/s), thus the resolution is 768 x 288.
1.2.2 Image processing to determine the marker positions
The first image-based motion analysers used electron tubes as sensors. The identification and location of markers required hardware supplement. The video/digital co-ordinate con- verter used in several devices was first reported by Furnée [1967]. Video/digital co-ordinate converters use mainly one-level thresholding, one-bit A/D conversion. Multiple level thresh-
olding - several bit A/D conversion - results in a smaller quantisation error but at the same time increases the computational load considerably.
Present day digital video cameras and PCs are fast enough. They mean a good alternative to the hardware feature extraction if processing of grey-scaled images is needed. The CNN technology also offers an effective solution to extracting marker positions from video stream shot at high speed.
Since the mid-1990 the computational power of processors has allowed determining the marker positions without hardware feature extraction. The bright marker images can be ex- tracted by processing each pixel of the grabbed images. Marker images are derived based on the difference in brightness. Binary images can be generated by thresholding the brightness of pixels; the marker (centre) position is determined by simple geometric centroid estimation [Jobbágy, 1994]. The position is determined with a higher accuracy if the marker images are processed as grey-scale set of pixels. [Baca, 1997] gives a method for marker position estima- tion by fitting a Gaussian surface to the marker image. Improving hardware thresholding in image processing [Furnée and Jobbágy, 1993], the threshold level can be adaptively set on each frame. Also, the distorted marker images and ghost markers can be identified and filtered out relatively simply.
Two-level image processing is able to offer high resolution and accuracy with relatively low computational burden. First the intensity distribution of the image is determined and based on it a threshold level is set. The pixels with brightness above the threshold level are processed as grey-scale spots.
1.2.3 The necessary sampling rate for recording human movements The human eye is able to retain an image for about 1/15 s [Winter, 1990]. This is why film (24 frames/s) or television (25 frames/s, 50 fields/s: PAL) seem to reproduce movements smoothly. The lowest sampling rate applied in gait studies is 24 samples/s. [Winter, 1982]
showed that kinetic and energy analysis can be done with negligible error using this sampling frequency.
I determined the sampling rate necessary for the evaluation of the finger-tapping move- ment with the help of PRIMAS. Data gathered with 100/s sampling rate was processed and the parameters characterizing the movement were determined using the complete database as well as the reduced databases. The database was reduced in two steps, each time eliminating every second data. The database after the first reduction corresponds to a 50/s and after the
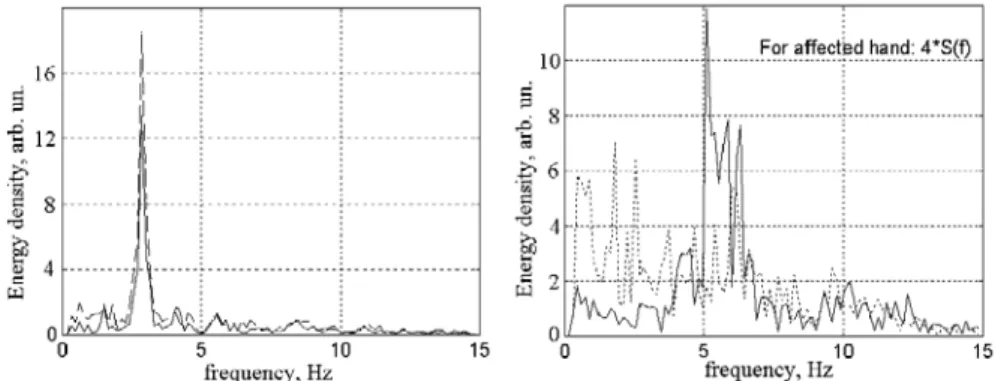
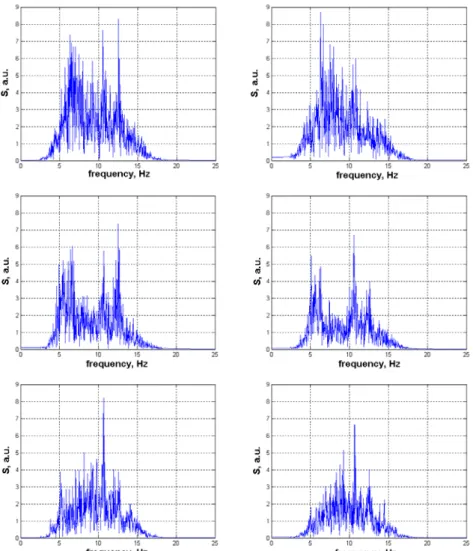
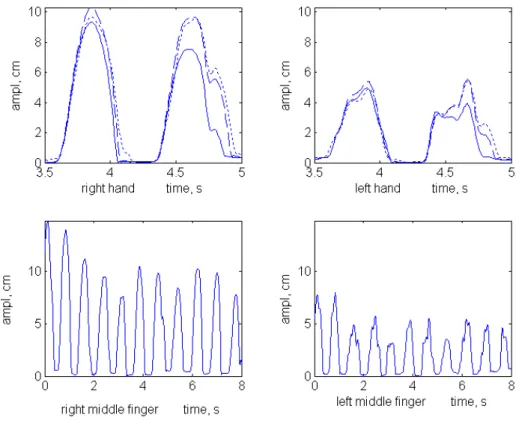
second reduction to a 25/s sampling rate. In this way after each test there were three databases describing the same finger-tapping movement. Strong agreement has been found between parameter values computed based on the first (100/s) and second (50/s) databases. These pa- rameter values were markedly different from those calculated from the third database (25/s) [Fogarasi, 1999], [Jobbágy et al., 2005]. These results are in accordance with the frequency domain analysis of the time functions achieved with 100/s sampling rate: components above 25 Hz were negligible. Figure 1.8 shows the Fourier transform of the movement of a marker attached to the little finger of a young healthy subject. Similar energy distribution over fre- quency was detected also for other healthy subjects. Parkinsonian patients usually had energy distribution up to lower (typical value 16 Hz) frequencies (see Figure 1.9).
Figure 1.8. Fourier transform of the movement of the little finger during finger-tapping test (young healthy subject). Energy density is negligible above 22 Hz.
Figure 1.9. Frequency spectra of time functions of both index fingers of a young healthy patient (left) and of a Parkinsonian patient (right, affected hand: dotted line) during tapping test.
1.3 Devices
1.3.1 General purpose motion analysers
A number of image-based and marker-based motion analysers were developed but only a few have become commercially available. [Furnée, 1989] gives an excellent summary of the devices using some kind of hardware aid to extract marker images from the full image.
The Precision Image-based Motion Analyser (PRIMAS) was developed at Delft Univer- sity of Technology [Furnée, 1989], [Jobbágy and Furnée, 1994]. The good spatio-temporal resolution and the relatively low price of the device make it adequate for human movement analysis. The 3D calibration of the device is unique. It is based on a set of markers placed on a plate allowing a relatively easy calibration in parallel with the measurement to compensate lens distortion. Analogue input channels for EMG or force plate sensors are available. Al- though a new version of the analyser was developed, at present PRIMAS is not available on the market. PRIMAS offers maximum 100 full frames/s, the resolution is 604 x 288.
VICON is widely used in biolocomotion studies. Gait, posture and balance are studied with this device mainly in research laboratories. Similarly to other analysers VICON [www.vicon.com] is also used in virtual reality applications, sport and ergonomic studies, and in projects related to entertainment (development of video games, animation, filming, etc.).
Maximum 24 cameras and 128 analogue channels (to measure EMG and output of force plate sensors) can be connected to the central unit. The cameras have high resolution (1 Mpixel, 1000 x 1000), the maximum frame rate is 250/s. This allows for an excellent resolution, very rarely needed in human or animal locomotion studies for medical purposes. Lower resolution (50-60 frames/s) cameras are also available. The software offers automatic tracking of mark- ers, cubic splines are used to estimate the missing intervals in trajectories.
MacReflex and ProReflex from Qualysis are able to reach 1000 frames/s sampling rate [Corley et al., 1993], [www.qualisys.com], [http://www.innovision-systems.com].
Similar products are offered by MotionAnalysis [www.motionanalysis.com].
The Motus Measurement System from Peak Performance [www.peakperform.com] offers sampling rate from 25 Hz up to 200 Hz (PAL), even high-speed cameras (up to 2000 Hz) can be interfaced. Force measurement and EMG devices can also be integrated.
ELITE can handle cameras up to 100 frames/s; it has analogue inputs for EMG or force plate sensors [Ferrigno et al., 1990].
Further image-based motion analysers are available. High-Speed Video Motion Analyser (HSVMA) from Ultravision is a real-time uncompressed video recording and processing software.
KODAK Ektapro offers ultra high speed, 12,000 frames/s with 239 x 192 resolution. This resolution offers even the study of a falling drop [Rothert et al., 2003].
PAM processes each field of a standard PAL video stream; this corresponds to 50 sam- ples/s. The resolution of PAM is 768 x 288, it provides 2D information.
Non image-based motion analysing devices using magnetic [Bull et al., 1997] or ultra- sound sensors [Schimke et al., 1998, www.zebris.de] are applied in different biomedical re- search.
The primary parameter provided by a video-based and marker-based motion analyser is the position of markers. The parameters to be determined (e.g. torque, velocity, acceleration, jerk) usually require numerical differentiation. This operation means an extremely high noise amplification factor, thus the accuracy of position data is an important issue.
Many factors influence the resolution and accuracy of video based analysers: marker size (expressed in percentage of field of view, FOV), optical projection, lens distortion, parameters of the sensor (mostly CCD), the video/digital co-ordinate- or A/D conversion, the calibration procedure (especially in case of 3D analysis) and the applied image processing algorithms.
Resolution and accuracy are not limited to the number of pixels on the sensor. When a marker image spreads over a number of pixels, then sub-pixel resolution and accuracy can be achieved by appropriate algorithms [Baca, 1996], [Jobbágy, 1994].
Motion analysers are often characterised by the spatio-temporal resolution, which takes into account the resolution both in space and time. [Furnée, 1989] gives an overview of dif- ferent definitions and introduces the spatio-temporal quality factor, Q:
p Q= fs
where fs is the sampling frequency and p is the precision, expressed as a percentage of the FOV. There are analysers that make it possible for the user to increase the sampling rate if the number of effective pixels is reduced. Applications in human movement research rarely re- quire higher than 50 /s sampling frequency. The resolution in space depends on the movement studied, the marker sizes and the FOV.
1.3.2 A device for routine clinical applications (PAM)
A Passive Marker-based Movement Analyser (PAM) has been developed at the Dept.
Measurement and Information Systems; based mainly on commercially available elements [Jobbágy et al., 2004]. A digital video camera (SONY TR8100E), able to operate in the infra- red range, an optical filter and a notebook with IEEE 1394 interface are the commercially available elements. An infrared LED ring (containing 18 LEDs) with the necessary control circuitry was developed. The peak sensitivity of the CCD sensor was measured to be at 885 nm, the LEDs were selected in accordance with it (SFH 485, max. radiation at 880 nm). The control circuit synchronises the flashing of the LEDs to the vertical synchron signal of the camera. A 5-ms delay assures that flashing starts when the CCD chip is sensitive. The 1-ms flashing assures a short enough sampling time and increases ambient light suppression thus results in sharp marker images. Both even and odd fields are evaluated using appropriate marker image processing. In this way 50 images can be taken in each second. The system is inexpensive (compared to high performance motion analysers), portable and easily applicable in the medical/clinical environment.
The infrared LEDs aid the separation of marker images from the rest of the image; they increase ambient light suppression. Figure 1.10 shows two fields (odd and even) separately and also these fields together as one frame taken by PAM in the infrared range. The dis- placement of the markers between two fields (during 20 ms) can be observed on the frame displaying both odd and even fields.
Figure 1.10. The odd field (top), even field (middle) and the two fields displayed as one frame (bottom) recorded with the PAM during finger-tapping.
Figure 1.11 shows the intensity histogram of the top image of Figure 1.10. The A/D con- verter of the camera gives 780 when a pixel has maximum intensity. The pixels belonging to
the marker image are excessively bright; their intensity values are between 680 and 720. The measurement set-up used for the tapping-test is shown in Figure 1.12. As the camera - hand relative position is the same during the tests then a two dimensional analyzer is enough to evaluate hand movements.
Figure 1.11. Intensity histogram of a field taken by PAM.
Figure 1.12. The measurement set-up for the tapping-test.
1.3.3 Resolution, accuracy and precision of motion analysers
In the following I use the terms precision and accuracy for image-based motion analysers as defined in [Walton, 1986].
Precision is the degree of mutual agreement among repeated observations made under identical conditions. Precision is a measure of random error.
Accuracy is the degree of agreement between individual measurements and accepted ref- erence values. Accuracy is a measure of systematic error.
Resolution of a motion analyser is the smallest detectable displacement or the longest un- detectable displacement.
These parameters cannot be given as single constants for an image-based analyser, be- cause they strongly depend on the marker image size. If the marker image covers more pixels, accuracy, precision and resolution are more favourable. The nonlinearity of the lens also in- fluences these parameters; worst results can be expected when marker images appear in the corners of the FOV.
Measurements carried out to characterise marker-based motion analysers use static mark- ers as well as markers moving along given paths. Detailed analysis of resolution, accuracy and precision of image-based motion analysers is given in [Jobbágy et al., 1998].
Each application requires a dedicated preliminary evaluation to check if the analyser is able to meet the requirements. The analysis of human movements in the medical care rarely demands high accuracy or precision.
Evaluation of a typical image-based motion analyser (PRIMAS)
Attaching a 9-mm diameter marker (this size is used in testing finger movements) to a mi- crometer the resolution of PRIMAS was found to be 1/12000 of the FOV. The resolution es- timated by simulation is in the order of 1/15000.
The resolution of PAM was found to be 1/16000 of the FOV, using 9-mm diameter mark- ers in a 60 cm x 45 cm FOV.
Precision characterises the stability (reproducibility) of the system. High precision is nec- essary, but not satisfactory condition for high accuracy.
Scenes with static markers were observed by the analyser under test, PRIMAS. Two types of measurement were made, (a) long-term measurement series started at power on with low sampling rate (1 hour recording time, 2 frames/s) and (b) short-term measurement series with high sampling rate (10 s recording time, 100 frames/s). The (a) type test reveals if thermal changes influence the position results while the (b) type test characterises system noise.
Following power-on, the change within an hour in the measured horizontal position of the marker is approximately 90 % of the pixel side. Taking into account the given set-up it is equal to 1.5 mm imaginary displacement meaning a 1/670 ratio of the horizontal side of FOV.
The change in the measured vertical position was negligible, within noise limits.
A number of 10-s recordings were made using 100 frames/s sampling rate. The centre (x and y co-ordinates) of a static marker is measured and the results are plotted. A typical distri- bution of the measured centres along the sensor plane is shown in Figure 1.13.
It is clear that the distribution is not normal. It is difficult to characterise the precision of a device with a single value. The maximum deviation in the described experiment is 1/7500 (horizontally) and 1/7200 (vertically) compared to the appropriate side of the FOV. Precision depends on the marker image size; it improves if the marker image increases. Precision is closely related to noise.
Figure 1.13. Distribution of the estimated centre points.
The system noise was investigated by subtracting grey-scaled images taken from the same scene. An 8-bit A/D converter was built in the PRIMAS, which converted the intensity of a 64 x 16 pixel area of the CCD sensor. Figure 1.14 shows a typical differential image for the PRIMAS analyser. There were two markers in the field of view, though these cannot be lo- cated after subtraction.
Figure 1.14. Noise of a CCD sensor: the difference of two images taken from the same scene.
Let the intensity value of the (i, j)th pixel of the CCD sensor for two images be I1(i, j) and I2(i, j), 0 ≤ I ≤ 255, 1 ≤ i ≤ 604, 1 ≤ j ≤ 288. The intensity value of a pixel after subtraction is ΔI12(i, j) = I1(i, j) - I2(i, j). In the ideal case ΔI12 would be zero for all pixels. The maximum values for ΔI12 were found to be ± 5, independent of the scene and illumination. This noise results in different calculated values for the centre of a static marker. Testing of accuracy usually requires an etalon. When testing motion analysers the absolute positions of the mark- ers are generally not known with great enough accuracy. A widely used solution is to move a marker along a well defined trajectory, in the majority of cases this is a straight line. Accuracy is characterised on the basis of the deviations from the straight line. This test can be applied without knowing the exact marker positions.
A marker was moved horizontally with the help of a printing head and a straight line was fitted to the measured marker centre co-ordinates as shown in Figure 1.15. From these figures it is clear that the accuracy of the measurement is limited by the lens distortion. There are effective calibration procedures, which improve accuracy substantially.
Figure 1.15. Measured positions of a nearly horizontally moving marker and a fitted straight line.
Numerical data of a biomedical application
The set-up used for the finger-tapping test is analysed in the following. This movement mimics piano playing; detailed description is given in 2.1.1 .
Markers are attached to the eight moving fingers with elastic ribbons. Marker size is lim- ited, not to influence the movement. We used 9-mm diameter markers. The distance of the camera from the table is fixed. This assures the reproducibility and comparability of meas- urement results. FOV had to be selected so that all fingers of a subject should be seen during the movement. This requires that the horizontal size of the FOV be at least 50 cm, the actual value was 64 cm. Taking into account the ratio of horizontal and vertical sides of the FOV this means 48 cm for the vertical side. The sensor of the CCD camera of PRIMAS has 604
columns and 288 rows, the 9-mm diameter marker results in a marker image covering an area on the sensor equivalent to 30 ... 40 pixels. This means sub-pixel resolution can be achieved.
When binary images are generated (the video signal is thresholded to extract the marker im- age), the covered pixel co-ordinates can be averaged or the more accurate ring-fitting can be used [Jobbágy, 1994].
During the finger-tapping test noise limits resolution to 0.2 mm. The accuracy was meas- ured by moving the 9-mm diameter marker along a 30 cm line. The average distance between the fitted straight line and the measurement points was found to be 0.15 pixel side. In propor- tion to the diagonal of the FOV it means a 1/5000 (0.15 mm) accuracy. The measurement was repeated with smaller displacement, 5 cm. The accuracy in this case is approximately 1/4000 of the total displacement (0.013 mm). These parameters are sufficient for finger- hand- and arm movement measurements even without lens distortion compensation.
The PAM analyser was tested using similar measurement set-up [Hamar, 2004]. The re- sults are close to the parameters of PRIMAS. The system noise limits the resolution during finger-tapping test to 0.3 mm (FOV: 64 cm x 48 cm). Both accuracy and short-time precision are the same as for PRIMAS. No warming-up effect was found. This means, PAM is also applicable for human finger-, hand- and arm movement assessment.
1.4 Biomedical/clinical applications of movement analysis
Movement coordination is affected by the actual state of a person or an animal. Changes in movement coordination can reveal and help in staging neural diseases.
Human movements are analysed from different aspects. Kinematics deals with displace- ment, velocity, acceleration – sometimes even with jerk. Both linear and angular variables can be used to characterise the movement of body segments or joints. A spatial reference is needed, either an absolute or a relative one. Kinetics deals with the internal and external forces that cause the movement. The internal forces mainly derive from muscle activation while external forces originate from the interaction between human or animal and the envi- ronment. [Winter, 1990] emphasises the role of anthropometry that gives data on the shape and mass of body segments and muscle and joint biomechanics.
Image-based motion analysis helps acquire kinematic data. Very often the movement ana- lyser must be synchronised to devices providing further information on the currently studied movement. Force plates, accelerometers, treadmills and electromyographs are most frequently used but other signals of physiological origin may also be captured. Examples are: electrocar-
diogram, electroencephalogram, photoplethysmogram, spirogram, output signals of imped- ance measuring equipment, etc. Further signals from different sensors might give valuable information; consider the force sensors embedded into different prostheses or timing signals of schedulers.
The aim and the process of the measurement have to be explained to the tested person.
The analysis of a given movement gives meaningful and comparable results only if the meas- urement procedure is defined in detail. This must comprise the movement pattern as well as the arrangement of the measuring devices. To get parameters characterising the given move- ment accurately and reliably enough for comparative evaluation, well defined parameters and signal processing algorithms are needed. Internationally accepted standards would help. There are only a few recommendations for such standards and even these are not defined to the nec- essary extent.
1.4.1 Rehabilitation
Movement analysis is a useful aid in rehabilitation. A number of gait analysis laboratories exist to give a feedback to physiotherapists, neurologists and the patients themselves. There are manufacturers of prostheses (Otto Bock Healthcare is a good example) that have been applying movement analysis to trim their products. This procedure complements the adjust- ment based on the patient’s evaluation. Especially with a new prosthesis, it is very difficult for the patient to estimate its practicability.
There are no standard measurement procedures. Neither are standard devices available.
This impedes the introduction of standard rehabilitation methods. The CAMARC program aimed at defining standard interfaces for the data exchange among laboratories.
Recommendation for a standard (CAMARC program)
The CAMARC (Computer Aided Movement Analysis in a Rehabilitation Context) pro- grams I and II suggested a solution for the standardisation problem [Leo, 1994]. Different laboratories are equipped with different instrumentation; it would be an unrealistic plan to change this situation. The CAMARC recommendation is to use a standard protocol for the exchange of data. This allows for the use of different instrumentation and even different sig- nal processing; the conversion programs assure the comparability of results.
The recommendation defines the laboratory axes, force plate axes; bone embedded (ana- tomical) frames, marker placement and marker mounting. The pre-processed gait data file
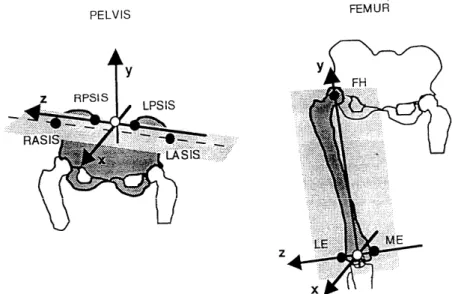
(PGD file) format is also specified. The CAMARC recommendation for the anatomical frame construction for the pelvis and femur are given in Figure 1.16. For the pelvis, RPSIS and LPSIS stand for right and left posterior superior iliac spines, RASIS and LASIS denote the right and left anterior superior iliac spines. For the femur, FH means the femoral head; LE and ME are the lateral and medial epicondyles.
Figure 1.16. Anatomical frame construction for the pelvis and femur. CAMARC recommendation.
The CAMARC project integrated clinical and research centres as well as manufacturers and users like insurance companies. The resulting recommendation for standardised move- ment analysis in rehabilitation (agreed clinical and experimental protocols) is a pioneering work. Even the details are well defined; a good example is the attachment of markers to ana- tomical landmark points. However, there is still a lot to be done to have a widely accepted functional assessment method of the motor (dis)ability of the motor impaired and/or the eld- erly. A related database had been created. The database was meant to provide age-related normal values and also a comprehensive knowledge base for the quantitative classification of motor impairment. Further details are available in [Leo, 1994].
Staging of stroke patients
Presently existing tests [Hamilton, 1987], [Collen et al., 1991] measure the self supporting ability of patients (see appendix). Many everyday functions (dressing, eating, washing one- self) can be learnt to be performed with one hand only. As a result these tests do not provide an objective measure for the rehabilitation process when dysfunctions are unilateral.
In co-operation with National Institute for Medical Rehabilitation, Budapest (OORI) a measurement series was taken from stroke patients using the PAM movement analyser. The details are given in section 4.
Characterisation of hand tremor
Tremor of the hand is present even for young healthy subjects. Objective and quantitative characterisation is greatly helped by movement analysis. PAM is suitable for this purpose.
Healthy subjects (aged 22 – 71) were tested, one passive marker was attached to the index finger. Recordings were made with stretched arms, supported elbow and supported wrist, both eyes open and closed. Characteristic trajectories are given in 2.2.7.
1.4.2 Assessment of the actual state of patients with neural diseases A number of different tests are applied that assess the actual state of patients with neural diseases based on movement analysis. The United Parkinson's Disease Rating Scale (UPDRS) advises to measure the following movements: turning in bed, walking, action or postural tremor of hands, rigidity, finger taps, hand movements, rapid alternating movements of hands, leg agility, arising from chair, gait, postural stability, body bradykinesia and hypokinesia.
In case of stroke patients movements needed for daily activity are measured: sit to stand, clothing, eating, etc. There are several standard tests for quantifying the level of bradykinesia, rigidity, spasticity and paraplegia: Rivermead, Ashworth, Barthel, Hand Movement Scale (HMS), and FIM. These scales measure the motor functions of the limbs and the level of self sufficiency [Hermsdörfer et al., 1999], [Fazekas et al., 2002]. Rehabilitation proves to be more effective if aided by a feedback from the actual performance of the patient. Robot aided rehabilitation is reported by [Fazekas et al., 2004], [Foley, 2004].
Visual assessment gives coarse resolution; only experienced physiotherapists are able to evaluate the patients’ state in this way. Simple devices are widely used to give better repro- ducibility: nine-hole peg test, contact sensors, MIDI keyboard, etc. These devices do not track the whole movement, they usually measure the total time of the movement (e.g. nine-hole peg test) or defined parts of it (e.g. time intervals between consecutive table contacts during fin- ger-tapping test). The application of a movement analyser gives information about the whole movement. This helps the objective assessment of the movement co-ordination – thus the ac- tual state – of patients with neural diseases.
1.4.3 Long-term monitoring of the locomotor activity of rats
The psychophysiological state of small animals (rats) can be characterised based on their movement patterns. Such a complex indirect measurement can be divided into two parts [Morawski, 1994]:
(a) conversion to transfer measurement information into the domain of "easily interpret- able" phenomenon; from the signal processing point of view, generation of raw data,
(b) processing of the raw data, interpretation of the results.
The movement of rats kept in special transparent (plastic) tube-like cages was continu- ously tracked for a few days at the Institute of Human Physiology and Clinical Experimental Department, Semmelweis University Budapest. The rats were in head-up position and they could move back and forth and turn around the longitudinal axis of their trunk freely but they could not turn to head-down position. The cages were 60 cm long; a ladder was incorporated to aid movement up and down. The animals could eat and drink at one end (the top one for the tilted cage) of the cage, see Figure 1.17. Details are given in [Monos et al., 1989]. The posi- tion-time function in the cage is the raw data that was generated from the position of reflec- tive markers attached to the animals. There were two groups of rats, one kept in cages tilted by approximately 45 degrees and one, the control group, kept in horizontal cages. Processing of the raw data led to the qualification of the movement patterns of normal rats, i.e. animals without any medication and known illness.
Figure 1.17. Experimental set-up.
Two types of instruments are often used to measure animal behaviour. Implantable trans- ponders require surgical intervention. This is justified when not only position information but also monitoring of physiological data is necessary. Brain temperature, gross motor activity
and heart rate can be monitored with different devices of Mini Mitter Co.
[www.minimitter.com]. Another solution is to mount IR light emitters and photodetectors on the cage, interruption of the beam shows the actual position of the animal. Models of Colum- bus Instruments are representative of this latter kind of animal activity meters [www.colinst.com]. The resolution of these devices is limited, the usual beam spacing is 20 ...
30 mm, the beam diameter is 2...3 mm. Using a mirror, a single camera can provide position data in 3D [Kaminsky et al., 1997].
In our experiment feature extraction was needed in order to characterise the movement patterns of normal rats with a few parameters only derived from the position-time functions.
These parameters can be used later to characterise animal movement patterns that deviate from normal as a result of illness, medication or other controlled biological effects. During the feature extraction process parameters have been searched for which are similar for both groups (rats in tilted and horizontal cages) and also for parameters which are different.
The behavioural activity of small animals like rats might be a very sensitive parameter for investigating possible biological effects. In drug screening studies animal behaviour serves as indicator, an example is given in [Pradhan and Aurnasmitha, 1991].
The rat movement under the given circumstances is a stochastic phenomenon, shorter than daily periods cannot be revealed. Rats were found to be substantially more active when the ambient light intensity is low. The integral features characterise the behaviour of rats.
There is a daily periodicity in distance travelled cumulated for longer time intervals (1 hour ...
3 hours). The position distribution histogram is similar for an average normal rat both in the tilted and in the horizontal cages. Further details are given in [Jobbágy et al., 2002].
2 Characterising the motor functions of patients based on movement analysis
Different movement patterns of patients are analysed in the health service. The aim is ei- ther to characterise the movement itself or to acquire information on disorders affecting the motor system. Probably the most frequently used examination is gait analysis but prosthesis adjustment, rehabilitation-, sports- and ergonomic studies are also greatly helped by move- ment analysis.
2.1 Movement patterns tested in our research
The early diagnosis and assessment of patients with neural diseases is more reliable if several movement patterns are involved in the test [Jobbágy et al., 1998, Rao et al., 2003].
During the research work, aiming at the assessment of Parkinsonian and stroke patients, the following movement patterns were used.
2.1.1 Finger-tapping
Tapping test has been applied to assess the accessory muscular control and motor ability as early as the 19th century. Hollingworth [1914] reports an experiment on female subjects using an electric counter to characterise the influence of menstruation. Tapping tests have been widely used since, some examples are: quantification of ataxia [Notermans et al., 1994], estimation of the severity of Parkinson's disease [Muir et al., 1995, Jobbágy et al., 1998], as- sessment of patients recovering from acute stroke [Heller et al., 1987], testing of patients with alcoholic Korsakoff's syndrome [Welch et al., 1997], quantification of Alzheimer's disease [Ott et al., 1995], characterization of the upper limb motor function [Giovannoni et al., 1999].
Horton [1999] found that subjects with higher intelligence had better neuropsychological test score performances except for the finger-tapping with the dominant hand test. [Dash and Telles, 1999] used the finger-tapping test to assess motor speed. There was a significant in- crease in performance following 10 days of yoga in children and 30 days of yoga in adults.
[Volkow et al., 1998] found strong correlation between dopamine D2 receptors and the motor task characterised by the finger-tapping test.
In the clinical practice the finger-tapping movement is very often evaluated visually. This means a coarse resolution; only substantial differences can be detected. Simple contact sen- sors are reported to help the objective assessment [Muir et al., 1995]. There are many versions of the upper limb tapping test: hand-tapping, finger-tapping with one or more fingers, single hand - both hands, with or without a scheduler signal, etc. The presently used feature extrac- tion methods for the tapping tests do not always provide measures useful in rehabilitation or in medication. [Heller et al., 1987] report that measurement of finger-tapping rate was not useful in testing stroke patients, the Frenchay Arm Test, the Nine Hole Peg Test and grip strength measurement could be used to record the recovery curves of patients. [Shimoyama et al. 1990] found that only the time-sequential histogram of tapping intervals could distinguish the motor dysfunctions studied. [Acreneaux et al. 1997] report that "hand to thigh tapping",
"table tapping" and "finger tapping to adjacent thumb" quantify the performance of the tested subjects differently.
Figure 2.1. Three phases of the finger-tapping movement (above) and the trajectories of markers (on the left hand) recorded (bottom).
I found that to help reproducibility the movement pattern and the instructions given to persons had to be defined in detail. Tested persons put their hands on the table in prone posi- tion, with fingers approximately 1 cm apart from each other. 9-mm diameter markers are at- tached to the middle phalanxes of their fingers. Elbows are on the table. Persons lift their fin- gers (except thumbs) and then hit the table in the following order: little, ring, middle, and in- dex finger. Persons are asked to perform the movement as fast as they can (most important instruction and expectation) so that they lift their fingers as high as they can. The priority of
speed must be explained. Increasing the amplitude slows down the movement. However, per- sons should not try to increase speed by minimising the amplitude of finger lifting. Both hands should complete the same movement. This mimics piano playing. Three phases of the movement can be seen in Figure 2.1.
In the beginning of my research the finger-tapping test lasted for 8 s (21 tests of Parkin- sonians, 25 tests of young and 17 tests of senior healthy subjects). A number of finger-tapping tests lasted for 30 s (4 tests of Parkinsonians and all the 106 tests that were part of a meas- urement series taken from five young and one senior healthy subject). Based on the evaluation of these recordings I suggest using 20-s long finger tapping tests. More than two hundred 20- s long tests were recorded from stroke patients and healthy subjects. The evaluation of the first recordings taken from Parkinsonian patients showed that the wrists were not held in the same position during the tests. An elastic ribbon was applied to keep the wrists close to the table (see Figure 1.12). This is rather a warning for the tested person not to forget to keep the wrists on the table.
2.1.2 Hand tapping
The persons put their hands on the table in prone position; the fingers on each hand are close to each other, elbows are on the table. Persons lift their hands (wrists remain on the ta- ble) and then hit the table again. Persons are asked to perform the movement as fast as they can while lifting their hands as high as they can. Again, speed is the highest priority expecta- tion.
2.1.3 Pinching and circling
This movement comprises six separate movement patterns. The four single hand or fore- arm movements are: pinching with the right hand, pinching with the left hand, circling with the right forearm, circling with the left forearm. The two parallel movements are: pinching with one hand while circling with the forearm of the other upper limb, cf. Figure 2.2. 9-mm diameter markers are attached to the index fingers (both for pinching and circling) and to the thumb (for pinching).
Figure 2.2. Three phases of the pinching and circling movement (above) and the marker trajectories re- corded during the movement (bottom).
2.1.4 Twiddling
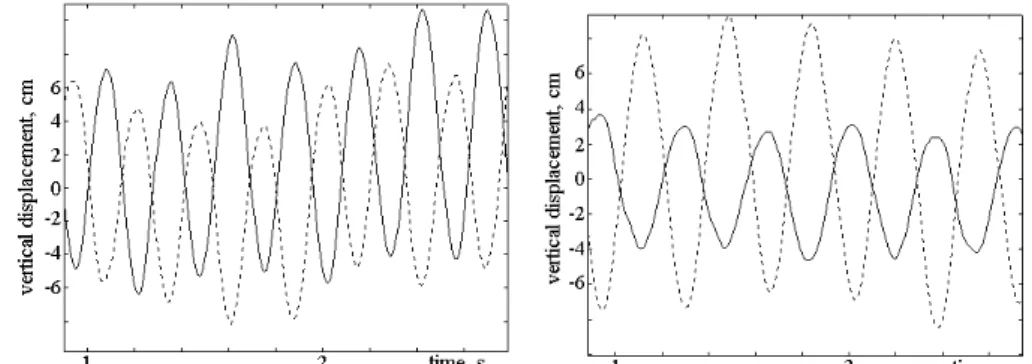
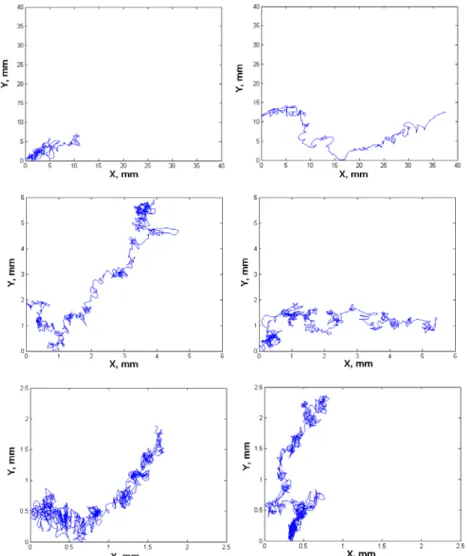
Patients twiddle their hands in front of their trunks, forearms are nearly horizontal. The 38-mm diameter markers are attached to the forearms, approximately 15 cm far from the car- pal bones, cf. Figure 2.3. The trajectories of the markers for a Parkinsonian patient and for a young healthy subject are shown in Figure 2.4 .
Figure 2.3. Three phases of the twiddling movement.
Figure 2.4. Twiddling movement. Left: Young healthy subject. Right: Parkinsonian patient. Right hand (affected one for the Parkinsonian patient) shown with solid line.
2.1.5 Pointing movements
Persons put their index finger on a marked point on the table, this is the initial position.
Slow pointing: From the initial position the person lifts the finger and very slowly (within 15 … 20 seconds) reaches and touches another marked point on the table, approximately 40 cm far from the initial position.
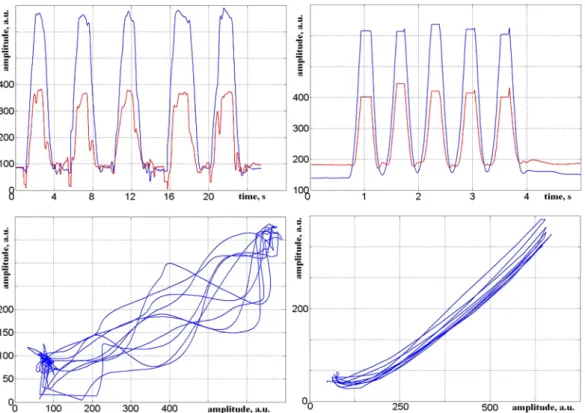
Fast pointing: Persons touch two marked points alternately as fast as they can. Each marked point is touched 5 times. The two marked points are approximately 40 cm far from each other. The trajectories of a marker attached to the index finger of a stroke patient and of a senior healthy subject are given in Figure 2.5. The stroke patient completed the 5 cycles within 23 seconds while the healthy subject within 3 seconds.
Figure 2.5. Trajectories of pointing movement. Time functions of X and Y projections (top) X-Y diagrams (bottom). Stroke patient (left), senior healthy subject (right).
The reaching and grasping movement is similar to pointing [Rearick et al., 2002]. [Morris, 2000] states that people with PD are slow to reach to stationary targets but they are able to reach forward and grasp moving objects, such as a moving ball at normal speed. The sup- posed reason is that the moving object triggers lower-level brain-stem or spinal cord reflexes.
The reaching ability of Parkinsonians deteriorates if the position of a moving object cannot be estimated based on the trajectory of the object.