Research Article
Investigation of Newly Diagnosed Drug-Naive Patients with Systemic Autoimmune Diseases Revealed the Cleaved Peptide Tyrosine Tyrosine (PYY 3-36) as a Specific Plasma Biomarker of Rheumatoid Arthritis
Jozsef A. Balog ,1,2Agnes Kemeny ,3,4Laszlo G. Puskas ,1,5,6Szilard Burcsar,7 Attila Balog ,7and Gabor J. Szebeni 1,8,9
1Biological Research Centre, Szeged, Hungary
2PhD School of Biology, University of Szeged, Szeged, Hungary
3Department of Medical Biology, University of Pecs, Pecs, Hungary
4Department of Pharmacology and Pharmacotherapy, Medical School, University of Pecs, Pecs, Hungary
5Avicor Ltd. Szeged, Hungary
6Avidin Ltd., Szeged, Hungary
7Department of Rheumatology and Immunology, Faculty of Medicine, Albert Szent-Gyorgyi Health Centre, University of Szeged, Szeged, Hungary
8Department of Physiology, Anatomy and Neuroscience, Faculty of Science and Informatics, University of Szeged, Szeged, Hungary
9CS-Smartlab Devices, Kozarmisleny, Hungary
Correspondence should be addressed to Attila Balog; balog.attila@med.u-szeged.hu and Gabor J. Szebeni; g.szebeni@avidinbiotech.com
Received 23 February 2021; Revised 24 April 2021; Accepted 11 May 2021; Published 17 June 2021 Academic Editor: Shushan Yan
Copyright © 2021 Jozsef A. Balog et al. This is an open access article distributed under the Creative Commons Attribution License, which permits unrestricted use, distribution, and reproduction in any medium, provided the original work is properly cited.
There is a current imperative to reveal more precisely the molecular pathways of early onset of systemic autoimmune diseases (SADs). The investigation of newly diagnosed drug-naive SAD patients might contribute to identify novel disease-specific and prognostic markers. The multiplex analysis of 30 plasma proteins in 60 newly diagnosed drug-naive SADs, such as RA (rheumatoid arthritis, n= 31), SLE (systemic lupus erythematosus, n= 19), and SSc (systemic scleroderma, n= 10) patients, versus healthy controls (HCs,n= 40) was addressed. Thirty plasma cytokines were quantified using the Procarta Plex™panel.
The higher expression of IL-12p40, IL-10, IL-13, IFN-γ, M-CSF, IL-4, NTproBNP, IL-17A, BMP-9, PYY (3-36), GITRL, MMP- 12, and TNFRSF6 was associated with RA; IL-12p40, M-CSF, IL-4, GITRL, and NTproBNP were higher in SLE; or NTproBNP, PYY (3-36), and MMP-12 were increased in SSc over HCs, respectively. The cleaved peptide tyrosine tyrosine (PYY 3-36) was elevated in RA (361:6 ± 47:7pg/ml) vs. HCs (163:96 ± 14:5pg/ml,mean ± SEM, ∗∗∗p= 4 × 10⁻⁵). The CI (95%) was 268.05- 455.16 pg/ml for RA vs. 135.55-192.37 pg/ml for HCs. The elevated PYY (3-36) level correlated significantly with the increased IL-4 or GITRL concentration but not with the clinical scores (DAS28, CRP, ESR, RF, aMCV). We are thefirst to report cleaved PYY (3-36) as a specific plasma marker of therapy-naive RA. Additionally, the multiplex plasma protein analysis supported a disease-specific cytokine pattern in RA, SLE, and SSc, respectively.
1. Introduction
Systemic autoimmune rheumatic diseases (SADs) including rheumatoid arthritis (RA), systemic lupus erythematosus
(SLE), and systemic sclerosis (SSc) are characterized by an abnormal immune system response, complement dysregula- tion, imbalance of cytokines production, and inflammation [1]. Their etiology, complex pathogenesis, heterogeneous
https://doi.org/10.1155/2021/5523582
presentation, and unpredictable disease course are still not fully understood [2]. Therefore, the limitation in diagnosing, classifying, and treating both RA, SLE, and SSc is significant.
Clinical remission is reached in less than half of the patients, the personalized therapeutic strategy is still lacking, and the gap between thefirst symptoms and the diagnosis may often lead to irreversible pathologic changes [3]. SADs display clin- ical heterogeneity as presented by variable prognosis, unpre- dictable susceptibility to rapid progression to structural damage in joints in RA, and severe extra-articular organ manifestations in SLE and SSc. In summary, the need for biomarkers facilitating early diagnosis and profiling those individuals at the highest risk for a poor outcome has become essential [4]. Biomarkers of RA [5, 6], SLE [7, 8], or SSc [9, 10] have been recently reviewed elsewhere. Many of the pre- vious studies have been performed in established or late-stage disease in SADs. There is a current imperative to reveal more precisely the molecular pathways of early treatment-naive SADs [11]. Furthermore, very few studies have reported a systematic molecular characterization in RA, SLE, and SSc parallelly, but none in early treatment-naive patients with SADs. The investigation of newly diagnosed drug-naive SAD patients might contribute to identify novel disease- specific and prognostic markers. The parallel investigation of SADs also could give us the possibility to recognize novel checkpoints in their pathways and unknown molecular ther- apeutic targets. Therefore, we aimed to assay the plasma content of thirty soluble mediators in newly diagnosed therapy-naive RA, SLE, or SSc patients versus age- and gender-matched healthy controls.
2. Materials and Methods
2.1. Patient and Public Involvement.Patients were enrolled during regular visits at the Department of Rheumatology and Immunology (University of Szeged). Healthy controls were voluntary staff members of the BRC or University of Szeged. Subjects were informed about the research by a physician. Written informed consent was obtained from all subjects, and our study was reviewed and approved by an independent ethical committee of the university. Labo- ratory studies and interpretations were performed on coded samples lacking personal and diagnostic identifiers.
The study adhered to the tenets of the most recent revision of the Declaration of Helsinki. Details about the study design and handling of biological materials were submitted to the Human Investigation Review Board of the University of Szeged under the 149/2019-SZTE Project Identification code.
2.2. Study Cohorts. The multiplex protein analysis of 60 drug-naive SAD patients, RA patients (n= 31, age median 57, 70.9% female (F), Supplementary Table 1); SLE patients (n= 19, age median 51, 89.4% F, Supplementary Table 2); SSc patients (n= 10, age median 51, 88.9% F, Supplementary Table 3), and 40 age- and gender-matched healthy controls (age median 48.5, 72.5% F) was performed.
We enrolled newly diagnosed drug-naive RA, SLE, and SSc patients, who had not received antirheumatic treatment,
including nonsteroidal anti-inflammatory drugs (NSAIDs), disease-modifying antirheumatic drugs (DMARDs), or glucocorticoids until the time of blood sampling. The RA patients were diagnosed according to the latest ACR/EULAR criteria [12] (Supplementary Table 1). The SLE patients who met the 2012 Systemic Lupus Collaborating Clinics (SLICC) criteria and in whom active, newly diagnosed SLE was present were considered eligible [13]. Several clinical and immunoserological parameters were present at the time of diagnosis of SLE (Supplementary Table 2). Ten newly diagnosed patients fulfilling the criteria proposed by the 2013 ACR/EULAR classification criteria for SSc were enrolled [14]. Two out of ten were further classified as those with limited cutaneous SSc, and eight out of ten with diffuse cutaneous scleroderma according to LeRoy et al. [15] (Supplementary Table 3). Healthy controls were age and gender matched to the patients, having a negative history of rheumatic symptoms and negative status upon detailed physical and laboratory examination. No comorbidities were detected in patients and controls that could have influenced our investigation, nor did they take any medication that could have interfered with the measurements.
2.3. Measurement of Plasma Proteins.After the withdrawal of 20 ml blood into an EDTA vacutainer (Becton Dickinson), human peripheral blood mononuclear cells and plasma samples were purified by Leucosep tubes (Greiner Bio- One, Austria). PBMCs were used for immunophenotyping in another project. Plasma fractions were stored at -80°C in aliquots before running the assay. Luminex xMAP tech- nology was used to determine the protein concentrations of 30 distinct cytokines/chemokines performing Procarta Plex™ Immunoassay (ThermoFisher Scientific, Waltham, MA, USA) according to the instructions of the manufac- turer. The Luminex panel was designed by the authors quantifying the proteins listed in Supplementary Table 4.
Briefly, all samples were thawed and diluted with sterile phosphate-buffered saline (PBS) to 1 : 1 and were tested in a blind fashion and in duplicate. 25μl volume of each sample, standard, and universal assay buffer was added to a 96-well plate (provided with the kit) containing 50μl of capture antibody-coated, fluorescent-coded beads.
Biotinylated detection antibody mixture and streptavidin- PE were added to the plate after the appropriate incubation period. After the last washing step, 120μl reading buffer was added to the wells, and the plate was incubated for an additional 5 minutes and read on the Luminex MAGPIX® instrument. Luminex xPonent 4.2 software was used for data acquisition. Five-PL regression curves were generated to plot the standard curves for all analytes by the Analyst 5.1 (Merck Millipore, Darmstadt, Germany) software calculating with bead median fluorescence intensity values. The panel of the investigated 30 plasma proteins and the range of the detection (in pg/ml from the lower limit to the upper limit) are available in the Supplementary Table 4. Data were pooled from two independent measurements and plotted in GraphPad Prism.
100
10
1
0.1
Control RA
IL-12p40
pg/ml
⁎⁎⁎
100
10
1
0.1 Control RA
IL-13
pg/ml
⁎⁎⁎
1000
100
10
1 Control RA
M-CSF
pg/ml
⁎
1000
100
10
1 Control RA
IFN-𝛾
pg/ml
⁎ 100
10
1
0.1
Control RA
IL-10
pg/ml
⁎
1000
100
10
1
Control RA
IL-4
IL-17A
pg/ml
⁎⁎
100000 ⁎⁎
10000 1000 100 10
Control RA
PYY⁎⁎⁎
10 100 1000
Control RA
pg/ml
MMP-12 10000 ⁎⁎
1000 100 10 1
Control RA
pg/ml
GITRL 100000 ⁎⁎
10000 1000 100 10
Control RA
pg/ml pg/ml
1000
100
10
1 Control RA
NTproBNP
pg/ml
⁎⁎
1000
100
10
1
Control RA
BMP-9
pg/ml
⁎
10000
1000
100
10
Control RA
TNFRSF6
pg/ml
⁎⁎
Figure1: The scatter plots of the protein concentrations of plasma proteins (pg/ml) in drug-naive RA (n= 31) patients versus age- and gender-matched healthy controls (n= 40) with significant differences (one-way ANOVA,∗p< 0:05;∗∗p< 0:01,∗∗∗p< 0:001) measured by the Luminex MAGPIX technology. The cleaved peptide tyrosine tyrosine PYY (3-36) was detected as being a novel marker of early-onset therapy-naive rheumatoid arthritis (RA) (∗∗∗p= 4 × 10⁻⁵). The arithmeticmean ± SEMare demonstrated for each cytokine (pg/ml) of RA (n= 31) patients versus age- and gender-matched healthy controls (n= 40). One dot is the average of two technical replicates.
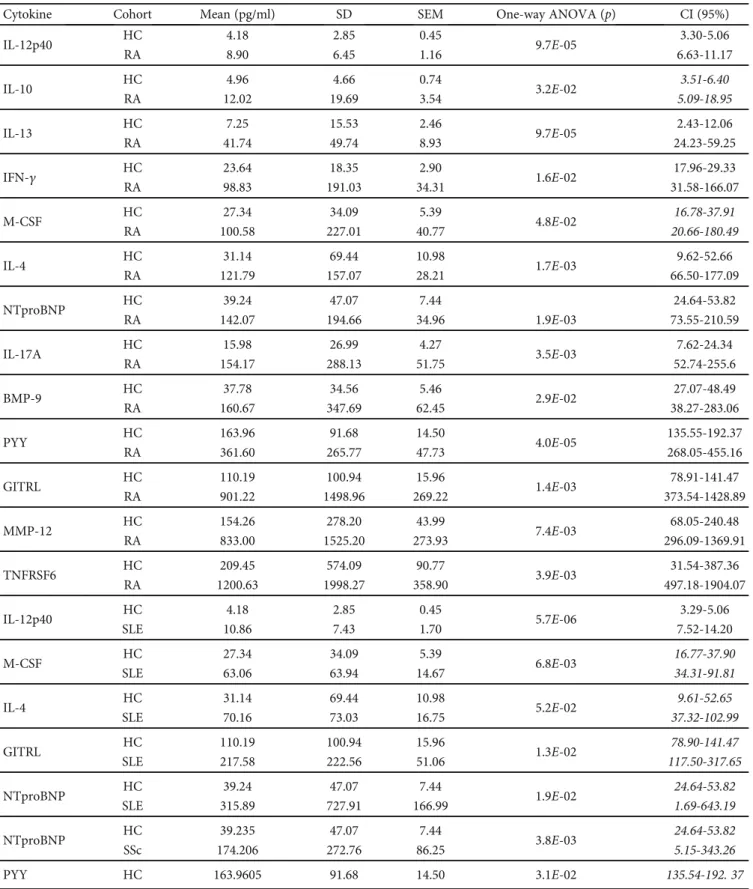
Table1: The summary of the significant differences of plasma cytokine concentrations between drug-naive autoimmune patients (RA, SLE, SSc) and healthy controls (HCs) in a pairwise comparison. The arithmetic means (mean), standard deviation (SD), and the standard error of the mean (SEM) of the plasma cytokine concentrations were calculated. The pairwise comparison of the concentrations of each cytokine of patients versus healthy controls (RA vs. HC; SLE vs. HC; SSc vs. HC) was carried out by one-way ANOVA (∗p< 0:05;∗∗p< 0:01,∗∗∗p< 0:001 ). The 95% confidence intervals (CI, 95%) were calculated between patients and HCs for each cytokine separately. Italic emphasis corresponds to overlapping patient’s CI with HCs.
Cytokine Cohort Mean (pg/ml) SD SEM One-way ANOVA (p) CI (95%)
IL-12p40 HC 4.18 2.85 0.45
9.7E-05 3.30-5.06
RA 8.90 6.45 1.16 6.63-11.17
IL-10 HC 4.96 4.66 0.74
3.2E-02 3.51-6.40
RA 12.02 19.69 3.54 5.09-18.95
IL-13 HC 7.25 15.53 2.46
9.7E-05 2.43-12.06
RA 41.74 49.74 8.93 24.23-59.25
IFN-γ HC 23.64 18.35 2.90
1.6E-02 17.96-29.33
RA 98.83 191.03 34.31 31.58-166.07
M-CSF HC 27.34 34.09 5.39
4.8E-02 16.78-37.91
RA 100.58 227.01 40.77 20.66-180.49
IL-4 HC 31.14 69.44 10.98
1.7E-03 9.62-52.66
RA 121.79 157.07 28.21 66.50-177.09
NTproBNP HC 39.24 47.07 7.44 24.64-53.82
RA 142.07 194.66 34.96 1.9E-03 73.55-210.59
IL-17A HC 15.98 26.99 4.27
3.5E-03 7.62-24.34
RA 154.17 288.13 51.75 52.74-255.6
BMP-9 HC 37.78 34.56 5.46
2.9E-02 27.07-48.49
RA 160.67 347.69 62.45 38.27-283.06
PYY HC 163.96 91.68 14.50
4.0E-05 135.55-192.37
RA 361.60 265.77 47.73 268.05-455.16
GITRL HC 110.19 100.94 15.96
1.4E-03 78.91-141.47
RA 901.22 1498.96 269.22 373.54-1428.89
MMP-12 HC 154.26 278.20 43.99
7.4E-03 68.05-240.48
RA 833.00 1525.20 273.93 296.09-1369.91
TNFRSF6 HC 209.45 574.09 90.77
3.9E-03 31.54-387.36
RA 1200.63 1998.27 358.90 497.18-1904.07
IL-12p40 HC 4.18 2.85 0.45
5.7E-06 3.29-5.06
SLE 10.86 7.43 1.70 7.52-14.20
M-CSF HC 27.34 34.09 5.39
6.8E-03 16.77-37.90
SLE 63.06 63.94 14.67 34.31-91.81
IL-4 HC 31.14 69.44 10.98
5.2E-02 9.61-52.65
SLE 70.16 73.03 16.75 37.32-102.99
GITRL HC 110.19 100.94 15.96
1.3E-02 78.90-141.47
SLE 217.58 222.56 51.06 117.50-317.65
NTproBNP HC 39.24 47.07 7.44
1.9E-02 24.64-53.82
SLE 315.89 727.91 166.99 1.69-643.19
NTproBNP HC 39.235 47.07 7.44
3.8E-03 24.64-53.82
SSc 174.206 272.76 86.25 5.15-343.26
PYY HC 163.9605 91.68 14.50 3.1E-02 135.54-192. 37
2.4. Statistical Analysis.The arithmetic mean (mean), stan- dard deviation (SD), and the standard error of the mean (SEM) of the plasma cytokine concentrations were calcu- lated. The pairwise comparison of the concentrations of each cytokine of patients versus healthy controls (RA vs. HC; SLE vs. HC; SSc vs. HC) was carried out by one-way ANOVA (∗p< 0:05; ∗∗p< 0:01, ∗∗∗p< 0:001). The 95% confidence intervals (CI, 95%) were calculated between patients and HCs for each cytokine separately. Calculations were done in Microsoft Excel.
3. Results and Discussion
The following 30 plasma cytokines in the custom Procarta Plex™ panel were quantified in the RA, SLE, and SSc patients and healthy controls (HCs): SDF-1a, GITRL, IL- 1b, IL-2, IL-4, IL-5, IL-33, IL-10, Insulin, PYY (3-36), CCL22, IL-13, IL-17A, Gal-3, FKN, IFN-γ, GM-CSF, Lep- tin, MMP-12, NTproBNP, MCP-1, APRIL, TNFRSF6,
BDNF, BMP-9, IL-12p40, BAFF, M-CSF, Survivin, and CD40-ligand (Supplementary Table 4). These markers under investigation were selected by the authors based on preliminary experiments and literature data. Thirteen cytokines were significantly elevated in RA vs. HCs (Figure 1); the concentrations of eleven cytokines in RA patients showed nonoverlapping confidence interval with HCs (Table 1).
The protein concentrations were the following (RA vs.
HC, mean ± SEM, respectively), IL-12p40: 8:90 ± 1:16 vs.
4:18 ± 0:45pg/ml; IL-13: 41:74 ± 8:93 vs. 7:25 ± 2:46pg/ml;
IFN-γ: 98:83 ± 34:31 vs. 23:64 ± 2:9pg/ml; IL-4: 121:79 ± 28:21 vs. 31:14 ± 10:98pg/ml; NTproBNT: 142:07 ± 34:96 vs. 39:24 ± 7:44pg/ml; IL-17A: 154:17 ± 51:57 vs. 15:98 ± 4:27pg/ml; BMP-9: 160:67 ± 62:45 vs. 37:78 ± 5:46pg/ml;
PYY (3-36): 361:6 ± 47:73 vs. 163:96 ± 14:5pg/ml; GITRL:
901:22 ± 269:22 vs. 110:19 ± 15:96pg/ml; MMP-12: 833:00
± 273:93 vs. 154:26 ± 43:99pg/ml; and TNFRSF6: 1200:63
± 358:90vs.209:45 ± 90:77pg/ml (Table 1 and Figure 1).
0.1
Control
IL-12p40
pg/ml
SLE 1
10
100 ⁎⁎⁎
1
Control
pg/ml
SLE 10
100 1000
IL-4
⁎
NTproBNP
⁎
GITRL
⁎ M-CSF
⁎⁎
1 Control
pg/ml
SLE 100
10 1000 10000
10
Control
pg/ml
SLE 100
1000 1
Control
pg/ml
SLE 100
10 10000
Figure2: The scatter plots of the protein concentrations (pg/ml) of SLE (n= 19) patients versus age- and gender-matched healthy controls (n= 40) with significant differences (one-way ANOVA,∗p< 0:05;∗∗p< 0:01,∗∗∗p< 0:001). One dot is the average of two technical replicates.
Table1: Continued.
Cytokine Cohort Mean (pg/ml) SD SEM One-way ANOVA (p) CI (95%)
SSc 232.962 68.12 21.54 190.73-275.18
MMP-12 HC 154.2605 278.20 43.99
2.1E-02 68.04-240.47
SSc 514.748 798.52 252.52 19.82-1009.66
Five cytokines, IL-12p40, M-CSF, IL-4, GITRL, and NTproBNP, were significantly elevated in SLE vs. HC (Figure 2), and only IL-12p40 had nonoverlapping CI with HC:10:86 ± 1:7vs.4:18 ± 0:45pg/ml (Table 1).
Three cytokines, NTproBNP, PYY (3-36), and MMP-12, were significantly increased in SScvs.HC (Figure 3), but all had overlapping CI (Table 1).
We are thefirst to report the cleaved peptide tyrosine tyrosine PYY (3-36) is an early marker of drug-naive RAvs.
HC. The margin of errors (ME) of the CI are 93.55 for PYY in the RA (n= 31) group and 28.41 for HC (n= 40), the 95% CI falls between 268.05 and 455.16 pg/ml (361.6 pg/ml mean ± 93:55 ME) for RA, and the 95% CI is between 135.55 and 192.37 pg/ml for HC (163.96 pg/ml mean ± 28:41 ME) (Table 1). Comparing the concentrations (mean ± SEM) of PYY (3-36) in RA (361:6 ± 47:7pg/ml) vs. SLE (189:3 ± 27:5pg/ml), it was significantly higher in RA (∗p= 1:07 × 10−2), and the CI is not overlapping; 95%
CI falls between 268.05 and 455.16 pg/ml for RA and 135.4 and 243.3 pg/ml for SLE. The amount of the PYY (3-36) had no significant difference (mean ± SEM) between RA (361:6 ± 47:7pg/ml) vs. SSC (232:9 ± 21:5pg/ml) with CI for RA (268.05-455.16 pg/ml, 95%) and SSC (190.73- 275.18 pg/ml, 95%). The amount of the PYY (3-36) had no significant difference (mean ± SEM) between SLE (189:3 ± 27:5pg/ml) and SSC (232:9 ± 21:5pg/ml) with CI for SLE (135.4-243.3 pg/ml, 95%) and SSC (190.73- 275.18 pg/ml, 95%). There was no difference in the concen- trations of the following cytokines in either RA, SLE, or SSc patients versus HCs: SDF-1a, IL-1b, IL-2, IL-5, IL-33, Insu- lin, CCL22, Gal-3, FKN, GM-CSF, Leptin, MCP-1, APRIL, BDNF, BAFF, Survivin, and CD40-ligand, respectively.
Thirteen cytokines showed significantly elevated concen- trations in the plasma of SAD patients, distinguishing RA (Figure 1), SLE (Figure 2), or SSc (Figure 3) from HCs,
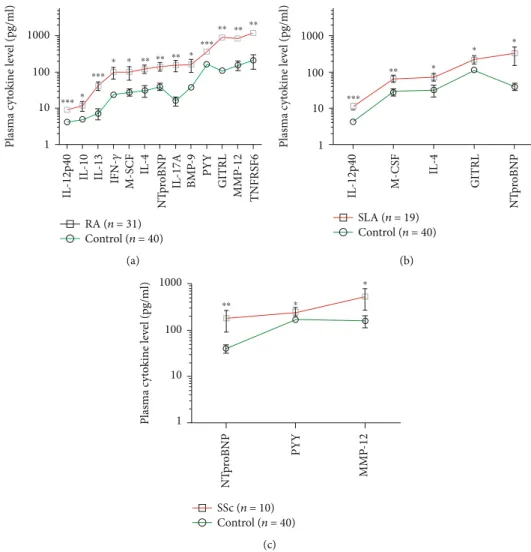
respectively. Arranging the values in an ascending order of the concentrations of the plasma cytokines as a prototype model delineates a characteristic cytokine/chemokine pat- tern of RA, SLE, and SSc. Therefore, after performing the assay, we propose a simple diagnostic algorithm fitting the curves of cytokine concentration values of early drug-naive SADs patients vs.HCs to diagnose drug-naïve RA, SLE, or SSc (Figure 4). Based on these data, we propose the machine-learning automated classification of drug-naïve RA, SLE, and SSc, which should be further verified in a ded- icated clinical study.
Better identification of the specific molecular players of the early stage of SADs may contribute to the recognition of novel prognostic markers and could facilitate the pathogenesis-appropriate timing of therapeutic interven- tions. In summary, we have quantified plasma proteins in early SAD patients, prior to therapeutic modification of the disease pathology. A characteristic pattern of soluble media- tors was revealed distinguishing early diagnosed therapy- naive RA, SLE, or SSc from HCs. These eleven markers with nonoverlapping CI (95%) were associated with RA: IL- 12p40, IL-10, IL-13, IFN-γ, M-CSF, IL-4, NTproBNP, IL- 17A, BMP-9, PYY, GITRL, MMP12, and TNFRSF6, and one marker, IL-12p40, with SLE versus HCs (Table 1). How- ever, we suggest our Luminex panel for in vitro diagnostics and the development of a simple algorithm to differentiate therapy-naive RA, SLE, or SSc based on the profile of protein concentrations (Figure 4).
There were no significant correlations in PYY (3-36) con- centration (pg/ml values) compared to CRP, ESR, RF, aMCV, and DAS28 scores in RA, separately. However, the concen- tration of two cytokines in the plasma of drug-naive RA patients, the IL-4 or GITRL concentrations, showed correlation with bioactive PYY (3-36) level, respectively.
(Supplementary Figure 1). The elevated GITRL or IL-4
1
Control
pg/ml
SSC 100
10 1000 10000 1
Control
pg/ml
SSC 100
10 1000
10
Control
pg/ml
SSC 100
1000 NTproBNP
⁎⁎
MMP-12
⁎
PYY
⁎
Figure3: The scatter plots of the protein concentrations (pg/ml) of SSc (n= 10) patients versus age- and gender-matched healthy controls (n= 40) with significant differences (one-way ANOVA,∗p< 0:05;∗∗p< 0:01,∗∗∗p< 0:001). One dot is the average of two technical replicates.
have been thoroughly studied in RA and associated with disease severity linked to Th17-cell activation or autoantibody induction, respectively [16, 17]. However, their association with the increased concentration with PYY (3-36) needs further mechanistic studies to explain. We describe here the cleaved peptide tyrosine tyrosine (PYY 3- 36) as a plasma marker of early-onset drug-naive RA. The 1-36 peptide YY (PYY) as a gut hormone has been reported to be activated by dipeptidyl peptidase-IV (DPP-IV or CD26) cleavage resulting in PYY (3-36) which binds to Y2 (coded byNPY2R) receptors in the hippocampus reducing appetite [18, 19]. Chen et al. showed that plasma PYY concentration was negatively correlated with the increase of body weight in RA patients followed by etanercept therapy [20]. The authors have no direct evidence, but the literature and our data may suggest that the elevated plasma PYY (3- 36) level contributes to the reduced appetite and cachexia of RA patients. Chen et al. already shed light on PYY as a link between the gastrointestinal neuroendocrine axis and
the immune system [21]. The possible role ofY2 receptor + microglia, monocytes/macrophages, granulocytes, and lymphocytes on the immune homeostasis and regulation of inflammation has been recently reviewed [22]. Further research is needed to ascertain the role of PYY (3-36) in early-onset RA and its possible effect on the innate or adaptive arm of the immune system and whether it has a regulatory effect or its increase in the blood is just a consequence of the pathomechanism of RA.
4. Conclusions
We are the first to report PYY (3-36) as a specific plasma marker of drug-naive RA. Additionally, the multiplex analy- sis of 30 plasma proteins supported a disease-specific cyto- kine pattern in RA, SLE, and SSc, respectively. Based on these data, we could delineate a prototype model for the machine-learning automated classification of drug-naive RA, SLE, and SSc.
1
IL-12p40 IL-10 IL-13 IFN-𝛾 M-SCF IL-4 NTproBNP IL-17A BMP-9 PYY GITRL MMP-12 TNFRSF6
10
RA (n = 31) Control (n = 40) 100
Plasma cytokine level (pg/ml) 1000
⁎⁎⁎ ⁎
⁎⁎⁎
⁎ ⁎ ⁎⁎ ⁎⁎ ⁎⁎ ⁎ ⁎⁎⁎
⁎⁎ ⁎⁎ ⁎⁎
(a)
IL-12p40 M-CSF IL-4 NTproBNPGITRL
1 10 100
Plasma cytokine level (pg/ml) 1000
⁎⁎⁎
⁎⁎ ⁎
⁎ ⁎
SLA (n = 19) Control (n = 40)
(b)
NTproBNP PYY MMP-12
1 10 100
Plasma cytokine level (pg/m
l) 1000
⁎⁎ ⁎
⁎
SSc (n = 10) Control (n = 40)
(c)
Figure4: The concentrations of plasma cytokines (pg/ml) in the ascending order of (a) RA (n= 31), (b) SLE (n= 19), and (c) SSc (n= 10) patients versus age- and gender-matched healthy controls (n= 40) measured by the Luminex MAGPIX technology. The cleaved peptide tyrosine tyrosine PYY (3-36) is a novel marker of early-onset therapy-naive rheumatoid arthritis (RA) (∗∗∗p= 4 × 10⁻⁵). The arithmetic mean ± SEM are demonstrated for each cytokine on a log10 scale in GraphPad Prism software. The connecting lines delineate a characteristic pattern of proteins measured specific to drug-naive autoimmune diseases (red) such as (a) RA, (b) SLE, and (c) SSc or healthy controls (green).
Data Availability
Additional data are in the Supplementary Files, or raw data can be requested from the corresponding author.
Conflicts of Interest
The authors declare that there is no conflict of interest regarding the publication of this paper.
Acknowledgments
This research was funded by the following grants: GINOP- 2.3.2-15-2016-00001 (BRC), GINOP-2.3.2-15-2016-00030 (BRC and UoS), 2017-1.3.1-VKE-2017-00028 (Avicor), and 2018-1.3.1-VKE-2018-00024 (BRC and Avidin) from the National Research, Development and Innovation Office (NKFI), Hungary. This study was prepared with the profes- sional support of the doctoral student scholarship program of the cooperative doctoral program of the Ministry of Inno- vation and Technology financed by the National Research, Development and Innovation Fund for Jozsef A. Balog (KDP-17-4/PALY-2021, 1000464).
Supplementary Materials
Supplementary 1. Supplementary Table 1: clinical character- istics of RA study participants. The median DAS28 disease activity score was 6.01, and Q1-Q3 interquartiles were 5.4- 6.5. Several clinical and immunoserological parameters were present at the time of diagnosis of RA including RF: rheuma- toid factor; MCV: mutated citrullinated vimentin; CRP: C- reactive protein; ESR: erythrocyte sedimentation rate. Data are expressed as median and interquartile range (Q1, Q3) for continuous variables and as number (n) and (%) for cat- egorical variables. BLD: below the detection limit.
Supplementary 2. Supplementary Table 2: clinical character- istics of SLE study participants. The median SLEDAI-2K activity score was 16, and Q1-Q3 interquartiles were 10-21.
Several clinical and immunoserological parameters were present at the time of diagnosis of SLE including ANA (anti- nuclear antibodies); anti-DNA antibody; LA (lupus anticoag- ulant) (activated partial thromboplastin time > 40s, 8/19);
hemolytic anemia (hematocrit < 0:35, 4/19); nonhemolytic anemia (hematocrit < 0:35, 4/19); leukopenia (leukocyte count < 3000/mm3, 8/19); lymphopenia (lymphocyte count
< 1500/mm3, 7/19); and thrombocytopenia (thrombocyte count < 100000/×106l, 7/19). Data are expressed as median and interquartile range (Q1, Q3) for continuous variables and as number (n) and (%) for categorical variables.
Supplementary 3. Supplementary Table 3: clinical character- istics of SSc study participants. Several clinical and immuno- serological parameters were present at the time of diagnosis of SSc including ANA (antinuclear antibodies); anti-Scl-70, anti-Scl-70 antibodies; ACA (anticentromere antibodies);
and anti-RNA polymerase III antibodies. Data are expressed as median and interquartile range (Q1, Q3) for continuous variables and as number (n) and (%) for categorical variables.
dcSSc: diffuse cutaneous SSc; lcSSc: limited cutaneous SSc;
skin scoreb: modified Rodnan skin thickness score.
Supplementary 4. Supplementary Table 4: the list of the pro- teins measured in the plasma of the human subjects enrolled in the study. The lower range of the detection corresponds to the threshold of the sensitivity of the assay. The Procarta Plex™panel was designed by the authors, and the assay was loaded on a MAGPIX Luminex instrument.
Supplementary 5. Supplementary Figure 1: the Pearson corre- lations of the plasma concentrations of IL-4vs.PYY (3-36) or GITRLvs.PYY (3-36) in RA patients were analyzed in Micro- soft Excel. The Pearson correlation coefficients were 0.819 for IL-4 vs. PYY (3-36) and 0.864 for GITRL vs. PYY (3-36). Thet -statistic (t) was calculated in Microsoft Excel following this equation≔ðr∗SQRTðn−2ÞÞ/ðSQRTð1−r2ÞÞ, where n is number of subjects and r is the Pearson coefficient. Then, the p value was calculated in Microsoft Excel following this equation:= TDISTðt, DF, tailsÞ, whereDF =n−2, degree of freedom. Thepwas1:8 × 10⁻⁸(∗∗∗) for the correlation of IL-4 vs. PYY (3-36) concentrations. Thepwas3:9 × 10⁻¹⁰ (∗∗∗) for the correlation of GITRL vs. PYY (3-36) concentrations.
References
[1] F. Goldblatt and S. G. O'Neill,“Clinical aspects of autoimmune rheumatic diseases,”Lancet, vol. 382, no. 9894, pp. 797–808, 2013.
[2] M. Wahren-Herlenius and T. Dorner, “Immunopathogenic mechanisms of systemic autoimmune disease,” Lancet, vol. 382, no. 9894, pp. 819–831, 2013.
[3] M. G. P. Zuidgeest, P. M. J. Welsing, G. van Thiel et al.,“Series:
pragmatic trials and real world evidence: paper 5. Usual care and real life comparators,”Journal of Clinical Epidemiology, vol. 90, pp. 92–98, 2017.
[4] R. Giacomelli, A. Afeltra, A. Alunno et al.,“Guidelines for bio- markers in autoimmune rheumatic diseases - evidence based analysis,”Autoimmunity Reviews, vol. 18, no. 1, pp. 93–106, 2019.
[5] B. Nakken, G. Papp, V. Bosnes, M. Zeher, G. Nagy, and P. Szodoray, “Biomarkers for rheumatoid arthritis: from molecular processes to diagnostic applications-current con- cepts and future perspectives,”Immunology Letters, vol. 189, pp. 13–18, 2017.
[6] B. Kolarz, D. Podgorska, and R. Podgorski,“Insights of rheu- matoid arthritis biomarkers,” Biomarkers, vol. 26, no. 3, pp. 185–195, 2021.
[7] C. Arriens, J. D. Wren, M. E. Munroe, and C. Mohan,“Sys- temic lupus erythematosus biomarkers: the challenging quest,” Rheumatology, vol. 56, article kew407, 2017.
[8] M. Aringer,“Inflammatory markers in systemic lupus erythe- matosus,”Journal of Autoimmunity, vol. 110, p. 102374, 2020.
[9] B. Skaug and S. Assassi,“Biomarkers in systemic sclerosis,” Current Opinion in Rheumatology, vol. 31, no. 6, pp. 595– 602, 2019.
[10] P. J. Wermuth, S. Piera-Velazquez, J. Rosenbloom, and S. A.
Jimenez,“Existing and novel biomarkers for precision medi- cine in systemic sclerosis,” Nature Reviews Rheumatology, vol. 14, no. 7, pp. 421–432, 2018.
[11] M. J. Lewis, M. R. Barnes, K. Blighe et al.,“Molecular portraits of early rheumatoid arthritis identify clinical and treatment
response phenotypes,”Cell Reports, vol. 28, no. 9, pp. 2455– 2470.e5, 2019.
[12] D. Aletaha, T. Neogi, A. J. Silman et al.,“2010 Rheumatoid arthritis classification criteria: an American College of Rheu- matology/European League Against Rheumatism collabora- tive initiative,” Arthritis and Rheumatism, vol. 62, no. 9, pp. 2569–2581, 2010.
[13] M. Petri, A. M. Orbai, G. S. Alarcon et al.,“Derivation and val- idation of the Systemic Lupus International Collaborating Clinics classification criteria for systemic lupus erythemato- sus,” Arthritis and Rheumatism, vol. 64, no. 8, pp. 2677– 2686, 2012.
[14] F. van den Hoogen, D. Khanna, J. Fransen et al.,“2013 classi- fication criteria for systemic sclerosis: an American College of Rheumatology/European League against Rheumatism collabo- rative initiative,”Arthritis and Rheumatism, vol. 65, no. 11, pp. 2737–2747, 2013.
[15] E. C. LeRoy, C. Black, R. Fleischmajer et al.,“Scleroderma (sys- temic sclerosis): classification, subsets and pathogenesis,”The Journal of Rheumatology, vol. 15, no. 2, pp. 202–205, 1988.
[16] J. Tian, B. Zhang, K. Rui, and S. Wang,“The role of GITR/- GITRL interaction in autoimmune diseases,” Frontiers in Immunology, vol. 11, article 588682, 2020.
[17] C. Dong, T. Fu, J. Ji, Z. Li, and Z. Gu,“The role of interleukin-4 in rheumatic diseases,”Clinical and Experimental Pharmacol- ogy & Physiology, vol. 45, no. 8, pp. 747–754, 2018.
[18] M. Kjaergaard, C. B. G. Salinas, J. F. Rehfeld, A. Secher, K. Raun, and B. S. Wulff,“PYY(3-36) and exendin-4 reduce food intake and activate neuronal circuits in a synergistic man- ner in mice,”Neuropeptides, vol. 73, pp. 89–95, 2019.
[19] A. De Silva and S. R. Bloom,“Gut hormones and appetite con- trol: a focus on PYY and GLP-1 as therapeutic targets in obe- sity,”Gut and Liver, vol. 6, no. 1, pp. 10–20, 2012.
[20] C. Y. Chen, C. Y. Tsai, P. C. Lee, and S. D. Lee,“Long-term eta- nercept therapy favors weight gain and ameliorates cachexia in rheumatoid arthritis patients: roles of gut hormones and lep- tin,” Current Pharmaceutical Design, vol. 19, no. 10, pp. 1956–1964, 2013.
[21] C. Y. Chen and C. Y. Tsai,“From endocrine to rheumatism: do gut hormones play roles in rheumatoid arthritis?,”Rheumatol- ogy, vol. 53, no. 2, pp. 205–212, 2014.
[22] W. C. Chen, Y. B. Liu, W. F. Liu, Y. Y. Zhou, H. F. He, and S. Lin, “Neuropeptide Y is an immunomodulatory factor:
direct and indirect,”Frontiers in Immunology, vol. 11, article 580378, 2020.