Citation:Náfrádi, M.; Alapi, T.;
Bencsik, G.; Janáky, C. Impact of Reaction Parameters and Water Matrices on the Removal of Organic Pollutants by TiO2/LED and ZnO/LED Heterogeneous
Photocatalysis Using 365 and 398 nm Radiation.Nanomaterials2022,12, 5.
https://doi.org/10.3390/
nano12010005 Academic Editors: Imre Miklós Szilágyi and Klára Hernádi Received: 5 November 2021 Accepted: 15 December 2021 Published: 21 December 2021 Publisher’s Note:MDPI stays neutral with regard to jurisdictional claims in published maps and institutional affil- iations.
Copyright: © 2021 by the authors.
Licensee MDPI, Basel, Switzerland.
This article is an open access article distributed under the terms and conditions of the Creative Commons Attribution (CC BY) license (https://
creativecommons.org/licenses/by/
4.0/).
nanomaterials
Article
Impact of Reaction Parameters and Water Matrices on the Removal of Organic Pollutants by TiO 2 /LED and ZnO/LED Heterogeneous Photocatalysis Using 365 and 398 nm Radiation
MátéNáfrádi1 , Tünde Alapi1,* , Gábor Bencsik2 and Csaba Janáky2
1 Department of Inorganic and Analytical Chemistry, University of Szeged, Dóm tér 7, H-6720 Szeged, Hungary; nafradim@chem.u-szeged.hu
2 Department of Physical Chemistry and Materials Science, University of Szeged, Rerrich Béla tér 1, H-6720 Szeged, Hungary; bencsikg@chem.u-szeged.hu (G.B.); janaky@chem.u-szeged.hu (C.J.)
* Correspondence: alapi@chem.u-szeged.hu
Abstract:In this work, the application of high-power LED365nmand commercial, low-price LED398nm for heterogeneous photocatalysis with TiO2and ZnO photocatalysts are studied and compared, focusing on the effect of light intensity, photon energy, quantum yield, electrical energy consumption, and effect of matrices and inorganic components on radical formation. Coumarin (COU) and its hydroxylated product (7-HC) were used to investigate operating parameters on the•OH formation rate. In addition to COU, two neonicotinoids, imidacloprid and thiacloprid, were also used to study the effect of various LEDs, matrices, and inorganic ions. The transformation of COU was slower for LED398nmthan for LED365nm, but r07-HC/r0COUratio was significantly higher for LED398nm. The COU mineralization rate was the same for both photocatalysts using LED365nm, but a significant difference was observed using LED398nm. The impact of matrices and their main inorganic components Cl−and HCO3−were significantly different for ZnO and TiO2. The negative effect of HCO3−was evident, however, in the case of high-power LED365nmand TiO2, and the formation of CO3•−almost doubled the r07-HCand contributes to the conversion of neonicotinoids by altering the product distribution and mineralization rate.
Keywords:hydroxyl radical; carbonate radical; matrix effect; coumarin; neonicotinoid
1. Introduction
Advanced Oxidation Processes (AOPs) may offer a solution to remove trace amounts of organic pollutants from aqueous and gaseous media [1]. In the case of AOPs, in addition to efficiency, energy demand is also important, and the light source in photochemical processes determines both. Heterogeneous photocatalysis based on the irradiation of the appropriate semiconductor photocatalysts is a widely investigated method. The absorption of photons having higher energy than the bandgap of the photocatalyst leads to the formation of excited conduction band electrons (eCB−) and valence band holes (hVB+) [2]. In addition to recombination [3], the photogenerated charge carriers initiate the transformation of organic compounds via direct charge transfer on the surface of the catalysts or lead to the formation of various reactive oxygen species (ROS) [4]. The most important ROS is the hydroxyl radical (•OH) thanks to its high reactivity and low selectivity, resulting in fast transformation and adequate mineralization of organic pollutants during heterogeneous photocatalysis [2,5,6].
The two most widespread commercially available photocatalysts are TiO2and ZnO, having relatively wide bandgaps; therefore, UV light is needed for their effective excitation.
The bandgap reported for TiO2is 3.0 eV for rutile and 3.2 eV for anatase phase; this value also varies between 3.1−3.3 for ZnO [7,8]. TiO2has gained popularity due to its high activity, stability, chemical and biological inactivity, and relatively low price. ZnO is also widely investigated, as it has similar properties to TiO2, and lower production cost. The
Nanomaterials2022,12, 5. https://doi.org/10.3390/nano12010005 https://www.mdpi.com/journal/nanomaterials
Nanomaterials2022,12, 5 2 of 21
higher electronic conductivity of ZnO results in a faster charge transfer with the species on the surface and, consequently, lower recombination rates than TiO2[9,10]. However, the photocatalytic properties of ZnO depend on the morphology and particle size [11–13], and its susceptibility to photo-corrosion limits its application [14,15].
Excitation of TiO2and ZnO catalysts has traditionally been performed using different UV lamps (black lights, mercury vapor lamps, xenon lamps) [16]. Recently, Light Emitting Diodes (LEDs) have gained popularity thanks to new LEDs emitting in the UV-A region with high intensity, good electric efficiency [17], and several advantages compared to traditional UV sources, such as narrow wavelength ranges, which allow the construction of specialized photoreactors [17–19]. The UV-LED can be considered a quasi-monochromatic light source since the output energy is narrowly (λmax±10 nm) distributed around the maximum of the wavelength. Depending on the wavelength used, they can have better electrical efficiency than traditional UV sources [20,21]. LEDs are also available at an affordable price while being compact and robust—thus, flexible and efficient photochemical setups can be constructed [16], and they have a significantly longer lifetime (>10,000 h). The application of UV-LEDs offers an alternative solution for the excitation of photocatalysts and has been employed for heterogeneous photocatalysis in recent years [20,22,23]. It is challenging to find the best design for photoreactors, such as optimizing the distribution and number of LEDs and light intensity [24].
For heterogeneous photocatalysis, the most important factors affecting the transfor- mation rate of a given organic substrate and photocatalyst are the concentration of the substrate, the photocatalysts’ load, and the light intensity. In addition to these factors, the interaction between the substrate and photocatalysts’ surface, the properties of the photocatalysts, and the reactivity of the target substance towards possibly formed various reactive species are also significant [25]. The formation rate of photogenerated charges primarily depends on the light intensity and the absorption properties of the photocatalyst at the given wavelength [26–28]. The transformation rate of the target substances depends on the number of photogenerated charges migrated to the surface, which is highly limited by their recombination in bulk, which reduces the availability of photogenerated charges for redox reactions on the surface. It is found that the intensity (the photon flux or photon density) has a substantial impact on the lifetime of charge carriers [28–30]. The authors found that at low photon flux there is a linear relationship between the transformation rate and photon flux, while at high photon flux, the transformation rate exhibited a square root dependency on the light intensity [27,31]. However, the role and significance of wave- length [31–34] and “extra energy” of photons (the difference between the photon energy and bandgap energy) [10] for charge separation and recombination rate efficiency is rarely studied, and the results reported are relatively diffuse.
The efficiency of heterogeneous photocatalysis also depends on the properties of the treated water (e.g., pH, ionic content, dissolved organic matter). The matrix components may affect the surface properties of the photocatalyst, such as the surface charge and the adsorption of target pollutants, or act may as radical scavengers reacting with the photogenerated charges and ROS [35–39]. The role of inorganic ions is often discussed as radical scavengers [35–37]; their reaction with photogenerated charges is examined less fre- quently [38,40]. The fate of the radicals and/or radical ions originated from these inorganic ionic components of matrices, and their role and contribution to the transformation of target organic components during heterogeneous photocatalysis are not yet fully clarified. Our knowledge on the effect of matrices during AOPs is still limited; despite the high number of papers published on the topic, only a small fraction worked with actual wastewaters and even less investigated the effect of each matrix component in detail [41]. Another important shortcoming is that the publications focus on the effect on the conversion rate of the starting compound. However, the effect of the individual matrix components can balance each other, and the effects are manifested in the change of product distribution or the mineralization rate [41,42].
Nanomaterials2022,12, 5 3 of 21
Coumarin (COU) and two neonicotinoids are used as target substances in this work. COU is used to compare•OH formation rate in the case of heterogeneous photocatalysis [5,43–51].
Neonicotinoids are a class of insecticides causing severe environmental problems, the most well-known being their harmful effect on pollinators [52,53]. They can also have other adverse effects, such as toxicity on non-target organisms [54] or endocrine disruptive effects [55]. The use of several neonicotinoids, such as acetamiprid, imidacloprid (IM- IDA), and thiacloprid (THIA) has been restricted by the European Union [56], but they are still extensively used worldwide. The efficiency of their photolytic removal varies;
therefore, several AOPs have already been employed to treat neonicotinoid-containing waters, including homogeneous and heterogeneous photocatalysis [57–60].
This research aimed to compare the efficiency of commercial TiO2and ZnO photocata- lysts irradiated with a high-power UV-A LED (HP LED365nm) having a maximum emission of 365 nm and cheap, commercial LEDs with lower electric power consumption (LED398nm) having a maximum emission of 398 nm. The formation rate of the•OH, the essential reactive species, was compared based on the formation rate of the hydroxylated product (7-hydroxy-coumarin (7-HC)) of coumarin (COU). The effect of photon flux, catalyst dosage, and COU concentration was investigated, and reaction parameters were optimized based on the rate and quantum yield of 7-HC formation. Two neonicotinoid pesticides, IMIDA and THIA, as environmentally relevant target substances, were chosen to compare the application of the TiO2and ZnO photocatalysts and LEDs emitting 365±10 nm and 398± 10 nm light. The transformation and mineralization rate, photonic efficiency, and electric power consumption required for the transformation were determined. The formation of organic products, inorganic ions, and change in the ecotoxicity during treatment was also measured. AOPs, including heterogeneous photocatalysis, can be used as an effective tertiary treatment for removing micropollutants, which remain in the water after the con- ventional physical-biological processes. The oxidation rate is affected by the dissolved organic matter and inorganic species of the water matrix. Accordingly, two water matrices were used in this work, biologically treated domestic wastewater with relatively high ionic and low organic content and tap water having lower ionic and organic content. Special attention was paid to studying the effect of Cl−and HCO3−, and their combined effect as the main inorganic components of both matrices.
2. Materials and Methods
2.1. Photochemical Reactors and Light Sources
One of the photoreactors was equipped with high-power UV-A LEDs (Vishay; Malvern, USA; VLMU3510-365-130; LED365nm) emitting light from 355–380 nm, with UV-emission maximum at 365 nm. The 12 SMD diodes were soldered on metal core printed circuit boards (Meodex, Narbonne, France) and fixed on aluminum heat sinks (Fischer Elektronik;
Lüdenscheid, Germany 0.70 K W−1). A laboratory power supply (Axiomet, Malmö, Swe- den; AX-3005DBL-3; maximum output 5.0 A/30.0 V) was used to provide and control the electrical power needed to operate the light sources (Pelmax = 21 W). The 200 cm3solutions were irradiated in a cylindrical borosilicate [61] glass reactor, and the suspension was bubbled with gas (N2(99.995%) or synthetic air) (Figure S1).
The other photoreactor was equipped with UV-Vis LEDs (LED398nm) emitting light from 385–420 nm, with an emission maximum at 398 nm. The cheap, commercial LED398nm
tape (LEDmaster, Szeged, Hungary; Pelmax = 4.6 W; 60 LED m−1) was fixed on the inner side of a water-cooled aluminum tube. The 100 cm3solution was irradiated in a cylindrical borosilicate glass reactor (Figure S1). The electrical power of the LEDs was regulated by the power supply (100%, 50%, or 25% of Pradiantmax).
The emission spectra of the used light sources were measured using a two-channel fiber-optic CCD spectrometer (AvaSpec-FT2048, Avantes, The Netherlands) operated in the 180–880 nm wavelength range. The electric power consumption of LED398nmwas determined with a digital multimeter (Maxwell 25331; Oakland, CA, USA).
Nanomaterials2022,12, 5 4 of 21
2.2. Photochemical Experiments and Analytical Methods
The photon flux of the light sources was measured by potassium-ferrioxalate actinom- etry, a standard one recommended by IUPAC [62] that is widely investigated and applied in the literature [62–69]. The 1.0×10⁻²M Fe3+-oxalate solutions were irradiated, the released Fe2+was measured after complexation with 1,10-phenanthroline. The absorbance of the Fe2+-phenanthroline complex was measured at 510 nm using UV-Vis spectrophotometry (Agilent 8453, Santa Clara, CA, USA) in a quartz cuvette with a 0.20 cm optical path length.
The quantum yields applied for the calculation of the photon flux were slightly different:
1.21 for LED365nmand 1.14 for LED398nm[63].
During photocatalytic experiments, two commercially available photocatalysts were used, TiO2Aeroxide P25®(Acros Organics) and ZnO (d < 100 nm, Sigma Aldrich; St. Louis, MO, USA). Diffuse reflectance spectroscopy (DRS) was performed using an Ocean Optics USB4000 detector and Ocean Optics DH-2000 light source. The bandgap energy values of the photocatalysts were evaluated by the Kubelka–Munk approach and the Tauc plot.
The initial transformation rate of COU (r0COU) and the initial formation rate of 7-HC (r07-HC) were determined from the linear part of the kinetic curves, up to 15% trans- formation of COU. Before analysis, the samples were centrifuged (Dragonlab; Beijing, China 15000 RPM) and filtered using syringe filters (FilterBio Nantong, China; PVDF-L;
0.22µm). The COU concentration was measured using UV-Vis spectrophotometry at 277 nm (ε277nm= 10293 M−1cm−1). The concentration of COU in the treated sample was also determined by spectrophotometry and HPLC measurements. The difference between the determined concentrations for the same samples was less than 10%, so spectrophotomet- ric determination was used for further experiments. The UV-Vis absorption and emission spectra of the model compounds are summarized in Figure S2. The concentration of the formed 7-HC was determined using fluorescence spectroscopy (Hitachi F-4500; Tokyo, Japan); the excitation and emission wavelengths were 345 nm and 455 nm, respectively.
The concentration of IMIDA and THIA were determined by HPLC-DAD (Agilent;
Santa Clara, CA, USA 1100, column: Lichrosphere 100, RP-18; 5µm). The eluent consisted of 40v/v% methanol (MeOH) and 60v/v% water, the flow rate was 1.0 cm3min−1, the temperature was set to 30◦C. Detection of IMIDA and THIA was performed at 270 nm and 242 nm, respectively; their retention time was 5.1 min and 9.1 min. The determination of the products was carried out by HPLC-MS measurements, with an Agilent LC/MSD VL mass spectrometer (Agilent, Santa Clara, CA, USA) coupled to the HPLC. The measurements were performed using an APCI ion source and a triple quadruple analyzer in positive mode (4000 V capillary voltage, 60 V fragmentor voltage, and 4.0µA corona current). The flow rate of the drying gas was 4.0 dm3min−1, and its temperature was 200◦C. The scanned mass range was between 50–500 AMU.
Total Organic Carbon (TOC) concentration was determined using an Analytik Jena (Jena, Germany) N/C 3100 analyzer. The formation of inorganic ions (Cl−, NO2−, NO3−, SO42− and NH4+) was measured using ion chromatography (Shimadzu, Kyoto, Japan) Prominence LC-20AD, Shodex 5U-YS-50 column for cation detection, and Shodex NI-424 5U for anion detection). The eluent for cations and anions was 4.0 mM methanesulfonic acid and a mixture of 2.5 mM phthalic acid and 2.3 mM aminomethane, respectively. The flow rate of the mobile phase was 1.0 cm3min−1.
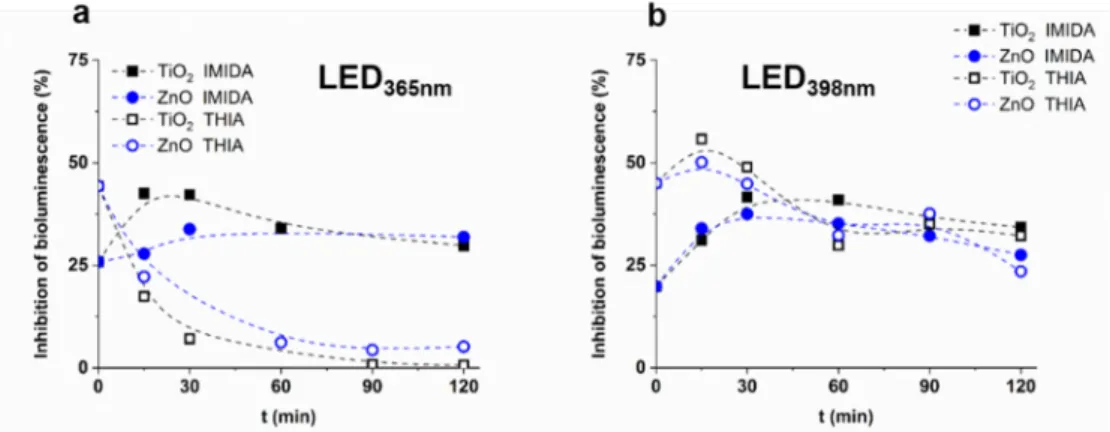
Ecotoxicity tests (LCK480, Hach Lange GmbH, Düsseldorf, Germany) were based on the bioluminescence inhibition of the marine bacteriaVibrio fischeri. H2O2, which form during the transformation of organic substances, was decomposed in the samples by adding catalase enzyme before starting the ecotoxicity tests. The catalase concentration in the samples was 0.20 mg dm−3. The bioluminescence of the test organism was measured using a Lumistox 300 (Hach Lange) luminometer after 30 min incubation time.
2.3. Chemicals and Solvents Used
Two commercial photocatalysts, TiO2Aeroxid®P25 (Sigma Aldrich; St. Louis, MO, USA) and ZnO (Sigma Aldrich; St. Louis, MO, USA, <100 nm) were used. The used TiO2
Nanomaterials2022,12, 5 5 of 21
photocatalysts consist of 76–78% anatase phase and 10–16% rutile phase. The presence of amorphous TiO2was also reported [70–72]. ZnO contains only wurtzite phase. The list of used chemicals can be found in Table S1. The water matrices used were tap water (Szeged, Hungary) and biologically treated domestic wastewater (Szeged, Hungary); their parameters are summarized in Table S2.
3. Results and Discussion
3.1. Photon Flux and Electrical Efficiency of the LEDs
The photon flux of both LEDs changes linearly with the electric power consumption (Figure S3) in the investigated range. For the photoreactor equipped with 12 pieces of LED365nm, the photon flux changed from 2.83×10⁻⁶to 1.71×10⁻⁵molphotons−1when electric power increased from 3.4 W to 20.8 W. For LED398nm, the change of electric power from 0.96 W to 4.68 W increased the photon flux from 1.2×10⁻⁶to 4.6×10⁻⁶molphoton s−1. In this case, 60 pieces of LEDs irradiated the reactor volume. The obtained electrical efficiencies (Pradiant/Pelectric) were 27% for LED365nmregardless of the photon flux, and 30–37% for LED398nm, decreasing with the increase of the photon flux (Table S3).
3.2. Effect of Reaction Parameters on the•OH Formation
The reaction between COU and•OH (kCOU+•OH= 6.9×10⁹M−1s−1[73]) radicals results in a highly fluorescent molecule, 7-hydroxycoumarin (7-HC). This method is fast and adequate with sufficient sensitivity, and it has been applied for detecting•OH rad- icals produced in a photocatalytic system by many authors [5,43–51,73–75]. Thus, the optimization of reaction parameters was based on the formation rate and quantum yield of 7-HC formation for both light sources (LED365nmand LED398nm) and photocatalysts (TiO2and ZnO). The effect of the fundamental parameters, such as photocatalyst and COU concentration, and the photon flux was investigated. The relative adsorbed amount of COU and 7-HC was less than <1.0% in each case.
The photon flux was adjusted to a similar value (5.52 × 10⁻⁶ molphoton s−1 for LED365nmand 4.68×10⁻⁶molphotons−1for LED398nm) when the effect of the initial COU concentration and catalyst dosage were studied. The effect of photocatalyst dosage (0–
1.5 g dm−3) was determined at 5.0×10⁻⁴M COU concentration. For LED365nm,over 0.5 g dm−3, the transformation rate of COU (r0COU) slightly increased or did not change significantly (Figure1a). The r0COUvalues determined for ZnO exceeded that determined for TiO2; however, the 7-HC formation (r07-HC) was faster for TiO2than for ZnO, indicating a more efficient•OH formation. A plausible explanation of this fact can be the relatively higher contribution of the direct charge transfer to the COU transformation for ZnO than for TiO2. The r07-HC value became constant above 0.5 g dm−3for both photocatalysts (6.4×10⁻⁹mol dm−3s−1and 4.7×10⁻⁹mol dm−3s−1for TiO2and ZnO, respectively).
When LED398nmwas applied, the r0COUand r07-HCincreased to 1.0 g dm−3(Figure1b).
Consequently, for further experiments, 1.0 g dm−3photocatalyst concentration was used.
Applying LED365nm, r0COUand r07-HCreached the maximum at 5.0×10⁻⁴M COU concentration and did not change significantly with the further increase (Figure1c). In the case of LED398nm,a similar trend was observed; the r07-HCreached the maximum value at 5.0×10⁻⁴M COU (Figure1d), although the r0COUslightly increased. Consequently, for further experiments, 5.0×10⁻⁴M COU and 1.0 g dm−3catalyst concentrations were used to maximize the r07-HC.
Nanomaterials2022,12, 5 6 of 21
Nanomaterials 2022, 12, x FOR PEER REVIEW 6 of 21
Figure 1. The effect of catalyst load (a,b), COU initial concentration (c,d), and photon flux (e,f) on the initial transformation rate of COU and 7-HC.
At constant photocatalyst (1.0 g dm−3) and COU (5.0 × 10⁻⁴ M) concentrations, the formation rate of photogenerated charges depends on the photon flux. Therefore, experi- ments were performed at different light intensities (Figure 1e,f). Since increasing the pho- ton flux can be achieved by increasing the electrical energy investment, these results are also crucial in optimizing the operation cost of heterogeneous photocatalysis. Using LED365nm, high values of ΦappCOU and Φapp7-HC were obtained at relatively low photon fluxes;
the apparent quantum efficiency significantly decreases with the photon flux increase (Ta- ble 1), while r0 values change according to a saturation curve. Doubling the electrical power (6.55 → 13.60 W) and the photon flux in this way, the r0 values increased by only 20–30%, and the further increases (13.60 → 20.77 W) did not change that significantly for both photocatalysts. For LED398nm the r0 values increased, and there was no significant change of the apparent quantum yield within the photon flux range applied in the case of TiO2. A similar trend was observed for ZnO for both LEDs (Table 1) than for TiO2 and LED365nm; the Φapp value (especially the Φapp7-HC) decreased with the intensity increase.
Figure 1.The effect of catalyst load (a,b), COU initial concentration (c,d), and photon flux (e,f) on the initial transformation rate of COU and 7-HC.
At constant photocatalyst (1.0 g dm−3) and COU (5.0× 10⁻⁴ M) concentrations, the formation rate of photogenerated charges depends on the photon flux. Therefore, experiments were performed at different light intensities (Figure1e,f). Since increasing the photon flux can be achieved by increasing the electrical energy investment, these results are also crucial in optimizing the operation cost of heterogeneous photocatalysis.
Using LED365nm, high values ofΦappCOU andΦapp7-HCwere obtained at relatively low photon fluxes; the apparent quantum efficiency significantly decreases with the photon flux increase (Table1), while r0values change according to a saturation curve. Doubling the electrical power (6.55→13.60 W) and the photon flux in this way, the r0values increased by only 20–30%, and the further increases (13.60→20.77 W) did not change that significantly for both photocatalysts. For LED398nmthe r0values increased, and there was no significant change of the apparent quantum yield within the photon flux range applied in the case of TiO2. A similar trend was observed for ZnO for both LEDs (Table1) than for TiO2and LED365nm; theΦappvalue (especially theΦapp7-HC) decreased with the intensity increase.
Nanomaterials2022,12, 5 7 of 21
Table 1. The apparent quantum yields (Φapp) of the transformation of COU and the formation of 7-HC (c0COU= 5.0×10⁻⁴M and 1.0 g dm−3ZnO or TiO2).
LED Pel(W) TiO2 ZnO
r0COU
(×10−7)
ΦappCOU
(×10−2)
r07-HC
(×10−9)
Φapp7-HC
(×10−4) r07-HC/r0COU r0COU
(×10−7)
ΦappCOU
(×10−2)
r07-HC
(×10−9)
Φapp7-HC
(×10−4) r07-HC/r0COU
LED365nm
3.39 1.49 1.01 3.4 2.3 0.023 3.50 2.47 3.22 2.3 0.009
6.56 3.03 1.22 6.40 2.4 0.021 4.68 1.70 4.75 1.7 0.010
13.60 3.83 0.68 8.25 1.5 0.022 6.21 1.13 5.57 1.0 0.009
20.77 4.02 0.47 8.30 1.0 0.021 6.20 0.75 6.25 0.8 0.011
LED398nm
0.96 0.22 0.18 1.02 0.85 0.044 0.31 0.26 2.00 1.7 0.039
2.16 0.47 0.19 1.97 0.82 0.045 0.50 0.21 2.93 1.3 0.059
4.68 0.95 0.20 4.15 0.89 0.047 0.83 0.18 3.25 0.7 0.064
Φapp: the transformation (r0COU) or formation rate (r07HC) divided by the incoming photon flux.
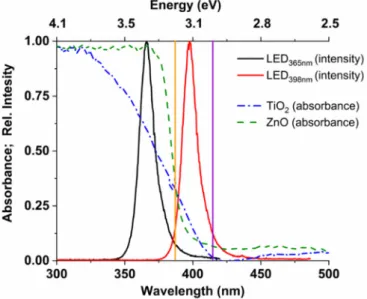
At a given wavelength, the absorption properties and the bandgap of the photocatalyst determine the excitation efficiency primarily. In addition to these factors, the recombination rate of the photogenerated charge carriers also determines the transformation efficiency of organic substances and the radical generation rate. Based on the spectrum of the light sources and the absorbance of the catalysts (Figure2), it can be stated that the photons of the LED365nm(radiating between 355–380 nm) can be wholly absorbed by ZnO, while about 80% of photons are absorbed by TiO2due to its less favorable optical properties. According to the bandgaps (3.0 eV for rutile, 3.2 eV for anatase and ZnO), both photocatalysts can be excited using this light source. Nevertheless, ZnO and TiO2can absorb no more than ~20%
of the emitted photons when LED398nm(radiating between 385–420 nm) is used (Figure2).
The difference between absorbance of the photocatalysts at 365 and 398 nm is well reflected by theΦappCOUvalues for LED365nmand LED398nm(Table1).
Nanomaterials 2022, 12, x FOR PEER REVIEW 7 of 21
Table 1. The apparent quantum yields (Φapp) of the transformation of COU and the formation of 7- HC (c0COU = 5.0×10⁻⁴ M and 1.0 g dm−3 ZnO or TiO2).
LED Pel (W)
TiO2 ZnO
r0COU (×10−7)
ΦappCOU (×10−2)
r07-HC (×10−9)
Φapp7-HC
(×10−4) r07-HC/r0COU r0COU (×10−7)
ΦappCOU (×10−2)
r07-HC (×10−9)
Φapp7-HC
(×10−4) r07-HC/r0COU
LED365nm
3.39 1.49 1.01 3.4 2.3 0.023 3.50 2.47 3.22 2.3 0.009
6.56 3.03 1.22 6.40 2.4 0.021 4.68 1.70 4.75 1.7 0.010
13.60 3.83 0.68 8.25 1.5 0.022 6.21 1.13 5.57 1.0 0.009
20.77 4.02 0.47 8.30 1.0 0.021 6.20 0.75 6.25 0.8 0.011
LED398nm
0.96 0.22 0.18 1.02 0.85 0.044 0.31 0.26 2.00 1.7 0.039
2.16 0.47 0.19 1.97 0.82 0.045 0.50 0.21 2.93 1.3 0.059
4.68 0.95 0.20 4.15 0.89 0.047 0.83 0.18 3.25 0.7 0.064
Φapp: the transformation (r0COU) or formation rate (r07HC) divided by the incoming photon flux.
At a given wavelength, the absorption properties and the bandgap of the photocata- lyst determine the excitation efficiency primarily. In addition to these factors, the recom- bination rate of the photogenerated charge carriers also determines the transformation efficiency of organic substances and the radical generation rate. Based on the spectrum of the light sources and the absorbance of the catalysts (Figure 2), it can be stated that the photons of the LED365nm (radiating between 355–380 nm) can be wholly absorbed by ZnO, while about 80% of photons are absorbed by TiO2 due to its less favorable optical proper- ties. According to the bandgaps (3.0 eV for rutile, 3.2 eV for anatase and ZnO), both pho- tocatalysts can be excited using this light source. Nevertheless, ZnO and TiO2 can absorb no more than ~20% of the emitted photons when LED398nm (radiating between 385–420 nm) is used (Figure 2). The difference between absorbance of the photocatalysts at 365 and 398 nm is well reflected by the ΦappCOU values for LED365nm and LED398nm (Table 1).
Figure 2. The emission spectra of the LEDs (black and red line), and the absorption spectra of the TiO2 and ZnO photocatalysts (blue and green interrupted line). The bandgap of the ZnO and TiO2 anatase (3.2 eV) with a vertical orange line, and the bandgap of TiO2 rutile (3.0 eV) with a vertical purple line).
Another critical difference is that, for TiO2, the photons emitted by the LED398nm can primarily excite the rutile phase (Figure 2). Tang et al. [76] reported a quantum efficiency dependence on the photon flux according to a maximum curve, which correlates well with our results for LED365nm (Table 1). Probably, above a given value, which value depends on electron mobility, the further increase of the photon flux enhances the recombination of Figure 2.The emission spectra of the LEDs (black and red line), and the absorption spectra of the TiO2and ZnO photocatalysts (blue and green interrupted line). The bandgap of the ZnO and TiO2 anatase (3.2 eV) with a vertical orange line, and the bandgap of TiO2rutile (3.0 eV) with a vertical purple line).
Another critical difference is that, for TiO2, the photons emitted by the LED398nmcan primarily excite the rutile phase (Figure2). Tang et al. [76] reported a quantum efficiency dependence on the photon flux according to a maximum curve, which correlates well with our results for LED365nm(Table1). Probably, above a given value, which value depends on electron mobility, the further increase of the photon flux enhances the recombination of the photogenerated charges, while several factors limit the redox reactions on the surface.
However, Sachs et al. [77] reported that the rutile shows faster but less intensity-dependent recombination of photogenerated charges than anatase, which can be the reason for similar
Nanomaterials2022,12, 5 8 of 21
Φappvalues measured at different intensities of 398 nm light, as mainly the rutile phase is excited in this case.
The effect of irradiation wavelength is moderated when r07-HCandΦapp7-HCvalues are compared (Table1). It indicates that despite the lower transformation rates of COU due to the less efficient absorption of 398 nm than 365 nm photons (Figure2), the relative contribution of•OH to the transformation of COU is probably greater at 398 nm irradiation.
The yield of 7-HC (r07-HC/r0COU) is 0.02 for TiO2, 0.01 for ZnO when LED365nmis used, and significantly higher values, 0.045 for TiO2and 0.06 for ZnO, are obtained when LED398nmis applied (Table1). Presumably, due to the lower efficiency of the excitation of photocatalysts and consequently the number of photogenerated charges, the probability of eCB−–hVB+
recombination also decreases, and the quantum yield of•OH formation increases. For further experiments, 6.56 W for the LED365nm, and 4.68 W for the LED398nmwere used, where the apparent quantum yields and transformation rates were relatively high.
3.3. The Effect of Matrices and Matrix Components on the•OH Formation
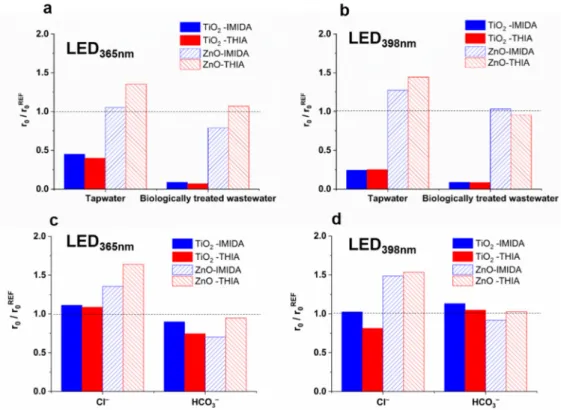
The components of the treated water have a crucial role during heterogeneous photo- catalysis, and their effect can be complex. The ionic components can change the surface properties of the photocatalyst (surface charge and potential), and in this way, they affect the interaction between the surface of the photocatalyst and the target compounds and the formation rate of ROS [36,37,78–80]. The generally negative effect of matrices is usually at- tributed to the scavenging of•OH, the occupation of adsorption sites by the well-adsorbed inorganic and organic matrix components, or the aggregation of photocatalyst particles at higher ionic strength. Two real water matrices, tap water and biologically treated domestic wastewater (Table S2), were used in this work to study the matrix effect on the transforma- tion rate of COU and•OH formation rate and characteristic differences between TiO2and ZnO were observed. In the case of TiO2,both matrices reduced the r0COUand the r07-HC
significantly and to a similar extent (Figure3a,b). For ZnO, the transformation of COU was only slightly inhibited, while the r07-HCincreased, especially in the case of LED365nm (Figure3a,b).
Due to the significant difference observed between TiO2 and ZnO, first, the effect of 5.0 × 10⁻³ M methanol (MeOH) as a non-absorbed •OH-scavenger (kMeOH+•OH = 9.7×10⁸mol−1dm3s−1[81]) was investigated. MeOH has a similar effect using both catalysts and LEDs (Figure S4). The inhibition effect on COU transformation and 7-HC formation (decrease by 45–55%) is similar and reflects well the calculated•OH scavenging capacity of MeOH (about 40% of the•OH reacts with MeOH at the given initial con- centrations). All this suggests that the difference observed for TiO2and ZnO cannot be attributed solely to the•OH scavenging effect of the organic matter content of the matri- ces (0.79 mg dm−3and 6.9 mg dm−3TOC content for tap water and biologically treated domestic wastewater, respectively) (Table S2).
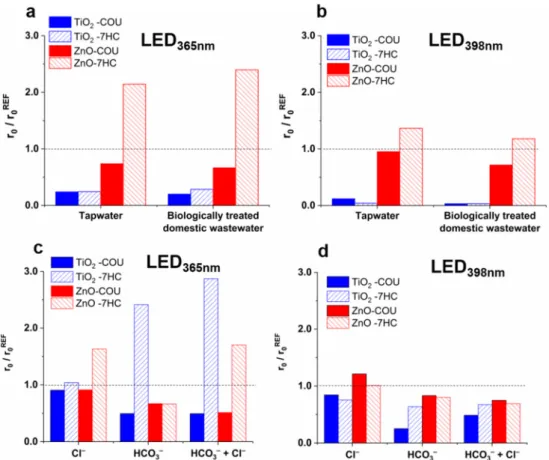
The effect of the two most abundant anions of matrices, Cl−and HCO3−, was inves- tigated in suspensions containing one or both anions. Their concentrations were set to the same value as the biologically treated domestic wastewater (120 mg dm−3Cl−and 525 mg dm−3HCO3−(Table S2)). In the case of LED365nm, Cl−did not affect the r0COU
and the r07-HCfor TiO2, but increased the r07-HCfor ZnO by 63% with unchanged r0COU
(Figure3c). Cl− is reported to react with•OH with a high reaction rate (k•OH + Cl− = 3.0×10⁹M−1s−1[81]); consequently, an inhibition is expected. The backward reaction reforming•OH can occur at the pH values used in the current work (6.0 for TiO2and 7.5 for ZnO) [36]. However, this does not explain the difference observed between the two catalysts. The adsorption of ions, the change of surface charge, and reaction with photogen- erated charges also must be considered. The very slow conversion [82] and its negligible hVB+ scavenging effect of Cl− in TiO2suspensions were reported [38]. Opposite to the TiO2, the Cl−are adsorbed well on the ZnO surface, having a positive charge [83–85] and enhancing the formation rate of ROS due to the hindered recombination of photoinduced eCB−and hVB+[83]. Significant conversion of Cl−by hVB+to HClO has been reported in
Nanomaterials2022,12, 5 9 of 21
some cases [82,86,87]. The degradation of HClO via reaction with eCB−, or superoxide radical anions (O2•−) also results in the formation of•OH [87,88], which may explain the increased r07-HCfor ZnO. Active chlorine species formation and photocatalytic reactions are complex, depending on many parameters [88–90], and require further investigation.
Moreover, the positive effect of Cl− was observed only in the case of 365 nm radiation.
This suggests that the excess energy of the photons or the concentration of photogenerated charges can have a role in the manifestation of the Cl−effect in the case of ZnO.
Nanomaterials 2022, 12, x FOR PEER REVIEW 9 of 21
on the ZnO surface, having a positive charge [83–85] and enhancing the formation rate of ROS due to the hindered recombination of photoinduced eCB− and hVB+ [83]. Significant conversion of Cl− by hVB+ to HClO has been reported in some cases [82,86,87]. The degra- dation of HClO via reaction with eCB−, or superoxide radical anions (O2•−) also results in the formation of •OH [87,88], which may explain the increased r07-HC for ZnO. Active chlo- rine species formation and photocatalytic reactions are complex, depending on many pa- rameters [88–90], and require further investigation. Moreover, the positive effect of Cl− was observed only in the case of 365 nm radiation. This suggests that the excess energy of the photons or the concentration of photogenerated charges can have a role in the mani- festation of the Cl− effect in the case of ZnO.
Figure 3. Effect of matrices (a,b), Cl− (120 mg dm−3), and HCO3− (525 mg dm−3) (c,d) on the relative transformation rate of COU and formation rate of 7-HC.
The HCO3− reduced the r0COU and r07-HC by the same extent (by about 30%) when ZnO and LED365nm were used. For TiO2, the r0COU was reduced by 50%, but r07-HC was more than doubled (Figure 3c). Due to the relatively low reactivity of HCO3− with •OH (k•OH+HCO3− = 1.0 × 10⁷ M−1 s−1 [81]), the inhibition of COU transformation cannot be attributed solely to its •OH scavenging role (~5% of •OH reacts with HCO3−); its reaction with hVB+ is also es- sential. The reaction between HCO3− and hVB+ results in CO3•− formation only in the case of TiO2, not in the case of ZnO [38,40]. The formed CO3•− is a selective and less reactive reaction partner than •OH, but its reaction with aromatic compounds results mainly in hydroxylated products [91–93], similar to •OH. Thus, the formation of CO3•− instead of
•OH can be responsible for the r0COU decrease and probably for the r07-HC increase. These results also indicate that r07-HC is unsuitable for determining the •OH formation rate when CO3•− forms in the system. Comparing the effect of HCO3− in the 365 and 398 nm irradiated TiO2 suspensions, the inhibition of the COU transformation is more pronounced in the case of 398 nm radiation, likely because of the less efficient excitation; consequently, there Figure 3.Effect of matrices (a,b), Cl−(120 mg dm−3), and HCO3−(525 mg dm−3) (c,d) on the relative transformation rate of COU and formation rate of 7-HC.
The HCO3−reduced the r0COUand r07-HCby the same extent (by about 30%) when ZnO and LED365nmwere used. For TiO2, the r0COUwas reduced by 50%, but r07-HCwas more than doubled (Figure3c). Due to the relatively low reactivity of HCO3−with•OH (k•OH + HCO3− = 1.0 ×10⁷ M−1s−1 [81]), the inhibition of COU transformation cannot be attributed solely to its•OH scavenging role (~5% of•OH reacts with HCO3−); its reaction with hVB+ is also essential. The reaction between HCO3− and hVB+ results in CO3•− formation only in the case of TiO2, not in the case of ZnO [38,40]. The formed CO3•− is a selective and less reactive reaction partner than •OH, but its reaction with aromatic compounds results mainly in hydroxylated products [91–93], similar to•OH.
Thus, the formation of CO3•−instead of•OH can be responsible for the r0COUdecrease and probably for the r07-HCincrease. These results also indicate that r07-HCis unsuitable for determining the•OH formation rate when CO3•− forms in the system. Comparing the effect of HCO3−in the 365 and 398 nm irradiated TiO2suspensions, the inhibition of the COU transformation is more pronounced in the case of 398 nm radiation, likely because of the less efficient excitation; consequently, there is a lower concentration of both photogenerated charges and•OH. The difference between the two light sources is exciting, as additives have a characteristic effect on the formation of 7-HC in the case of LED365nm.
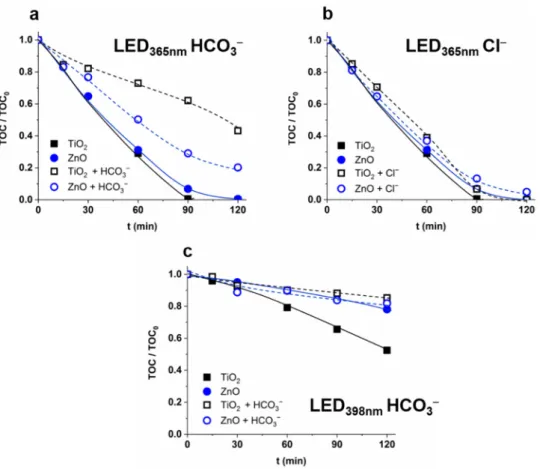
The change of the mineralization rate confirmed the enhanced formation rate of less reactive CO3•− instead of•OH. In the case of 365 nm radiation, the mineralization rate
Nanomaterials2022,12, 5 10 of 21
was the same for TiO2and ZnO, and significantly reduced by HCO3−to a much greater extent for TiO2than for ZnO (Figure4a). The reaction between HCO3−and hVB+, and the formation of CO3•−, is likely to play a significant role only in the case of TiO2. In the case of ZnO, the HCO3−primarily acts as an•OH scavenger, while in the case of TiO2it also reacts with•OH and the hVB+. The formed CO3•−is less efficient for mineralization than
•OH. Thus, mineralization is inhibited by HCO3−to a greater extent for TiO2than for ZnO.
The Cl−enhanced the r07-HCfor ZnO but had no significant effect on the r0COU(Figure3c) and mineralization (Figure4b). One possible interpretation is that the radical scavenging effect of Cl−and its positive effect on charge separation and/or regeneration of•OH from Cl-containing species compensate for each other.
A significant difference was observed between mineralization rates for ZnO, and TiO2determined in the suspensions irradiated with 398 nm light, although there was no difference in the case of 365 nm irradiation. However, 398 nm light excites only the rutile phase, and the TiO2is much more effective in mineralization than ZnO having slightly better optical properties at a longer wavelength range. Moreover, the inhibition effect of HCO3−is manifested only for TiO2(Figure4c).
Nanomaterials 2022, 12, x FOR PEER REVIEW 10 of 21
is a lower concentration of both photogenerated charges and OH. The difference between the two light sources is exciting, as additives have a characteristic effect on the formation of 7-HC in the case of LED365nm.
The change of the mineralization rate confirmed the enhanced formation rate of less reactive CO3•− instead of •OH. In the case of 365 nm radiation, the mineralization rate was the same for TiO2 and ZnO, and significantly reduced by HCO3− to a much greater extent for TiO2 than for ZnO (Figure 4a). The reaction between HCO3− and hVB+, and the formation of CO3•−, is likely to play a significant role only in the case of TiO2. In the case of ZnO, the HCO3− primarily acts as an •OH scavenger, while in the case of TiO2 it also reacts with
•OH and the hVB+. The formed CO3•− is less efficient for mineralization than •OH. Thus, mineralization is inhibited by HCO3− to a greater extent for TiO2 than for ZnO. The Cl− enhanced the r07-HC for ZnO but had no significant effect on the r0COU (Figure 3c) and min- eralization (Figure 4b). One possible interpretation is that the radical scavenging effect of Cl− and its positive effect on charge separation and/or regeneration of •OH from Cl-con- taining species compensate for each other.
A significant difference was observed between mineralization rates for ZnO, and TiO2 determined in the suspensions irradiated with 398 nm light, although there was no difference in the case of 365 nm irradiation. However, 398 nm light excites only the rutile phase, and the TiO2 is much more effective in mineralization than ZnO having slightly better optical properties at a longer wavelength range. Moreover, the inhibition effect of HCO3− is manifested only for TiO2 (Figure 4c).
Figure 4. The effect of HCO3− (525 mg dm−3) (a,c) and Cl− (120 mg dm−3) (b) on the mineralization of COU (c0 = 5.0 × 10⁻⁴ M; TOC0 = 55 mg dm−3).
In suspensions containing both Cl− and HCO3−, the synergistic effect of the anions was not observed. In the case of 365 nm radiation, the negative effect of HCO3− on r0COU was dominant. At the same time, for ZnO, the Cl− effect while for TiO2 the HCO3− effect was dominant on the r07-HC (Figure 3c). The extent of the effect depended on the
Figure 4.The effect of HCO3−(525 mg dm−3) (a,c) and Cl−(120 mg dm−3) (b) on the mineralization of COU (c0= 5.0×10⁻⁴M; TOC0= 55 mg dm−3).
In suspensions containing both Cl−and HCO3−, the synergistic effect of the anions was not observed. In the case of 365 nm radiation, the negative effect of HCO3−on r0COU
was dominant. At the same time, for ZnO, the Cl− effect while for TiO2 the HCO3−
effect was dominant on the r07-HC(Figure3c). The extent of the effect depended on the wavelength; in the case of LED398nm, only a slight reduction of reaction rates was observed (Figure 3d). Comparing the effect of anions and their mixtures to the tap water and biologically treated domestic wastewater (Figure3a,b), the reduction of photocatalytic activity in these matrices cannot be solely responsible for the presence of inorganic anions, especially for TiO2. For ZnO, the inhibition effect matrices are similar to that of the Cl− and HCO3−mixture; the r0COUslightly decreased, in the case of both LEDs, while r07-HC
Nanomaterials2022,12, 5 11 of 21
increased, especially for 365 nm radiation. However, for TiO2,the transformation is much more inhibited and cannot be explained by the effect of Cl−and HCO3−and the relatively low organic content of the matrices.
3.4. Removal Efficiency of Neonicotinoids
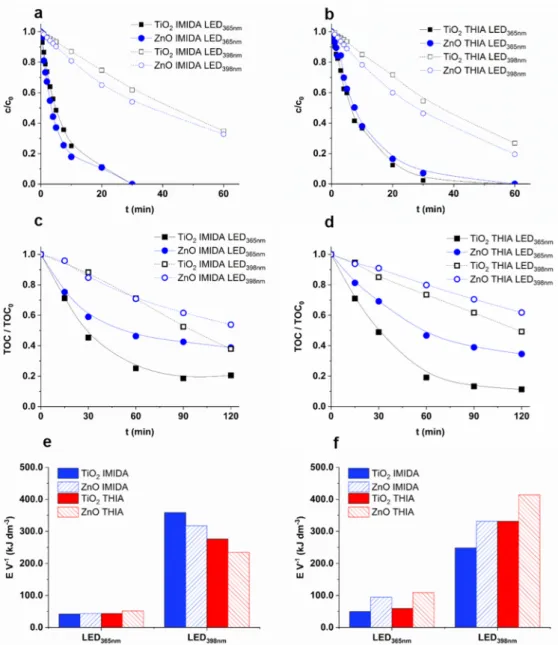
The photocatalytic removal of two neonicotinoid pesticides, IMIDA and THIA, with severe environmental impact was also investigated. As expected, the LED365nmwas much more effective; nearly complete removal (>90%) was achieved within 30 min for both pesticides while using LED398nmthis time increased to 90–120 min (Figure5a,b). A slightly higher transformation rate was observed for ZnO than TiO2using LED398nm(Figure5a,b).
The apparent quantum efficiency of LED398nm(5.3–7.9×10⁻⁴) was only 10–20% of the values determined for LED365nm(4.8–8.5×10⁻³), with a good agreement of the number of absorbed photons, estimated from the absorption of the catalysts and the emission spectra of the LEDs (Figure1).
Nanomaterials 2022, 12, x FOR PEER REVIEW 12 of 21
Figure 5. The relative concentration (a: IMIDA; b: THIA), and the relative TOC content (TOC0 = 12 mg dm−3) (c: IMIDA; d: THIA) as a function of irradiation time, and the electric energy required to remove 90% of the neonicotinoid (e) and 50% of initial TOC content (f).
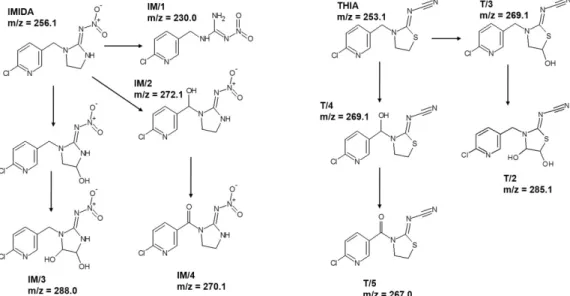
For IMIDA, four degradation products were identified (Figure 6); IM/1 (m/z = 230.0) resulted by the opening of imidazolidine ring [95], while the attack of the •OH to the im- idazolidine and –CH2– moiety led to the formation of IM/2 (m/z = 272.1), IM/4 (m/z = 270.1), and IM/3 (m/z = 288.0). The products distribution differed for TiO2 and ZnO; IM/1 and IM/2 formed significantly faster using ZnO (Figure S5), confirming a different relative contribution of •OH based reactions and direct charge transfer to IMIDA transformation for TiO2 and ZnO. For THIA, the hydroxylation of the thiazolidine ring and –CH2– moiety led to the formation of T3 (m/z = 269.1) and T/4 (m/z = 269.1) (Figure 6). Their further transformation resulted in carbonylated T/2 (m/z = 267.0) and hydroxylated T/5 (m/z = 285.1) products. In the case of THIA, the product distribution was similar for both photo- catalysts (Figure S6).
Figure 5. The relative concentration (a: IMIDA; b: THIA), and the relative TOC content (TOC0 = 12 mg dm−3) (c: IMIDA; d: THIA) as a function of irradiation time, and the electric energy required to remove 90% of the neonicotinoid (e) and 50% of initial TOC content (f).
Nanomaterials2022,12, 5 12 of 21
The main goal of AOPs is generally the complete removal of harmful organic com- pounds and their degradation products. While in the case of COU, there was no difference between the efficiency of the two catalysts using LED365nm, faster mineralization of both neonicotinoids was observed for TiO2than for ZnO (Figure5c,d). Using LED365nm, 10–20%
of TOC could not be removed even after 120 min, which indicates the formation of degra- dation products resistant to photocatalytic treatment. These products most likely formed in more significant amounts in the case of ZnO, when more than 40% of TOC remained in the suspension after 60 min and decreased very slowly during further treatment. The observed difference can be interpreted by the higher•OH formation rate for TiO2and probably by the higher contribution of the direct charge transfer to the transformation of neonicotinoids and their intermediates for ZnO. In addition, opposite to the neonicotinoids, TOC decreased linearly during the whole treatment of COU (Figures4and5c,d).
Since one of the main arguments in favor of LEDs is their better consumption of electric power, the energy required to treat a unit volume of IMIDA and THIA suspension was compared. In the case of LED398nm(4.68 W), the energy needed to reduce the concentration by 90% [94] was 5–6 times higher for THIA, and 7–9 times higher for IMIDA than in the case of LED365nm(6.56 W) (Figure5e). Comparing the electrical energy required to eliminate the 50% of TOC content, the difference between the two LEDs was moderate; for ZnO about four times higher, and TiO2about five times higher energy was needed (Figure5f). Despite the higher power usage and slightly lower electrical efficiency (Table1and Table S3), the higher energy of the emitted photons made the LED365nmeconomically more favorable due to the better optical properties of both photocatalysts at 365 nm than at 398 nm.
For IMIDA, four degradation products were identified (Figure6); IM/1 (m/z = 230.0) resulted by the opening of imidazolidine ring [95], while the attack of the•OH to the imida- zolidine and –CH2– moiety led to the formation of IM/2 (m/z = 272.1), IM/4 (m/z = 270.1), and IM/3 (m/z = 288.0). The products distribution differed for TiO2and ZnO; IM/1 and IM/2 formed significantly faster using ZnO (Figure S5), confirming a different relative contribution of•OH based reactions and direct charge transfer to IMIDA transformation for TiO2and ZnO. For THIA, the hydroxylation of the thiazolidine ring and –CH2– moiety led to the formation of T3 (m/z = 269.1) and T/4 (m/z = 269.1) (Figure6). Their further trans- formation resulted in carbonylated T/2 (m/z = 267.0) and hydroxylated T/5 (m/z = 285.1) products. In the case of THIA, the product distribution was similar for both photocatalysts (Figure S6).
Nanomaterials 2022, 12, x FOR PEER REVIEW 13 of 21
Figure 6. The products of IMIDA and THIA detected by HPLC-MS.
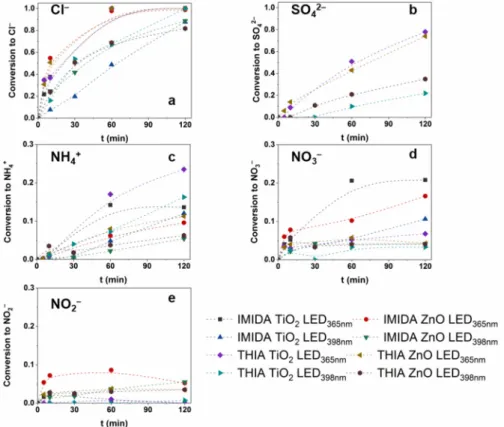
The mineralization results in inorganic ions depend on the chemical structure of the pollutants [96]. The dechlorination was complete with both photocatalysts after 60 min using LED365nm and reached 90% using LED398nm after 120 min (Figure 7a). The S-content was converted to SO42−, and its accumulation was much slower than that of Cl−, as it re- quired the ring-opening process of the thiazolidine ring. Less than 50% of S-content was converted to SO42− after 60 min and reached 74% at 120 min treatment using LED365nm. This value only reached 20–30% using LED398nm (Figure 7b), following the slower TOC removal.
The fate of organic N-content depends on the oxidation state of the N atom in the molecule, on its chemical environment, and the reaction parameters [96,97]. N-containing moiety can transform into NO3−, NH4+ and N2 as final products. Toxic NO2− may also form but is usually oxidized to NO3− by •OH (k•OH + NO2− = 6.0 × 10⁻⁹ M−1 s−1 [98]), while oxidizing NH4+ to NO3− is very slow. The conversion of N-content of THIA to NH4+ (24%) exceeded that determined for IMIDA (14%), and TiO2 resulted in significantly higher concentrations of NH4+ compared to ZnO (Figure 7c). IMIDA produces significantly higher NO3− concen- trations than THIA, as the –NO2 group is likely to be easily converted to NO3− (Figure 7d).
The NO2− concentration is negligible for TiO2, but 5–8% and 3–4% of the total N-content can be detected as NO2− during the transformation of IMIDA and THIA, respectively, when ZnO was used (Figure 7e). Park et al. reported the reduction of NO3− on ZnO, which does not occur on TiO2 [99]. This can explain the presence of NO2− but also points out that it can be a disadvantage in removing N-containing organic impurities with ZnO. The NO2− is hazardous to the environment and human health, even in low concentrations (1–3 mg dm−3).
Figure 6.The products of IMIDA and THIA detected by HPLC-MS.
The mineralization results in inorganic ions depend on the chemical structure of the pollutants [96]. The dechlorination was complete with both photocatalysts after 60 min