Journal Pre-proof
Investigation of the efficiency of BiOI/BiOCl composite photocatalysts using UV, cool and warm white LED light sources - photon efficiency, toxicity, reusability, matrix effect, and energy consumption
Máté Náfrádi, Klara Hernadi, Zoltán Kónya, Tünde Alapi
PII: S0045-6535(21)01107-3
DOI: https://doi.org/10.1016/j.chemosphere.2021.130636 Reference: CHEM 130636
To appear in: ECSN
Received Date: 31 January 2021 Revised Date: 10 April 2021 Accepted Date: 19 April 2021
Please cite this article as: Náfrádi, M., Hernadi, K., Kónya, Z., Alapi, T., Investigation of the efficiency of BiOI/BiOCl composite photocatalysts using UV, cool and warm white LED light sources - photon efficiency, toxicity, reusability, matrix effect, and energy consumption, Chemosphere, https://
doi.org/10.1016/j.chemosphere.2021.130636.
This is a PDF file of an article that has undergone enhancements after acceptance, such as the addition of a cover page and metadata, and formatting for readability, but it is not yet the definitive version of record. This version will undergo additional copyediting, typesetting and review before it is published in its final form, but we are providing this version to give early visibility of the article. Please note that, during the production process, errors may be discovered which could affect the content, and all legal disclaimers that apply to the journal pertain.
© 2021 Published by Elsevier Ltd.
Author contributions:
Tünde Alapi: Conceptualization, Writing- Reviewing and Editing Máté Náfrádi: Experimental work, Data evaluation, Writing Klára Hernádi: Conceptualization
Zoltán Kónya: Providing XRD, DRS and XPS measurements
Journal Pre-proof
1
Investigation of the efficiency of BiOI/BiOCl composite photocatalysts using UV, cool 1
and warm white LED light sources - photon efficiency, toxicity, reusability, matrix 2
effect, and energy consumption 3
4
Máté Náfrádi1, Klara Hernadi2,3, Zoltán Kónya2, Tünde Alapi1* 5
6
1 Department of Inorganic and Analytical Chemistry, University of Szeged, H-6720 Szeged, 7
Dóm tér 7. Hungary 8
2 Department of Applied and Environmental Chemistry, University of Szeged, H-6720 9
Szeged, Rerrich Béla tér 1. Hungary 10
3Institute of Physical Metallurgy, Metal Forming and Nanotechnology, University of Miskolc, 11
HU-3515 Miskolc-Egyetemváros, Hungary 12
*Email: alapi@chem.u-szeged.hu 13
*Corresponding author 14
15
ABSTRACT 16
BiOI, BiOCl, and their composites (BiOI:BiOCl) with molar ratios from 95:5 to 5:95 were 17
synthesized and tested in the transformation of methyl orange (MO) and 18
sulfamethoxypyridazine (SMP) antibiotic, using three various LED light sources: UV LEDs 19
(398 nm), cool and warm white LEDs (400 - 700 nm). The 80:20 BiOI:BiOCl photocatalyst 20
showed the best adsorption capacity for MO and enhanced activity compared to BiOI and 21
BiOCl. The apparent quantum yield (app) of the MO and SMP transformation for cool and 22
warm white light was slightly lower than for 398 nm UV radiation. The effect of methanol 23
and 1,4-benzoquinone proved that the transformation is initiated mainly via direct charge 24
transfer, resulting in the demethylation of MO and SO2 extrusion from SMP. The change of 25
photocatalytic efficiency was followed during three cycles. After the first one, the 26
transformation rates decreased, but there was no significant difference between the second 27
and third cycles. The decreased efficiency is most probably caused by the intermediates, 28
whose continuous accumulation was observed during the cycles. Ecotoxicity measurements 29
Journal Pre-proof
2
confirmed that no toxic substances were leached from the catalyst, but the transformation of 30
both MO and SMP results in toxic intermediates. Using 80:20 BiOI:BiOCl and LED light 31
source, the energy requirement of the removal is about half of the value determined using 32
TiO2 and a mercury vapor lamp. The effect of some components of wastewater (Cl−, HCO3− 33
and humic acids), pH, and two matrices on the composite photocatalysts' efficiency and 34
stability were also investigated.
35
KEYWORDS 36
BiOX, photocatalysis, visible light, quantum yield 37
HIGHLIGHTS 38
BiOI:BiOCl composites were synthesized and tested for photocatalytic applications 39
the efficiency of three different LED light sources was compared for excitation 40
adsorption capacity and transformation efficiency for MO are highly correlated 41
400-700 nm and 398 nm light are similarly efficient for BiOI:BiOCl excitation 42
wastewater matrices and their components affect the adsorption and efficiency 43
Graphical Abstract 44
45
BiOI / BiOCl LED light sources
390 nm700 nm
Methyl orange
quantum effciency
energy requirement
reusability
ecotoxicity
matrix effect
role of reactive species
products
ΦUV≈ ΦVis
E=1.8 eV 3.2 eV eCB-
hVB+
N N
N CH3
CH3 S
O
O O H
S NH
N N O
O N
H2
O CH3
Sulfamethoxypyridazine
Journal Pre-proof
3 1. INTRODUCTION
46
47
One of the current water treatment challenges is developing cost-effective post- 48
treatment methods to remove hazardous, non-biodegradable contaminants having biological 49
activity. Advanced Oxidation Processes (AOPs), as additive water treatment methods, offer a 50
solution to this problem (Khan et al., 2019; Stefan, 2017). One of the widely investigated 51
processes is heterogeneous photocatalysis, which is based on semiconductors' application.
52
The widely used photocatalysts, TiO2 and ZnO having wide band gaps; therefore, they are 53
mainly active in the UV region (Konstantinou and Albanis, 2003), and the transformation of 54
the organic substances is generally initiated by hydroxyl radical. Due to the absorption of a 55
photon having appropriate energy, an electron (ecb−) in the excited conduction band and a hole 56
(hvb+
) in the valence band form and initiates the transformation of organic substances (Qian et 57
al., 2019). The transformation can take place via direct charge transfer (Ahmed and Haider, 58
2018), photosensitization (Akpan and Hameed, 2009), or reaction with reactive oxygen 59
species (ROS) (Konstantinou and Albanis, 2003). Their relative contribution to the 60
transformation of target pollutants depends on the photocatalyst's chemical and surface 61
properties, the substrate's properties, and the reaction parameters.
62
One of the main goals from a material science perspective is the synthesis of catalysts, 63
which efficiently work under visible light radiation, as sunlight is our cheapest and 64
inexhaustible energy source. Bismuth oxyhalides (BiOX: X=F, Cl, Br, I), as photoactive 65
materials, have received widespread attention during the last decade. BiOF and BiOCl are 66
active in the UV range (band gap: 3.6 eV for BiOF and 3.2 eV for BiOCl), while BiOBr, and 67
especially BiOI are active in the visible range (band gap: 2.6 eV for BiOBr and 1.8 eV for 68
BiOI) (Singh et al., 2018; Bárdos et al., 2020). Their advantages include excellent adsorption 69
capacity, they are easy to synthesize, but the fast recombination of photoinduced charges 70
Journal Pre-proof
4
decreases their efficiency (Cheng et al., 2014; Yao et al., 2020). Several attempts have been 71
made to enhance the efficiency of BiOX photocatalysts, including the preparation of the 72
composite catalysts. Composite materials, such as BiOCl/BiOBr (Jia et al., 2015; Zhang et al., 73
2020), BiOCl/BiOI, (Dong et al., 2012; Jiang et al., 2015; Shan et al., 2018; Siao et al., 2018;
74
Wu et al., 2020; Xiao et al., 2012; Yang et al., 2016; Zhang et al., 2020; Zhong et al., 2018), 75
SiO2/BiOX (Shen et al., 2015) and TiO2/BiOX (Dai et al., 2011; Liu et al., 2019), with 76
improved stability and enhanced visible-light activity, were successfully synthesized. The 77
activity improvement of the composite catalysts is explained by the synergetic effects of ion 78
doping and heterostructure (Wang et al., 2020), the reduced recombination of electron-hole 79
pairs (Shan et al., 2018), and highly enhanced adsorption capacity (Yang et al., 2016; Zhang 80
et al., 2016, 2020). Methods such as the size-controlled synthesis of BiOX photocatalysts and 81
the use of environmentally friendly, green synthesis methods were also investigated (Bárdos 82
et al., 2019; Garg et al., 2018a, 2018b). Several studies are available about the structure, 83
properties, and activity of BiOX photocatalysts. However, the effects of various reaction 84
parameters that determine practical applicability, such as inorganic and organic wastewater 85
components, and pH, have been rarely studied.
86
Due to the intensive development of optoelectronics in recent years, the use of light- 87
emitting diodes (LEDs) radiating in the UV and visible light range has become increasingly 88
popular. It makes possible improved efficiency of additive water treatment methods based on 89
photochemical processes (Chen et al., 2017; Sergejevs et al., 2017). Compared to the 90
conventional UV and visible light sources, LEDs have higher electric efficiency, lower price, 91
better mechanical tolerance, and longer lifetimes; therefore, they are a promising option for 92
application in water treatment processes, which requires either visible or UV radiation (Jo and 93
Tayade, 2014).
94
Journal Pre-proof
5
The present study aims to prepare composites BiOCl/BiOI photocatalyst with different 95
molar ratios, to determine their absorption properties and photocatalytic activity, and to 96
compare the apparent quantum yields using different LED light sources (398 nm UV, cool 97
and warm white light). For evaluation of the photocatalytic performance of the pure BiOI, 98
BiOCl, and the composites, the methyl orange (MO) dye and sulfamethoxypyridazine (SMP) 99
antibiotic degradation was chosen. Toxicity measurements have also been performed to 100
investigate the potential risk of using these photocatalysts. Also, studies of the effects of Cl−, 101
HCO3−
, humic acid, pH and two matrices (river water and biologically treated domestic 102
wastewater) provide information on the practical applicability of the best composite 103
photocatalyst.
104
105
2. MATERIALS AND ANALYTICAL METHODS 106
107
2.1. Materials 108
For the synthesis of photocatalysts, bismuth nitrate pentahydrate (Bi(NO3)3 × 5 H2O, 109
Alfa Aesar, 98%), potassium iodide and chloride (KI and KCl, Molar Chemicals, 99.7%), 110
ethylene glycol (Sigma-Aldrich, 99.95%) and ethanol (VWR, 96%) were used without further 111
purification. When the effect of additives was studied, NaCl (VWR, 99%), sodium-humate 112
(Sigma Aldrich, tech. grade), methanol (VWR, 99.9 %), and 1,4-benzoquinone (Acros 113
Organics, 99%) were used. The pH of the solutions was adjusted with H2SO4 (Fluka, 49-51%) 114
or NaOH (VWR, 98%) and measured with InoLab p730 pH meter. Methyl orange (MO) from 115
VWR, (99%), sulfamethoxypyridazine (SMP) from Sigma Aldrich (99%) were purchased.
116
NaF was from Alfa Aesar (99%). O2 or N2 gas (Messer Hungarogáz, 99.5% and 99.995%) 117
was used to keep constant dissolved O2 concentration. For the actinometric measurements 118
Fe2(SO4)3 (VWR, 98%), potassium oxalate (Reanal, 98%), ammonium-reineckate (Sigma 119
Journal Pre-proof
6
Aldrich, 93%), 1,10-phenanthroline (Sigma Aldrich, 99%), KOH (Fluka, 98%) and KSCN 120
(VWR, 98%) was used.
121
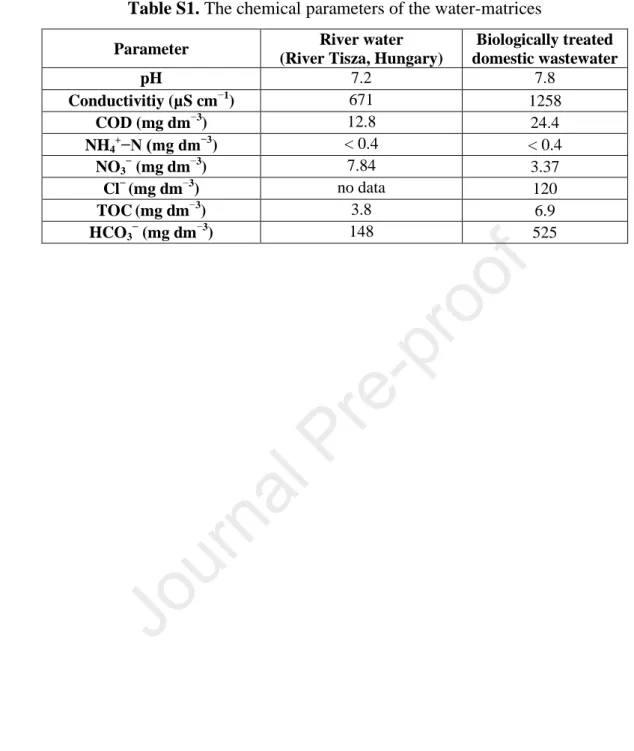
Table S1 shows the date of matrices: river water (from Tisza, Szeged, Hungary) and the 122
biologically treated domestic wastewater (from the water treatment plant, Szeged).
123
124
2.2 Preparation of BiOI/BiOCl composite catalysts 125
The BiOI and BiOCl photocatalysts were prepared as described in the literature (Bárdos 126
et al., 2019). Bi(NO3)3×5 H2O, KCl, and KI were used for preparation via a solvothermal 127
method. The Bi(NO3)3×5 H2O and KCl, or KI was dissolved in 50 cm3 ethylene glycol with 128
continuous stirring and heating (up to 45 °C). The suspension was heat-treated for 3 hours at 129
120 °C in a PTFE-coated steel autoclave. The solid material was washed with distilled water 130
and ethanol, then vacuum-filtered with a 0.1 μm pore size filter (Durapore®, hydrophilic 131
PVDF) and dried for 24 hours at 40 °C. The composite catalysts were prepared with the same 132
method, with the addition of KCl and KI at the appropriate molar ratios. The molar ratios 133
have been calculated to result in composites with 5.0 to 95.0 n/n% BiOI content. The color of 134
the prepared materials changed from white to red, with increasing BiOI content (Fig. 2/a).
135
136
2.3 Photocatalytic test reactions 137
In each case, 100 cm3 suspension was irradiated in a cylindrical glass reactor (inner 138
diameter: 45 mm). For determination of the amount of adsorbed MO and SMP, the 139
suspensions were stirred in the dark for 30 min before photocatalytic tests. The experiments 140
were started by turning on the light source. O2 or N2 gas was continuously bubbled through 141
the suspension to keep constants the dissolved O2 concentration.
142
Fig. S2 shows the emission spectra of the LED light sources. Three different LED light 143
sources were used; commercial ‘UV’ (LEDmaster, λemission= 398±10 nm, 288 lumens, 4.6 W), 144
Journal Pre-proof
7
‘cool white’ (LEDmaster, λemission=400-650 nm, 390 lumens, 4.6 W), and ‘warm white’
145
(LEDmaster, λemission=400-700 nm, 600 lumens, 4.6 W). 1.0 m of LED tape (60 LED/meter) 146
was fixed on the inside of the aluminum, double-walled reactor having 66 mm inner diameter.
147
The reactors were equipped with a water cooling system to ensure the LEDs' constant light 148
output. The electrical power required to operate the LEDs was the same (4.6 W) in all cases;
149
thus, the efficiency of the photocatalysts was determined at the same electrical energy input.
150
A widely used and commercially available photocatalyst, TiO2 Aeroxide P25® (Acros 151
Organics, 35-65 m2 g–1 specific surface area) was used as a reference measurement. The 152
irradiation of TiO2 was performed using a fluorescent mercury vapor lamp (Lighttech;
153
GCL303T5/UVA; 307 mm × 20.5 mm; 15 W) emitting in the 300-400 nm range (λmax = 365 154
nm). The suspension was irradiated in a 500 cm3 cylindrical glass reactor.
155
156
2.4 Analytical methods 157
The emission spectra of the LED light sources (Fig. S2) were recorded using a two- 158
channel fiber-optic CCD spectrometer (AvaSpec-FT2048) in the 180-880 nm wavelength 159
range. The photon flux of the light sources was determined using two chemical actinometry 160
methods: Reinecke’s salt (Wegner and Adamson, 1966) and the widely applied ferrioxalate 161
(Hatchard and Parker, 1956) actinometry. Reinecke’s salt actinometry can be involved mainly 162
in the range of visible light; the quantum yield of the photolysis of Reinecke’s salt changes 163
from 0.311 to 0.270 in the 400 - 600 nm region (Kuhn et al., 2004). The 0.01 M solutions of 164
potassium-reineckate were prepared (Cornet et al., 1997). The photon flux was calculated 165
from the formation rate of SCN- determined via spectrophotometry with excess Fe(NO3)3. The 166
molar absorption coefficient of FeSCN (3188 mol–1 dm3 cm–1)was determined from the slope 167
of its calibration curve.
168
Journal Pre-proof
8
The ferrioxalate actinometry can be used in the UV and near-UV region (254 - 500 nm).
169
This method is based on the photoreduction of K3Fe(C2O4)3, and the quantification of the Fe2+
170
ions is performed by complexation with 1,10-phenanthroline. Within the range of 365 – 514 171
nm, the quantum yield of the Fe2+ formation changes from 1.2 to 0.93 (Kuhn et al., 2004).
172
The photocatalysts adsorb well the MO dye. NaF solution (0.5 cm3, 0.5 M) was added 173
to the samples (1.0 cm3) for effective desorption of MO and its intermediates. After adding 174
the NaF solution, the sample was kept for 10 minutes in the dark and finally centrifuged 175
(Dragonlab, 15000 RPM), and filtered with syringe filters (0.22 µm, FilterBiO, PVDF-L). The 176
recovery was checked with 2.0×10⁻⁴ M concentration of MO in 0.50 g dm-3 BiOCl and BiOI 177
containing suspensions and was found to be 98(±1) % in both cases.
178
For spectrophotometric measurements, an Agilent 8453 UV-Vis spectrophotometer was 179
used. The molar absorbance of MO (at 464 nm) and SMP (at 261 nm) is 25905 and 18990 180
mol–1 dm3 cm–1, respectively. KI solution was used to determine the concentration of 181
dissolved I–. The absorbance was measured at 226 nm, the molar absorbance of I– at this 182
wavelength was 13080 mol−1 dm3 cm−1. 183
HPLC measurements were performed with an Agilent 1100 HPLC equipped with a 184
diode array UV detector (DAD) to separate the intermediates and determine MO and SMP 185
concentration in the treated suspension. For MO containing samples, the stationary phase was 186
a Kinetex 2.6u XB-C18 100A (Phenomenex) reverse phase column, while the mobile phase 187
consisted of 40 v/v% acetonitrile (VWR, UPLC-grade) and 60 v/v% formic acid solution 188
(0.1%). For SMP containing samples the same stationary phase was used, the mobile phase 189
consisted of 12.5 v/v% acetonitrile and 87.5 v/v% formic acid. The flow rate of eluent was 190
0.70 ml min−1, and the temperature was 25 °C. The products were determined via mass 191
spectrometry (Agilent LC/MSD/VL with ESI source). Measurement was performed in 192
Journal Pre-proof
9
positive mode (3500 V capillary voltage, 75 V fragmentor voltage), the scan range was 100- 193
500 AMU.
194
Ecotoxicity test (LCK480, Hach-Lange) based on the bioluminescence measurements of 195
Vibrio fischeri bacteria were used to determine the acute ecotoxicity of the samples. The 196
inhibition of bioluminescence was measured using a Lumistox 300 (Hach Lange) 197
luminometer after 30 min. incubation time. For elimination of the formed H2O2, the catalase 198
enzyme (2000-5000 unit mg–1, Sigma Aldrich) was added to the samples in 2.0 mg dm–3 199
concentration.
200
The synthesized catalysts were characterized using powder X-ray diffractometry (XRD) 201
(Rigaku Miniflex II, Cu Kα radiation source, 5.0-90.0 2Theta° range, with 4.0 2Theta° min–1 202
resolution). The specific surface area was determined via N2 adsorption/desorption isotherms 203
using a Quantachrome NOVA 2200 analyser. The pore size distribution was calculated by the 204
BJH method. Diffuse reflectance spectroscopy (DRS) was performed using an Ocean Optics 205
DH-2000 light source and Ocean Optics USB4000 detector. The band gap energy values were 206
evaluated by the Kubelka-Munk approach and the Tauc plot (Tauc, 1968) and reinforced by 207
the first derivative approach method (Flak et al., 2013). X-ray photoelectron spectroscopy 208
(Kratos XSAM-800 apparatus, non-monochromatic Mg Kα X-ray source) was adopted to 209
investigate the surface elemental composition.
210
211
3. RESULTS AND DISCUSSION 212
213
3.1 Characterization of the photocatalysts 214
The XRD patterns of the synthesized pure BiOX (X = Cl, I) and their composites were 215
compared (Fig. 1). The diffraction peaks can be indexed to the tetragonal BiOI and BiOCl 216
phase (Bárdos et al., 2019). In the case of 50:50 molar ratios, peaks of both components could 217
be detected. The BiOI/BiOCl composites containing 20:80 and 80:20 BiOCl:BiOI molar 218
Journal Pre-proof
10
ratios exhibit the characteristic peaks of pure BiOI or BiOCl (the main component).
219
Comparing the profiles of BiOI with BiOI:BiOCl composite having 80:20 molar ratio, it can 220
be seen that the diffraction peaks slightly shift to the higher angles, corresponding to a smaller 221
spacing distance between the different planes. The same phenomenon is less pronounced for 222
BiOI:BiOCl composite having a 20:80 molar ratio. Moreover, the diffraction peaks of 223
composite are broader than the corresponding peaks of pure BiOX, indicating the smaller 224
crystallite sizes during heterogeneous growth (Ahern et al., 2015).
225
226
Fig. 1 UV-Vis DRS spectra, N2 adsorption and desorption isotherms and the corresponding 227
pore-size distribution (inset) and XRD patterns of BiOCl, BiOI, and their composites 228
229
Specific surface are of the photocatalysts, total pore volume and average pore diameter 230
are presented in Table. 1. The hysteresis loop of the isotherm in the range of 0.6–1.0 P/P0, 231
(Fig. 1) suggests the formation of capillary condensation related to pores between closely- 232
300 400 500 600 700 800
0 20 40 60 80 100
Reflectance(%)
Wavelenght (nm) BiOI
BiOCl 80:20 BiOI:BiOCl
Journal Pre-proof
11
packed particles. The surface area of BiOI is much larger than the surface area of BiOCl and 233
is similar to that of a composite catalyst with 80% BiOI content (Table 1.).
234
235
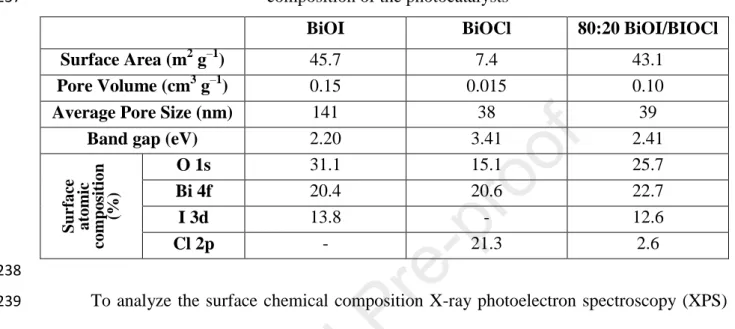
Table 1 The specific surface areas, pore structures, band gap values and surface atomic 236
composition of the photocatalysts 237
BiOI BiOCl 80:20 BiOI/BIOCl
Surface Area (m2 g–1) 45.7 7.4 43.1
Pore Volume (cm3 g–1) 0.15 0.015 0.10
Average Pore Size (nm) 141 38 39
Band gap (eV) 2.20 3.41 2.41
Surface atomic composition (%)
O 1s 31.1 15.1 25.7
Bi 4f 20.4 20.6 22.7
I 3d 13.8 - 12.6
Cl 2p - 21.3 2.6
238
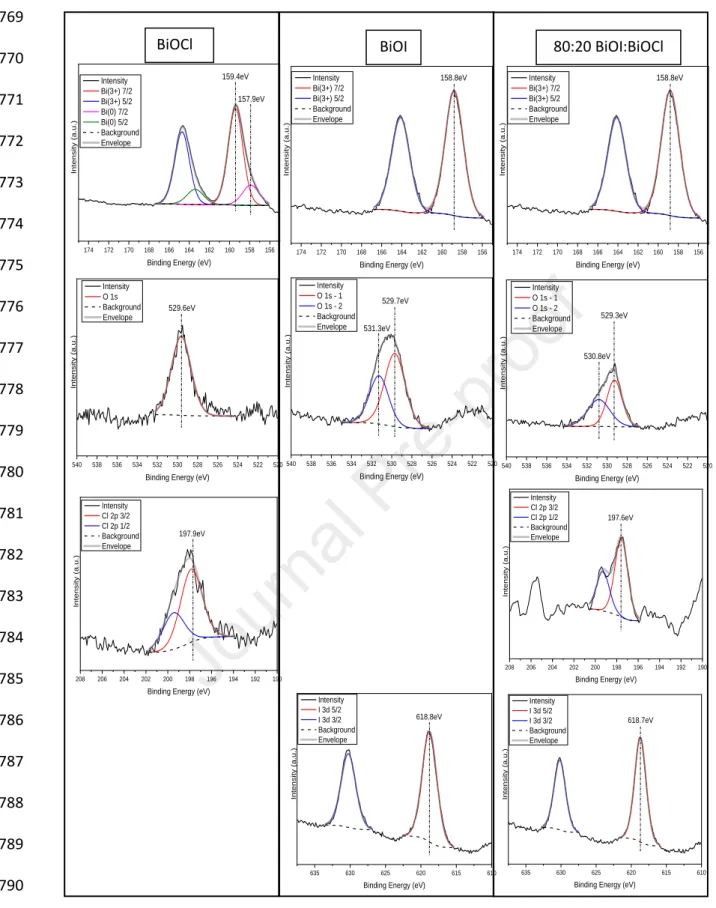
To analyze the surface chemical composition X-ray photoelectron spectroscopy (XPS) 239
were conducted. The overall surface chemical compositions including atomic concentrations 240
of the major elements are listed in Table 1. The atomic ratio of I:Cl on the surface of the 241
composite catalyst is 9.7:2; higher than 8:2, which was applied for the catalyst preparation, 242
and indicates a high concentration of I– on the surface. For BiOCl, the relative low atomic 243
content of O 1s is due to the lack of surface hydroxyl group (Fig S1) (Di et al., 2016; Hao et 244
al., 2017; Liu and Wang, 2016).
245
Fig 1 display the UV-Vis diffuse reflectance spectra of the BiOI, BiOCl and the 80:20 246
BiOI:BiOCl composite having best photocatalytic performance. While considering the optical 247
properties of the investigated semiconductors the band gap energy for BiOCl was 3.41 eV, 248
which is near to that reported in the literature (Ganose et al., 2016). Also, an interesting 249
spectral feature was observed for this sample; its light absorption extends in the visible region.
250
Although, this is unusual, it is not surprising as it can be related to the UV light induced 251
formation of oxygen vacancies. This can be the reason of that, under UV radiation (even at 252
Journal Pre-proof
12
398 nm), the white color of BiOCl changes to gray, and then, after switching off the light, it 253
returns to white in air. In the case of BiOI 2.20 eV was the band gap value, which is slightly 254
different from what expected (~2.00 eV,(Ganose et al., 2016)). This means that Bi5O7I could 255
be present in the sample, a material which is often a co-product of BiOI synthesis (Liu and 256
Wang, 2016). For 80:20 BiOI/BiOCl composite, 2.41 eV, 0.2 eV higher band gap value was 257
determined than that of BiOI sample, which points out the influence of BiOCl.
258
259
3.2 Characterization of the light sources 260
The light source usually determines the efficiency of each photochemical method. The 261
emission spectra of the LED light sources are presented in Fig S2. The UV LED's photon flux 262
emitting at 398±10 nm light was determined and compared by Reinecke’salt actinometry and 263
ferrioxalate actinometry. Both methods can be applied for the determination of the photon 264
flux of this light source. The values determined by Reinecke’salt actinometry was 265
5.81(±0.03)×10–6 molphoton s–1, and a slightly lower value, (5.12±0.02)×10–6 molphoton s–1 was 266
obtained by ferrioxalate actinometry (Hatchard and Parker, 1956).
267
The photon flux was 3.47(±0.25)×10–6 molphoton s-1 for cool white LEDs, and 268
3.25(±0.25)×10–6 molphoton s–1 for the warm white LEDs. Both values were obtained by 269
Reinecke’s salt actinometry and were about 40 % of the UV LED's photon flux. Ferrioxalate 270
actinometry provided much lower values since this method is suitable for determining the 271
photon flux with a wavelength of shorter than 500 nm. In this way, the photon flux for cool 272
white LEDs was 9.35(±0.65)×10–7 molphoton s–1, about 20 % of the UV-LED’s photon flux.
273
This value was slightly lower (7.76(±0.73)×10–7 molphoton s–1)for the warm white LEDs. For 274
calculation of the apparent quantum yield of the transformation, the photon flux determined 275
by Reinecke’salt actinometry was applied.
276
277
Journal Pre-proof
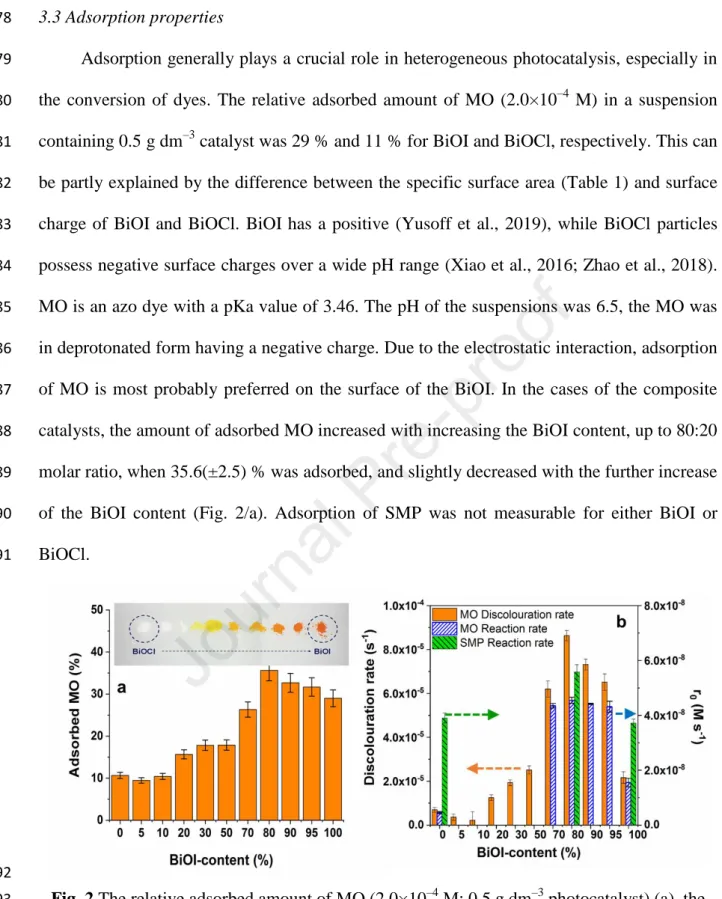
13 3.3 Adsorption properties
278
Adsorption generally plays a crucial role in heterogeneous photocatalysis, especially in 279
the conversion of dyes. The relative adsorbed amount of MO (2.0×10⁻⁴ M) in a suspension 280
containing 0.5 g dm–3 catalyst was 29 % and 11 % for BiOI and BiOCl, respectively. This can 281
be partly explained by the difference between the specific surface area (Table 1) and surface 282
charge of BiOI and BiOCl. BiOI has a positive (Yusoff et al., 2019), while BiOCl particles 283
possess negative surface charges over a wide pH range (Xiao et al., 2016; Zhao et al., 2018).
284
MO is an azo dye with a pKa value of 3.46. The pH of the suspensions was 6.5, the MO was 285
in deprotonated form having a negative charge. Due to the electrostatic interaction, adsorption 286
of MO is most probably preferred on the surface of the BiOI. In the cases of the composite 287
catalysts, the amount of adsorbed MO increased with increasing the BiOI content, up to 80:20 288
molar ratio, when 35.6(±2.5) % was adsorbed, and slightly decreased with the further increase 289
of the BiOI content (Fig. 2/a). Adsorption of SMP was not measurable for either BiOI or 290
BiOCl.
291
292
Fig. 2 The relative adsorbed amount of MO (2.0×10⁻⁴ M; 0.5 g dm–3 photocatalyst) (a), the 293
rate of discoloration (based on the absorbance determined at 464 nm), and the initial reaction 294
rate (r0) of MO and SMP determined by HPLC-DAD (b) using photocatalysts having various 295
BiOI content 296
297
Journal Pre-proof
14 3.4 The photocatalytic test reactions using UV LEDs 298
The relative contribution of the direct UV photolysis (398 nm irradiation) to the 299
transformation of MO and SMP was negligible. The effect of suspension concentration on the 300
transformation rate was investigated using 80:20 BiOI:BiOCl composite photocatalyst.
301
Within the range of 0.5 - 1.5 g dm–3, amount of adsorbed MO and its transformation rate 302
increased linearly (Fig. S3). Similar trend was observed for SMP. In further experiments, 0.5 303
g dm–3 photocatalyst load was used to ensure adequate depth of light penetration into the 304
suspension.
305
The interaction between the MO and the catalyst's surface requires the differentiation 306
between the adsorbed and transformed amount of dye. Before determining MO concentration 307
of the treated solution, NaF was added to the sample for desorption. In this way, the total 308
amount of non-transformed MO can be measured. The initial transformation rate determined 309
without NaF addition (2.40 × 10⁻⁸ M s–1) is only 41 % of the value determined after the 310
addition of NaF (4.10 × 10⁻⁷ M s–1) to the samples (Fig. S4). Above ~40% conversion, there is 311
no significant effect of NaF addition, which can be explained by the competitive adsorption 312
between MO and its products. The transformation is likely to result in products that 313
successfully compete with MO for adsorption sites. The pH of the suspension does not change 314
significantly (from 6.5 to 6.2) during the transformation.
315
For MO, significantly increased activity was determined for the composite catalysts 316
having more than 50% BiOCl content. The discoloration rate reached the maximum value in 317
the range of 70-95% BiOCl content (Fig. 2b). Adsorption capacity and transformation 318
efficiency are correlated (Fig. 2).
319
In the spectrophotometric measurements, the characteristic change of the shape of the 320
MO spectrum and the shift of its maximum to the lower wavelengths indicates the formation 321
of products having significant absorption around 400-450 nm (Fig. S6). Therefore, the HPLC- 322
Journal Pre-proof
15
DAD method was used to determine the initial transformation rate of MO for the most 323
promising composite catalysts (70, 80, 90, and 95% BiOI content), the pure BiOI, and BiOCl 324
(Fig 2b). For SMP, the HPLC-DAD method was used to determine the concentration in each 325
case because of the formation of aromatic intermediates. The initial transformation rate of 326
MO correlated with the discoloration rate: it was about three times higher for composite 327
catalysts than for BiOI.
328
The photocatalytic activity of pure BiOCl, BiOI, and the 80:20 BiOI:BiOCl composite 329
catalysts having the best adsorption properties were tested and compared using the UV LEDs 330
(398 nm) light source. The initial transformation rate of MO was significantly higher for BiOI 331
with a larger surface area and smaller bandgap value than for BiOCl. (Table 1). Surprisingly, 332
the non-adsorbed SMP transformation takes place with similar rate in the case of both pristine 333
photocatalysts. For BiOI, the transformation rate was doubled, while for BiOCl, a five time 334
higher transformation rate was determined for SMP than for MO. The reason can be the UV 335
light induced formation of oxygen vacancies in BiOCl and consequently extending the 336
excitability to larger (above 363 nm) wavelength ranges. The composite catalyst showed 337
increased activity to transform both components compared to the pure BiOI and BiOCl.
338
339
3.5 Comparison of the efficiency using UV, cool, and warm white LEDs 340
The activity of the catalysts were determined under visible light radiation, using cool 341
white and warm white light and compared to the activity determined under 398 nm UV 342
irradiation (Fig. 3). For both organic substances, the transformation rate was significantly 343
higher using 398 nm irradiation than visible light, similarly, the product formation was 344
markedly faster (Fig S5). Both BiOI and the composite catalyst proved better activity than 345
BiOCl under visible light irradiation. There was no difference between the initial 346
transformation rates determined in the case of cool white and warm white light. The excellent 347
Journal Pre-proof
16
behaviour of the composite was also manifested under excitation with visible light. Opposite 348
to the BiOI:BiOCl composite catalyst, an induction period can be observed (up to 30 min.) 349
when pure BiOI was used for MO degradation. During this period the transformation rate 350
increased with the increased average energy of the photons (UV < Cool white < Warm white) 351
(Fig S5).
352
Since there is a significant difference between the photon flux of each light source and 353
the energy of the emitted photons, it is worth comparing the efficiency based on the apparent 354
quantum yields (Φapp = number of photons reached the treated suspension/number of molecule 355
transformed) of the transformation. The photon flux of visible light LEDs (3.47(±0.25)×10–6 356
molphoton s–1 for the cool and 3.25(±0.25)×10–6 molphoton s–1 for the warm white LEDs) is about 357
40% of the photon flux of UV LEDs (5.81(±0.03)×10–6 molphoton s–1). Also, photons' average 358
energy is lower, as these LEDs emit light primarily in the 400-700 nm range. The flux of 359
photons with a wavelength shorter than 500 nm for cool (9.35(±0.65)×10–7 molphoton s–1)) and 360
warm white LEDs (7.76(±0.73)×10–7 molphoton s–1 ) is less than 20 % of the photon flux of 361
UV-LEDs (5.81±0.03)×10–6 molphoton s–1).
362
363
Journal Pre-proof
17
Fig. 3 The initial transformation rate (r0) and apparent quantum yield (Φapp) of the MO and 364
SMP transformation 365
366
In the case of MO using 398 nm light, the value of Φapp was much higher for BiOI than 367
for BiOCl, while for SMP there was no significant difference between them. In the case of 368
MO transformation, the Φapp measured for the composite was nearly double than the Φapp of 369
BiOI, regardless of the light source (Fig 3), and the Φapp for cool and warm white light was 370
just slightly lower than, for 398 nm UV irradiation. This suggests that BiOI and BiOI:BiOCl 371
composite can utilize visible and near-UV light with similar efficiency for the well-absorbed 372
MO transformation. For SMP, both pristine catalysts showed better activity than for MO. The 373
Φapp for 398 nm was higher than for visible light excitation for pristine catalysts, even for 374
BiOCl. Similarly to MO, a significantly increased Φapp values were determined in the case of 375
the composite catalyst and the difference between the values obtained for visible and UV light 376
excitation practically disappeared.
377
The transformation rate and the Φapp value increases with the catalyst concentration (Fig 378
S3) because the higher surface area increases the number of photogenerated charges. The 379
excellent adsorption properties of the photocatalyst can also contribute to this. Thus, using 1.5 380
g dm-3 BiOI:BiOCl composite suspension, the Φapp determined in 398 nm irradiated 381
suspensions are about three times higher than in the case of 0.5 g dm-3 suspensions.
382
383
3.7 The role of reactive species 384
For BiOX photocatalysts, the mechanism of transformation is not yet clear; the OH•- 385
based reaction (Garg et al., 2018a), direct charge transfer (Dai et al., 2007; Garg et al., 2018a) 386
and/or reaction with O2•– (Yang et al., 2020), as well as photosensitization (Li et al., 2011) 387
were also reported.
388
Journal Pre-proof
18
Fónagy et al. (2021) evidently demonstrated that 1,4-BQ can be used as ecb scavenger in 389
O2-free suspension, and the amount of the formed 1,4-H2Q is proportional to the amount of 390
the photogenerated ecb–
. Thus, we studied the reduction of 1,4-BQ into 1,4-H2Q in O2-free and 391
the backward reaction in O2-saturated suspensions under 398 nm radiation (Fig 4). The 392
transformation of 1,4-H2Q to 1,4-BQ relates to the reaction with hvb+
, while the reaction 393
between 1,4-H2Q and O2•– is responsible mainly for ring-opening processes and 394
mineralization (Fónagy et al., 2021).
395
396
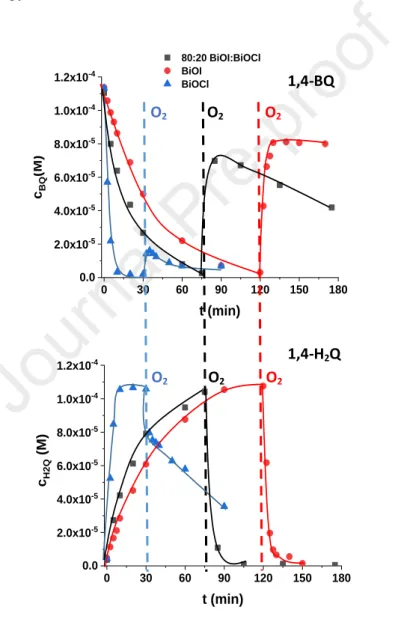
Fig. 4 The concentration of 1,4-BQ and 1,4-H2Q in O2-free (before interrupted line) and in O2 397
saturated (after interrupted line) suspensions under 398 nm irradiation 398
(interrupted lines show when N2 bubbling was changed to O2 bubbling) 399
1,4-BQ
1,4-H2Q
0 30 60 90 120 150 180
0.0 2.0x10⁻⁵ 4.0x10⁻⁵ 6.0x10⁻⁵ 8.0x10⁻⁵ 1.0x10⁻⁴ 1.2x10⁻⁴
80:20 BiOI:BiOCl BiOI
BiOCl
cBQ(M)
t (min)
0 30 60 90 120 150 180
0.0 2.0x10⁻⁵ 4.0x10⁻⁵ 6.0x10⁻⁵ 8.0x10⁻⁵ 1.0x10⁻⁴ 1.2x10⁻⁴
cH2Q (M)
t (min)
O2 O2 O2
O2 O2 O2
Journal Pre-proof
19 400
The transformation of 1,4-BQ was faster using the composite compared to BiOI, due to 401
the heterojunction between BiOI and BiOCl, which could prevent the charge carrier 402
recombination more efficiently and improve the photocatalytic performance by this way. The 403
1,4-BQ completely transformed into 1,4-H2Q in O2-free suspensions. Replacing N2 to O2, 404
80% (BiOI) and 70% (composite) of H2Q oxidized back into 1,4-BQ extremely quick, (Fig.
405
4). The behaviour of BiOCl was quite different: only a small fraction of H2Q could be 406
transformed back to BQ in O2-containing suspension, and its transformation takes place, 407
which is most probably caused by the reaction with O2•– and results in ring-opening products.
408
The transformation of H2Q in O2 saturated suspension is negligible for BiOI, but happens for 409
composite (Fig. 4). The UV light induced formation of oxygen vacancies in BiOCl can be the 410
reason of the high activity of BiOCl under 398 nm irradiation, opposite that, the excitation of 411
pure BiOCl (band gap: 3.41 eV, Table 1.) requires radiation with wavelength shorter than 363 412
nm. The white color of BiOCl to grey changes under 398 nm radiation, which was not 413
observed under visible light radiation.
414
In agreement with the published results of Fónagy et al. (2020) and Xie et al. (2018) we 415
can conclude that, in O2 containing suspension of BiOCl, the excitation with 398 nm results in 416
O2•–
formation, which can contribute to the transformation of organic substances. For pure 417
BiOI, there is no O2•– formation, and the direct charge transfer is responsible for the 418
transformation of organic substances. The improved photocatalytic performance of the 419
composite is due to the combination of the heterojunction between BiOI and BiOCl, and the 420
possibility of O2•– formation.
421
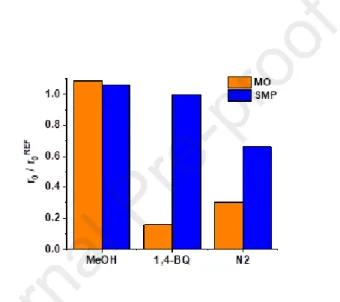
In O2-containing suspensions, methanol (1.0×10⁻² M) as OH• scavenger does not affect 422
the transformation rate of MO and SMP, even in the case of BiOCl proving that this reactive 423
species has no role in the transformation. Addition of 1,4-BQ (1.0×10⁻² M) reduced the 424
transformation rate of MO by 84 %, but no effect was observed in the case of SMP. In MO 425
Journal Pre-proof
20
containing suspension the 1,4-BQ transformation was much slower than in SMP containing 426
suspension. The lack of dissolved O2 also decreased the conversion, but to a different extent:
427
by 70% for well-adsorbed MO and by 34% for poorly adsorbed SMP (Fig. 5). The relatively 428
rapid conversion of SMP in an O2-free suspension suggests reaction with both photogenerated 429
charges, so SMP partially could take over the role of O2 as an ecb–
scavenger, which facilitates 430
the reaction with the hvb+. This is supported by the high value of the rate constant between the 431
sulfonamides and the eaq–
(Mezyk et al., 2007), but further studies are needed to clarify this 432
hypothesis.
433
434
Fig. 5 Effect of methanol, 1,4-BQ in air saturated 80:20 BiOI:BiOCl suspensions and the 435
relative transformation rates in O2-free suspensions 436
437
In the case of BiOI and BiOI:BiOCl photocatalyst, the main product of MO is formed 438
by demethylation (Fig. S6), which confirms the important role of the direct charge transfer in 439
MO conversion (Dai et al., 2007). For TiO2 P25, the hydroxylation and demethylation occurs 440
parallel (Dai et al., 2007), and both products are formed at a similar rate (Fig. S6). The 441
hydroxylated product results in a red-shift of the UV-Vis spectra, compared to the blue-shift 442
associated with the product formed via demethylation. For SMP the main product is formed 443
via SO2 extrusion (Khaleel et al., 2013), as LC/MS measurements proved that. The formation 444
of hydroxylated products was not observed for any of the target compounds when BiOI, 445
Journal Pre-proof
21
BiOCl or composite catalysts were used opposite to the application of P25 (Fig S6). This 446
observation is in agreement with the negligible effect of methanol.
447
448
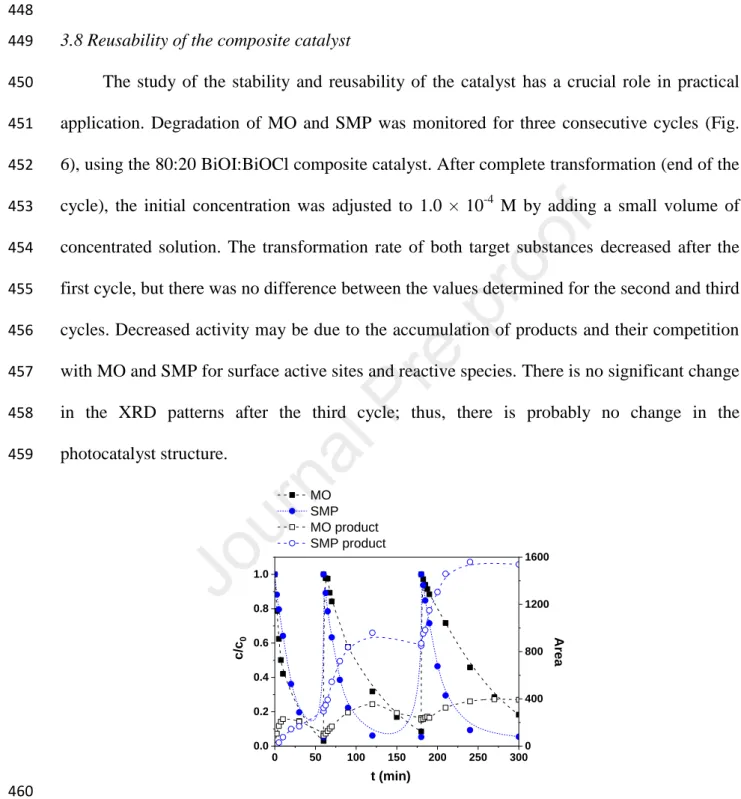
3.8 Reusability of the composite catalyst 449
The study of the stability and reusability of the catalyst has a crucial role in practical 450
application. Degradation of MO and SMP was monitored for three consecutive cycles (Fig.
451
6), using the 80:20 BiOI:BiOCl composite catalyst. After complete transformation (end of the 452
cycle), the initial concentration was adjusted to 1.0 × 10⁻⁴ M by adding a small volume of 453
concentrated solution. The transformation rate of both target substances decreased after the 454
first cycle, but there was no difference between the values determined for the second and third 455
cycles. Decreased activity may be due to the accumulation of products and their competition 456
with MO and SMP for surface active sites and reactive species. There is no significant change 457
in the XRD patterns after the third cycle; thus, there is probably no change in the 458
photocatalyst structure.
459
460
Fig. 6 Transformation of MO and SMP and the formation of their product during three cycles 461
462
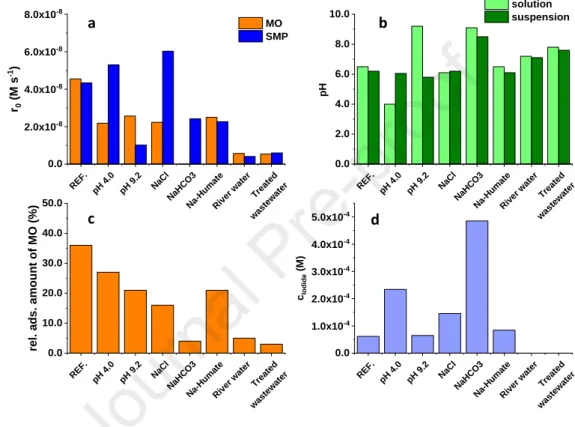
3.9 Effect of pH, matrix components and matrices 463
0 50 100 150 200 250 300
0.0 0.2 0.4 0.6 0.8 1.0
c/c0
MO SMP MO product SMP product
t (min)
0 400 800 1200 1600
Area
Journal Pre-proof
22
The effect of parameters important for practical applicability, thus pH, Cl (120 mg 464
dm–3), HCO3 (525 mg dm–3), Na-humate (20 mg dm–3) and two matrices (biologically treated 465
domestic wastewater and river water) on the efficiency was investigated. The concentration of 466
additives was adjusted to the average concentration of biologically treated wastewater. Table 467
S1 shows the chemical parameters of the matrices.
468
469
Fig 7 The effect of various matrix components and matrices 470
a: initial transformation rates; b: pH before and after addition the 80:20 BiOI:BiOCl 471
photocatalyst; c: I concentration after 30 min stirring in dark (determined by 472
spectrophotometry); d: relative amount of adsorbed MO (in the case of real matrices could not 473
be determined due to matrix absorption) 474
475
The pH of the solution was adjusted to 9.2 and 4.0 with NaOH and H2SO4 solutions, 476
respectively. The addition of BiOI:BiOCl catalyst restored the pH of the suspension to around 477
6.5. The protonation-deprotonation process of MO (pKa = 3.46) could not affect its 478
adsorption. Nevertheless, the relative amount of adsorbed MO (from 36% to 21% and 27%) 479
and the conversion rate (to 45% and 53%) was significantly reduced (Fig 7). The ionic 480
REF. pH 4.0 pH 9.2
NaCl NaHCO3
Na-H uma
te
Riv er w
ater Tre
ated
wastewa ter 0.0
2.0x10⁻⁸ 4.0x10⁻⁸ 6.0x10⁻⁸ 8.0x10⁻⁸
r0 (M s-1)
MO SMP
REF. pH 4.0 pH 9.2
NaCl NaHCO3
Na-H uma
te
Riv er w
ater Tre
ated
wastewa ter 0.0
2.0 4.0 6.0 8.0 10.0
pH
solution suspension
REF. pH 4.0 pH 9.2
NaCl NaHCO3
Na-H uma
te
Riv er w
ater Tre
ated
wa stewa
ter 0.0
10.0 20.0 30.0 40.0 50.0
rel. ads. amount of MO (%)
REF. pH 4.0 pH 9.2
NaCl NaHCO3
Na-H uma
te
Riv er w
ater Tre
ated
wa stewa
ter 0.0
1.0x10⁻⁴ 2.0x10⁻⁴ 3.0x10⁻⁴ 4.0x10⁻⁴ 5.0x10⁻⁴
cIodide (M)
a b
c d
Journal Pre-proof
23
components can change the surface properties and electrostatic attraction between 481
photocatalyst and substrate, thereby affect the photodegradation. NaCl decreased the 482
adsorption of MO (to 16%) and its conversion rate (to 49%), but increased the transformation 483
rate of SMP (by 46%). A significant change was observed when 525 mg dm–3 NaHCO3 was 484
added to the suspension. The transformation rate of MO was completely and of SMP partly 485
(to 58%) inhibited. MO practically did not adsorb in this case. Spectrophotometric 486
measurements show that the concentration of I– in the solution did not change due to the 487
addition of NaOH, but H2SO4 and NaCl, and even NaHCO3 increased that, suggesting a 488
change in the surface of the catalyst (Fig 7). The relative high I– concentration in the 489
suspension proved that HCO3–
dramatically changed the photocatalyst. To accurately explain 490
these results, further studies are needed on the effect of different ions on the surface properties 491
and stability of the BiOI:BiOCl photocatalyst.
492
The humic acids and humates often compete for adsorption sites with the pollutants.
493
As our results show, humate decreased the transformation of MO and SMP to a similar extent.
494
I– leaching was not observed, but the relative adsorbed amount of MO decreased to 21 % (Fig 495
7). Using river water and biologically treated domestic wastewater, the joined effect of 496
various inorganic and organic components practically completely inhibited the elimination of 497
both test substances. Our results suggest that despite their excellent adsorption and 498
photocatalytic properties, our knowledge of the stability of BiOI:BiOCl photocatalyst and the 499
effect of each matrix component and matrices are incomplete and require further 500
investigation.
501
502
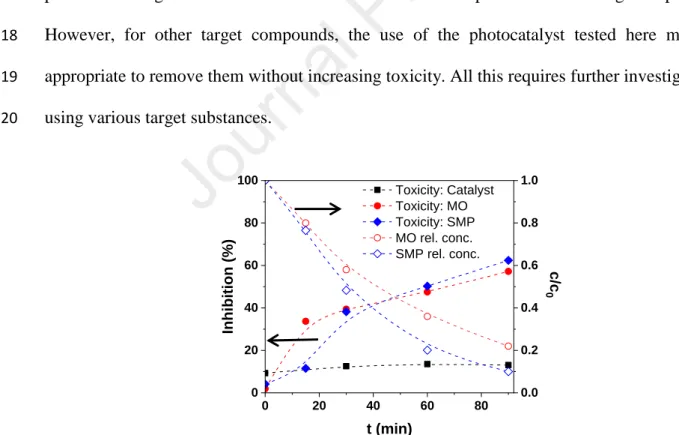
3.10 Toxicity assay 503
Toxicity studies were performed to check the environmentally friendly use of the 504
prepared photocatalyst. The toxicity of the composite photocatalyst and the treated MO and 505