Citation:Náfrádi, M.; Alapi, T.;
Farkas, L.; Bencsik, G.; Kozma, G.;
Hernádi, K. Wavelength Dependence of the Transformation Mechanism of Sulfonamides Using Different LED Light Sources and TiO2and ZnO Photocatalysts.Materials2022,15, 49.
https://doi.org/10.3390/ma15010049
Academic Editors: Alina Pruna, Klára Hernádi, Zsolt Pap and Tünde Alapi
Received: 4 December 2021 Accepted: 21 December 2021 Published: 22 December 2021 Publisher’s Note:MDPI stays neutral with regard to jurisdictional claims in published maps and institutional affil- iations.
Copyright: © 2021 by the authors.
Licensee MDPI, Basel, Switzerland.
This article is an open access article distributed under the terms and conditions of the Creative Commons Attribution (CC BY) license (https://
creativecommons.org/licenses/by/
4.0/).
materials
Article
Wavelength Dependence of the Transformation Mechanism of Sulfonamides Using Different LED Light Sources and TiO 2 and ZnO Photocatalysts
MátéNáfrádi1 , Tünde Alapi1,* , Luca Farkas1, Gábor Bencsik2 , Gábor Kozma3 and Klára Hernádi4
1 Department of Inorganic and Analytical Chemistry, University of Szeged, Dóm tér 7,
H-6720 Szeged, Hungary; nafradim@chem.u-szeged.hu (M.N.); fluca@chem.u-szeged.hu (L.F.)
2 Department of Physical Chemistry and Materials Science, University of Szeged, Rerrich Béla tér 1, H-6720 Szeged, Hungary; bencsikg@chem.u-szeged.hu
3 Department of Applied and Environmental Chemistry, University of Szeged, Rerrich Béla tér 1, H-6720 Szeged, Hungary; kozmag@chem.u-szeged.hu
4 Institute of Physical Metallurgy, Metal Forming and Nanotechnology, University of Miskolc, C/2-5 Building 209, H-3515 Miskolc-Egyetemvaros, Hungary; femhernadi@uni-miskolc.hu
* Correspondence: alapi@chem.u-szeged.hu
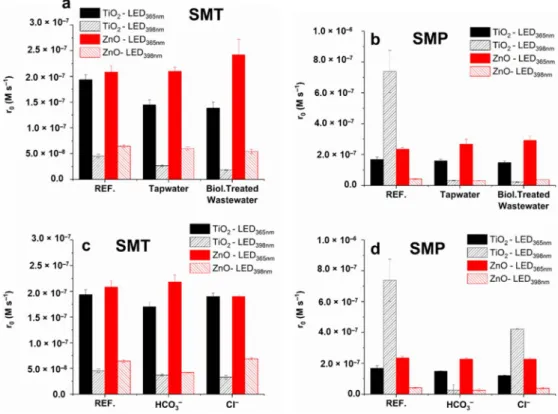
Abstract:The comparison of the efficiency of the commercially available photocatalysts, TiO2and ZnO, irradiated with 365 nm and 398 nm light, is presented for the removal of two antibiotics, sulfamethazine (SMT) and sulfamethoxypyridazine (SMP). The•OH formation rate was compared using coumarin, and higher efficiency was proved for TiO2than ZnO, while for 1,4-benzoquinone in O2-free suspensions, the higher contribution of the photogenerated electrons to the conversion was observed for ZnO than TiO2, especially at 398 nm irradiation. An extremely fast transformation and high quantum yield of SMP in the TiO2/LED398nmprocess were observed. The transformation was fast in both O2containing and O2-free suspensions and takes place via desulfonation, while in other cases, mainly hydroxylated products form. The effect of reaction parameters (methanol, dissolved O2content, HCO3−and Cl−) confirmed that a quite rarely observed energy transfer between the excited state P25 and SMP might be responsible for this unique behavior. In our opinion, these results highlight that “non-conventional” mechanisms could occur even in the case of the well-known TiO2 photocatalyst, and the effect of wavelength is also worth investigating.
Keywords:energy transfer; direct charge transfer; matrix effect; sulfonamides
1. Introduction
The release of antimicrobial agents to the environment causes several environmental, ecological, and public health problems [1,2]. Infection caused by antibiotic-resistant bacteria results in more than 33,000 deaths in Europe. Sulfonamides are among the first synthesized and frequently used antibiotics in human and veterinary medicine and, similar to the other antibiotics, highly contribute to the emergence of antibiotic-resistant bacteria [3].
Existing wastewater treatment plants are not designed to remove micropollutants [4,5];
the raw and treated wastewaters carry significant amount of antibiotic-resistant bacteria.
Thus, the application of cost-effective additive water treatment methods is required to eliminate the antibiotics from treated waters completely. Advanced Oxidation Processes (AOPs) offer a solution to remove trace amounts of recalcitrant organic pollutants from wastewater. Among other AOPs, heterogeneous photocatalysis has been applied to remove several sulfonamides, using different photocatalysts and light sources [6–17].
During heterogeneous photocatalysis, a photon with energy higher than the bandgap is absorbed by a semiconductor, forming a photogenerated conduction band electron (eCB−) and a valence band hole (hVB+), which react with dissolved organic compounds via di- rect charge transfer reactions or generate different reactive oxygen species (ROS) [18,19],
Materials2022,15, 49. https://doi.org/10.3390/ma15010049 https://www.mdpi.com/journal/materials
Materials2022,15, 49 2 of 20
of which hydroxyl radical (•OH) has primary importance. The rare examples of photo- catalytic reactions induced by prevailing energy transfer have been recently reported in literature by considering the excited solid semiconductor as the energy donor. While elec- tron transfer requires direct contact between the semiconductor and the substrate, mediated contact or a certain distance can favor energy transfer [20]. Nosaka et al. explained the formation of singlet oxygen via double electron transfer in the opposite direction [21], while other authors hypothesized energy transfer, even in the case of surface-modified TiO2[22,23]. The enhanced transformation of cyanuric acid [22], the selective oxidization of limonene [24,25], and isomerization of caffeic acid in aqueous TiO2suspensions were interpreted by energy transfer mechanism [26]. In the case of “trivial energy transfer,”
the quenching of the excited semiconductor can occur by the emission of a photon, and the energy transfer to the species takes place by absorption of the emitted photon. Unlike the trivial mechanism, Förster and Dexter energy transfers are radiationless processes, and their manifestation depends strongly on the distance of the acceptor from the semiconductor [20].
The two most often investigated photocatalysts, TiO2and ZnO, have several favorable properties but are mainly active in the UV region. The commercially available TiO2photo- catalyst, P25, contains two crystal phases: the bandgap of rutile is 3.0 eV, while the anatase phase is 3.2 eV, which is approximately equal to the ZnO bandgap [27–29]. The excellent photocatalytic activity of P25 TiO2is often attributed to its mixed crystal phases. Some authors observed individual anatase- and rutile-phase TiO2particles without a heterojunc- tion structure [30,31], while others observed a mixture of amorphous TiO2with anatase or rutile phase and/or anatase particles covered by a thin overlayer of rutile [32–36]. Ohtani et al. proved the absence of synergetic effect, and found that P25 is a simple mixture of anatase and rutile without any interactions [37,38]. On the contrary, under visible light (>400 nm) irradiation, the superior photocatalytic activity of P25 was originated from the anatase–rutile interparticle contact, which is beneficial to the charge carrier separation and consequently the efficiency [33,36,39,40]. A comprehensive understanding of P25 microstructure should be crucial for designing an efficient TiO2-based photocatalyst.
Nowadays, many researchers are involved in synthesizing and characterizing new materials or composite materials based on TiO2 [41–43] or ZnO [29,44–47], which can be used as effective photocatalysts. However, the use of these new visible light-active photocatalysts often faces a number of problems, such as low quantum efficiency, photocor- rosion, or photodissolution, or a high degree of selectivity to remove organic matter [48].
The efficiency of TiO2and ZnO as photocatalysts applied for the elimination of organic trace pollutants under UV radiation is not easy to exceed. TiO2and ZnO were investigated to transform various sulfonamides [4,15–17,49,50]. Both catalysts were effective; however, the efficiency depended on the chemical structure of sulfonamide, and generally, TiO2P25 provided better efficiency than ZnO, especially in the presence of H2O2[16]. Comparing the efficiency of heterogeneous photocatalysis to other AOPs, sulfonamide degradation is highly cost-effective for ozonation, but toxic, ozone resistant intermediates forms, while using TiO2or ZnO, the mineralization is also efficient. Several visible light-activated pho- tocatalysts (g-C3N4[10,14], Bi2O4[12], Bi2MoO6/Bi2WO6[13], WO3[11]; CexZryO2[7]) were also tested with sulfonamides, with usually lower efficiency compared to TiO2and ZnO, although some promising results can also be found. The efficiency of BiOI/BiOCl composite photocatalyst for the degradation of SMP and methyl orange under UV (398 nm) and visible light irradiation was comparable to TiO2P25, but highly toxic intermediates were accumulated opposite to the P25, which was efficient for mineralization and toxicity decrease [51]. Besides developing new photocatalysts, using more efficient light sources such as UV or UV/Vis LEDs, and advanced reactor designs may enhance the cost efficiency of the method [19,52,53]. In addition to their many advantages, one of the benefits of LEDs [54–56] is that they emit their photons over a relatively narrow wavelength range to be well adapted to the absorption properties of photocatalysts and provide an opportunity to handle the wavelength-depending effects easily [57–60].
Materials2022,15, 49 3 of 20
One of the barriers to the practical application of heterogeneous photocatalysis is the adverse effect of the matrix and its parameters on efficiency. Dissolved organic matter and inorganic ions may act as UV filters, radical scavengers or adsorbing on the catalysts’
surface can occupy the active sites and reduce efficiency [61–64]. Besides the adverse effects, the adsorption of some ions might result in better charge separation, or their reaction with photogenerated charge carriers results in the formation of less reactive and more selective radicals (e.g., Cl•, CO3•−, SO4•−) than•OH which could contribute to the transformation of given organic pollutants [61,65–68].
The current research aimed to compare the efficiency of the commercially available photocatalysts, TiO2and ZnO, irradiated with two LED light sources; a high power UV- A LED emitting at 365 nm (LED365nm) and a cheap commercial LED-tape emitting at 398 nm (LED398nm). The removal of two sulfonamide antibiotics, sulfamethazine (SMT) and sulfamethoxypyridazine (SMP), was investigated in detail and compared based on removal and mineralization rates. The direct detection of reactive species in the case of heterogeneous photocatalysis is rather difficult; however, the knowledge of their formation rate under given circumstances is crucial for the elucidation of degradation mechanism and the assessment of photocatalytic activity. The•OH formation rates were compared using coumarin (COU) as a model compound. The rate and importance of the direct charge transfer process were compared using 1,4-benzoquinone (1,4-BQ) in O2-free suspensions.
The formation of organic and inorganic degradation products of sulfonamides and the ecotoxicity of the treated solutions were also investigated. Experiments were performed in real water matrices (tap water and biologically treated wastewater), and the effect of methanol as•OH scavenger and the most abundant anions (Cl−, HCO3−) of the matrices was also investigated.
2. Materials and Analytical Methods 2.1. Photochemical Experiments
Two photoreactors were used during the photocatalytic experiments. One was equipped with 12 high-power UV—A LED light sources (Vishay, Malvern, PA, USA;
VLMU3510-365-130, 0.69 W radiant power at 2.0 W electric power input) emitting at 365 nm (LED365nm). A laboratory power supply (Axiomet, Malmö, Sweden; AX-3005DBL-3;
maximum output 5.0 A/30.0 V) was used to control the electrical power uptake of the light sources (6.6 W). Irradiations were performed in a 200 cm3cylindrical glass reactor placed inside the hexagonally arranged LEDs (Figure S1a). The solutions were bubbled with gas from a porous glass filter. Synthetic air or N2(99.995%) was used depending on the measurements.
The other photochemical reactor was equipped with commercial UV-LED tapes (LED- master, Szeged, Hungary; 4.6 W electric power input; 60 diodes/m) fixed on the inside of a double-walled, water-cooled reactor (LED398nm) (Figure S1b). Solutions were irradiated in a 100 cm3glass reactor; the suspension was bubbled with synthetic air. The emission spectra of both light sources have been measured using a two-channel fiber-optic AvaSpec-FT2048 CCD spectrometer (Avantes, Nehterlands).
Two commercially available photocatalysts were used during the experiments, TiO2
Aeroxide®P25 and ZnO. When not stated otherwise, the concentration of the photocatalyst suspensions was 1.00 g dm−3and 1.0×10⁻⁴M solutions of COU, SMT, and SMP and 2.0×10⁻⁴M solutions of 1,4-BQ were irradiated. The suspension was stirred and bubbled with air or N2for 30 min in the dark; and the measurement was started by turning on the light source. Before analysis, the samples were centrifuged (Dragonlab, Beijing, China, 15,000 RPM) and filtered using syringe filters (FilterBio, FilterBio Nantong, China; PVDF-L; 0.22µm).
2.2. Analytical Methods
X-ray diffractometry (XRD) measurements were performed with a Rigaku Miniflex II (Rigaku, Tokyo, Japan; Cu Kαradiation source, 3.0–90.0 2Theta◦range, with 4.0 2Theta◦min−1 resolution). The specific surface area was determined via N2 adsorption/desorption
Materials2022,15, 49 4 of 20
isotherms using a Quantachrome NOVA 2200 analyzer (Quantachrome, Boynton Beach, FL, USA). The pore size distribution was calculated by the BJH method. Diffuse reflectance spectroscopy (DRS) was performed using an Ocean Optics USB4000 detector and Ocean Optics DH-2000 light source (Ocean Optics, Largo, FL, USA). The bandgap energy values of the photocatalysts were evaluated by the Kubelka–Munk approach and the Tauc plot.
The elemental composition of the photocatalysts was characterized by energy-dispersive X-ray spectroscopy (Hitachi S-4700 operating at 20 kV, equipped with a “Röntec” Energy Dispersive Spectrometer with a 12 mm working distance, Hitachi, Tokyo, Japan).
The photon flux of the light sources was measured using potassium–ferrioxalate actinometry [69]. 1.0×10⁻²M Fe3+–oxalate solutions were irradiated, the released Fe2+was measured after complexation with 1,10-phenanthroline. The Fe2+–phenanthroline complex concentration was measured using UV-Vis spectrophotometry (Agilent 8453, Agilent, Santa Clara, CA, USA). During these measurements, the solutions were bubbled with N2. The concentration of COU was determined using UV-Vis spectrophotometry (ε277nm= 10,293 M−1cm−1). The concentration of the formed 7-HC was measured us- ing fluorescence spectroscopy (Hitachi F-4500, Hitachi, Tokyo, Japan), the excitation and emission wavelengths were set to 345 nm and 455 nm, respectively. The concentration of 1,4-benzoquinone (1,4-BQ), its product, the 1,4-hydroquinene (1,4-H2Q), SMT, and SMP was determined by LC-DAD (Agilent 1100, Agilent, Santa Clara, CA, USA, column: Lichro- sphere 100, RP-18; 5µm). In the case of 1,4-BQ and 1,4-H2Q the eluent consisted of 50v/v%
methanol (MeOH) and 50v/v% water; the flow rate was 1.0 cm3min−1, the temperature was set to 25◦C. In the case of SMT and SMP the eluent consisted of 30v/v% MeOH and 70v/v% formic acid (0.1v/v%), the flow rate was 1.00 cm3min−1, the temperature was set to 35◦C. The detection of 1,4-BQ, 1,4-H2Q, SMT, and SMP was performed at 250 nm, 210 nm, 265 nm, and 261 nm, respectively. The retention time was 3.4 min, 2.7 min, 9.5 min, and 6.1 min. The initial transformation rates of the model compounds (r0) were determined from the linear part of the kinetic curves (up to 20% transformation). Given that the photon flux of light sources and the volume of a treated solution differ, it is worth comparing the efficiency based on apparent quantum yield, calculated by the following equation:
Φ=
number of photons reaching the reactor volume
molphotons−1dm−3 number of transformed or formed molecule in the treated volume
mol s−1dm−3 The number of photons reaching the reactor volume was calculated from the photon flux of light LEDs divided by the volume of the actinometric solution. The volume of the actinometric solution was the same as the treated suspension.
The determination of SMT and SMP products was achieved by LC-MS, with an Agilent LC/MSD VL mass spectrometer (Agilent, Santa Clara, CA, USA) coupled to the same HPLC.
The measurements were performed using an ESI ion source and a triple quadruple analyzer in positive mode (3500 V capillary voltage and 60 V fragmentor voltage). The drying gas flow rate was 13.0 dm3min−1, and its temperature was 350◦C. The scanned mass range was between 50–1000 AMU.
Total Organic Carbon (TOC) concentration was determined using an Analytik Jena N/C 3100 analyzer (Analytik Jena, Jena, Germany). The formation of inorganic ions (NH4+, NO2−, NO3−, and SO42−) was measured using ion chromatography (Shimadzu Promi- nence LC-20AD, Shodex 5U-YS-50 column for cation detection, and Shodex NI-424 5U for anion detection, (Shimadzu, Kyoto, Japan)). The eluent was 4.0 mM methanesulfonic acid and a mixture of 2.5 mM phthalic acid for cation determination and 2.3 mM aminomethane for anion determination. The flow rate of the mobile phase was 1.0 cm3min−1.
The performed ecotoxicity tests (LCK480, Hach-Lange GmbH, Berlin, Germany) were based on the bioluminescence inhibition of the luminescent bacteriaVibrio fischeri. Formed H2O2was decomposed in the samples by adding catalase enzyme (0.20 mg dm−3) before starting the ecotoxicity tests. The luminescence of the bacteria was measured using a lumi- nometer (Lumistox 300, Hach-Lange GmbH, Berlin, Germany) after 30 min incubation time.
Materials2022,15, 49 5 of 20
2.3. Chemicals and Solvents Used
Two commercial photocatalysts were used, TiO2Aeroxid®P25 (Acros Organics, Geel, Belgium, 99.5%) and ZnO (Sigma Aldrich, St. Louis, MO, USA, 80%). Experiments were also performed using anatase (Aldrich, St. Louis, MO, USA, 99.8%) and rutile (Aldrich, St. Louis, MO, USA, 99.9%) phase TiO2. The list of chemicals used during experimental work can be found in Table S1. Tap water (Szeged, Hungary) and biologically treated domestic wastewater (Szeged, Hungary) were used as mild water matrices; the matrix parameters are summarized in Table S2.
3. Results and Discussion
3.1. The Characterization of the Light Sources and the Photocatalysts
The photon flux of the light sources was measured using potassium–ferrioxalate actinome- try and was similar: 5.52×10⁻⁶molphotons−1for LED365nmand 4.68×10⁻⁶molphotons−1for LED398nm. The emission spectra of the LED light sources are shown in Figure1a.
Materials 2022, 14, x FOR PEER REVIEW 6 of 22
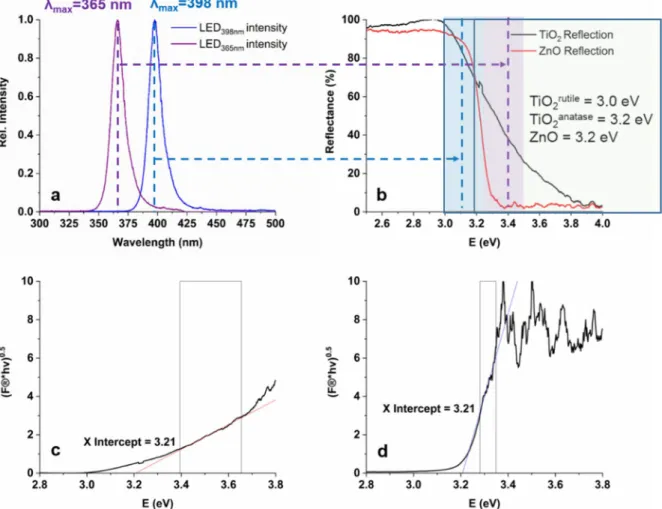
Figure 1. The UV-Vis emission spectra of the LEDs (a), the diffuse reflectance spectra and bandgap energies of TiO2 and ZnO (b), and the Tauc plot originated from DRS spectra for calculation of band gap energies of TiO2 (c) and ZnO (d).
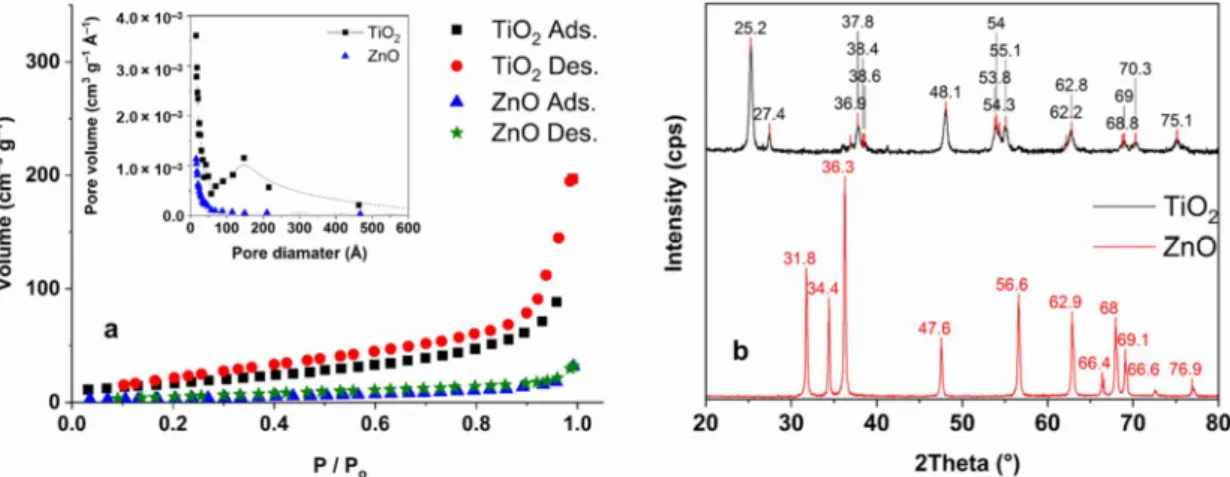
Figure 2. The N2 adsorption-desorption isotherms (a) with corresponding pore-size distribution according to the BJH model (inset), and the XRD patterns of TiO2 and ZnO (b).
3.2. Transformation and Mineralization of Sulfonamides
At the given initial concentration (1.0 × 10⁻⁴ M), the adsorption of both SMT and SMP was negligible (<2%) for both catalysts. The effect of catalyst concentration was studied in the range of 0.25–1.5 g dm−3; the transformation rate does not increase above 1.0 g dm−3
Figure 1.The UV-Vis emission spectra of the LEDs (a), the diffuse reflectance spectra and bandgap energies of TiO2and ZnO (b), and the Tauc plot originated from DRS spectra for calculation of band gap energies of TiO2(c) and ZnO (d).
Diffuse Reflectance Spectroscopy (DRS) measurements were performed to compare the UV–Vis absorbance and to calculate the bandgap energies of TiO2and ZnO (Figure1b–d).
The calculated band gaps were identical, 3.21 eV for TiO2and for ZnO. A better light absorption property of ZnO can be observed in the wavelength range emitted by LED365nm (350–400 nm); at 365 nm TiO2reflects 40%, while ZnO practically fully absorbs the photons.
Within the wavelength range, emitted by LED398nm(380–420 nm) ZnO and TiO2show similar absorption properties; no more than 15–20% of the 398 nm photons can be absorbed
Materials2022,15, 49 6 of 20
(Figure1b). For TiO2, the light of LED398nmcan excite mainly the rutile phase having 3.0 eV, while LED365nmcan cause the charge separation in rutile and anatase TiO2and ZnO [36,37].
The specific surface area and pore-size distribution of TiO2and ZnO were measured via N2 adsorption–desorption (Figure2a). The surface area of TiO2 was significantly higher (64 m2g−1) than ZnO (13 m2g−1); both measured values are close to the values given by the suppliers. The average primary particle size for Aeroxide P25 TiO2is ranges from 10 to 50 nm, largely distributed from 15 to 25 nm [36,70]. For ZnO this value is 50–70 nm [71]. Element analysis of ZnO and TiO2has been measured with EDS technology.
For both photocatalysts, the stoichiometric amount of cation (49% Zn ad 32% Ti for ZnO and TiO2respectively) and oxygen (51% for ZnO 68% for TiO2) was measured (within the measurement margin of error). Contaminants were not detected. For TiO2, the XRD pattern is in good agreement with the results reported in the literature; anatase is the dominant crystal phase in the anatase—rutile mixture (Figure2b) [72,73]. The XRD pattern of ZnO confirmed its pure wurtzite phase (Figure2b) [44,74].
Materials 2022, 14, x FOR PEER REVIEW 6 of 22
Figure 1. The UV-Vis emission spectra of the LEDs (a), the diffuse reflectance spectra and bandgap energies of TiO2 and ZnO (b), and the Tauc plot originated from DRS spectra for calculation of band gap energies of TiO2 (c) and ZnO (d).
Figure 2. The N2 adsorption-desorption isotherms (a) with corresponding pore-size distribution according to the BJH model (inset), and the XRD patterns of TiO2 and ZnO (b).
3.2. Transformation and Mineralization of Sulfonamides
At the given initial concentration (1.0 × 10⁻⁴ M), the adsorption of both SMT and SMP was negligible (<2%) for both catalysts. The effect of catalyst concentration was studied in the range of 0.25–1.5 g dm−3; the transformation rate does not increase above 1.0 g dm−3 Figure 2. The N2 adsorption-desorption isotherms (a) with corresponding pore-size distribution according to the BJH model (inset), and the XRD patterns of TiO2and ZnO (b).
3.2. Transformation and Mineralization of Sulfonamides
At the given initial concentration (1.0×10⁻⁴M), the adsorption of both SMT and SMP was negligible (<2%) for both catalysts. The effect of catalyst concentration was studied in the range of 0.25–1.5 g dm−3; the transformation rate does not increase above 1.0 g dm−3TiO2and ZnO concentration (Figure3); thus, 1.0 g dm−3photocatalyst was used for further experiments.
Materials 2022, 14, x FOR PEER REVIEW 7 of 22
TiO2 and ZnO concentration (Figure 3); thus, 1.0 g dm−3 photocatalyst was used for fur- ther experiments.
Figure 3. The effect of photocatalyst concentration on the initial transformation rate of SMT (a) and SMP (b).
In the case of SMT, no significant difference was between TiO2 and ZnO, and LED365nm was more effective than LED398nm (Figure 3a), as was expected. For SMP, using LED365nm ZnO is slightly more efficient than TiO2. Using TiO2 and LED398nm an extremely fast transformation of SMP was observed (Figure 3b), which slows down after 75% de- crease of the initial concentration (Figure 4b). Table 1. contains the initial reaction rates and the apparent quantum yields calculated at 1.0 g dm−3 photocatalyst dosage. The value determined for SMP TiO2/LED398nm is about 16 times higher than for SMT TiO2/LED398nm, while for other cases (TiO2/LED365nm, TiO2/LED365nm, TiO2/LED365nm), similar or even lower values were observed for SMP than SMT.
Figure 4. The concentration and TOC content of SMT (a,c) and SMP (b,d) during treatments.
Figure 3.The effect of photocatalyst concentration on the initial transformation rate of SMT (a) and SMP (b).
In the case of SMT, no significant difference was between TiO2and ZnO, and LED365nm
was more effective than LED398nm(Figure3a), as was expected. For SMP, using LED365nm
ZnO is slightly more efficient than TiO2. Using TiO2and LED398nm an extremely fast
Materials2022,15, 49 7 of 20
transformation of SMP was observed (Figure3b), which slows down after 75% decrease of the initial concentration (Figure4b). Table1. contains the initial reaction rates and the apparent quantum yields calculated at 1.0 g dm−3photocatalyst dosage. The value determined for SMP TiO2/LED398nmis about 16 times higher than for SMT TiO2/LED398nm, while for other cases (TiO2/LED365nm, TiO2/LED365nm, TiO2/LED365nm), similar or even lower values were observed for SMP than SMT.
Materials 2022, 14, x FOR PEER REVIEW 7 of 22
TiO2 and ZnO concentration (Figure 3); thus, 1.0 g dm−3 photocatalyst was used for fur- ther experiments.
Figure 3. The effect of photocatalyst concentration on the initial transformation rate of SMT (a) and SMP (b).
In the case of SMT, no significant difference was between TiO2 and ZnO, and LED365nm was more effective than LED398nm (Figure 3a), as was expected. For SMP, using LED365nm ZnO is slightly more efficient than TiO2. Using TiO2 and LED398nm an extremely fast transformation of SMP was observed (Figure 3b), which slows down after 75% de- crease of the initial concentration (Figure 4b). Table 1. contains the initial reaction rates and the apparent quantum yields calculated at 1.0 g dm−3 photocatalyst dosage. The value determined for SMP TiO2/LED398nm is about 16 times higher than for SMT TiO2/LED398nm, while for other cases (TiO2/LED365nm, TiO2/LED365nm, TiO2/LED365nm), similar or even lower values were observed for SMP than SMT.
Figure 4. The concentration and TOC content of SMT (a,c) and SMP (b,d) during treatments.
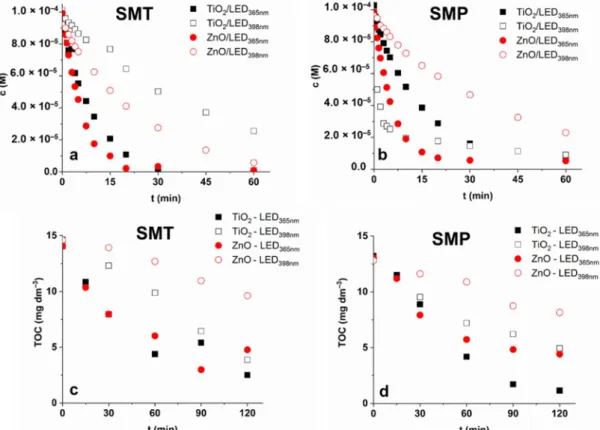
Figure 4.The concentration and TOC content of SMT (a,c) and SMP (b,d) during treatments.
Table 1.The initial transformation rates of SMT and SMP and the apparent quantum efficiencies (Φ) of the related processes.
TiO2 ZnO
SMT SMP SMT SMP
r0SMT
(mol dm−3s−1) ΦSMT r0SMP
(mol dm−3s−1) ΦSMP r0SMT
(mol dm−3s−1) ΦSMT r0SMP
(mol dm−3s−1) ΦSMP
LED365nm 1.93×10⁻⁷ 7.0×10⁻³ 1.68×10⁻⁷ 6.1×10⁻³ 2.08×10⁻⁷ 7.6×10⁻³ 2.35×10⁻⁷ 8.5×10⁻³
LED398nm 4.53×10⁻⁸ 9.7×10⁻⁴ 7.38×10⁻⁷ 1.6×10⁻² 6.43×10⁻⁸ 1.4×10⁻³ 4.12×10⁻⁸ 8.8×10⁻⁴
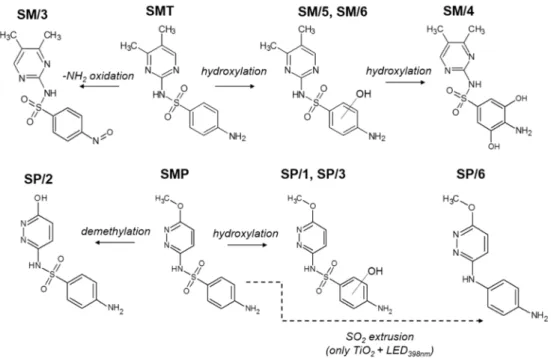
To interpret the specific behavior of SMP, we first examined and compared the dis- tribution of aromatic intermediates, which are formed and transformed during the first 60 min. of treatment. The proposed structures of the formed products of SMT and SMP are summarized in Figure5, while product distribution is shown in Figures S2 and S3. For SMT, six stable products were observed on the chromatogram (HPLC-DAD) (Figure S2), and four of them were identified with MS. The SM/3 product (m/z= 293.2) resulted by the oxidation of the terminal amino group, while SM/4 (m/z= 311.0), SM/5, and SM/6 (m/z= 295.1) formed via hydroxylation of the aromatic ring, most probably due to the reaction with
•OH [75,76]. No significant difference was found between the products formed using TiO2
and ZnO; however, ZnO produced a higher SM/5 concentration (Figure S2). The distri- bution of the products does not depend on the wavelength; only their accumulation and decomposition rate was higher using LED365nmthan LED398nm.
Materials2022,15, 49 8 of 20
Materials 2022, 14, x FOR PEER REVIEW 9 of 22
Figure 5. The proposed primary stable products of SMT and SMP transformation during hetero- geneous photocatalysis.
3.3. Mineralization of Sulfonamides and Ecotoxicity Assays
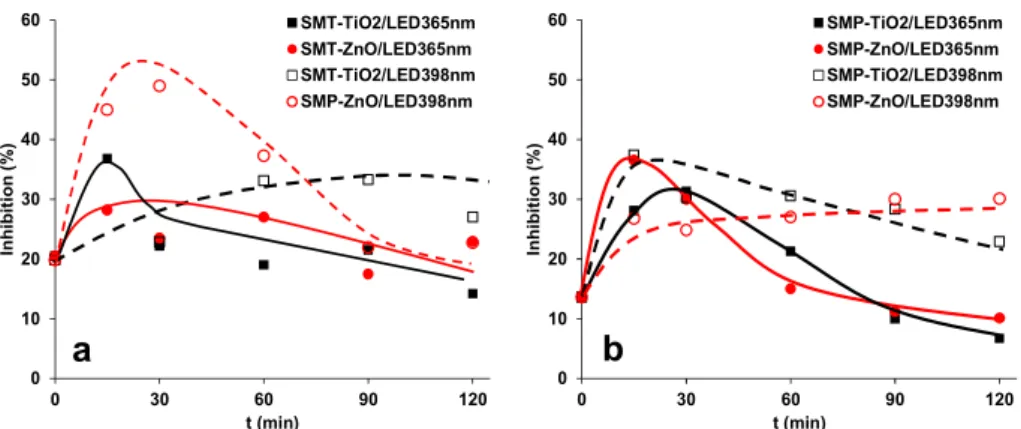
In the case of ozonation and UV photolysis, the intermediates of sulfonamides often have toxic effects. Moreover, chemicals together produce combination effects that are larger than the effects of the component separately. Thus, the change of ecotoxicity of the treated solution was investigated using Vibrio fischeri as a test organism. The 1.0 × 10⁻⁴ M concentration SMT and SMP caused a relatively low (<20%) inhibition. For SMT, the toxicity did not change or even increased slightly due to the formation of toxic products, then slowly decreased as their further transformation progressed (Figure 6a). For SMP, more significant changes were observed; it increased intensively and later decreased, and finally, toxicity lowered below the parent compound in the case of LED365nm (Figure 6b).
The ecotoxicity change in the case of LED398nm depends on the photocatalysts: for SMT, the ZnO, while for SMP, the TiO2 is the more efficient.
Figure 6. Change of ecotoxicity of the SMT (a) and SMP (b) solutions as a function of treatment time.
The main goal of AOPs is generally not only the transformation but the complete mineralization of pollutants to avoid the accumulation of potentially toxic intermediates.
In the case of SMT, both TiO2 and ZnO irradiated with LED365nm reduced the TOC by
~80%. Using LED398nm, the ZnO is more efficient for SMT transformation than TiO2, but
0 10 20 30 40 50 60
0 30 60 90 120
Inhibition (%)
t (min)
SMT-TiO2/LED365nm SMT-ZnO/LED365nm SMT-TiO2/LED398nm SMP-ZnO/LED398nm
0 10 20 30 40 50 60
0 30 60 90 120
Inhibition (%)
t (min)
SMP-TiO2/LED365nm SMP-ZnO/LED365nm SMP-TiO2/LED398nm SMP-ZnO/LED398nm
a b
Figure 5.The proposed primary stable products of SMT and SMP transformation during heteroge- neous photocatalysis.
In the case of SMP, SP/1 and SP/3 are hydroxylated products (m/z= 297.1), while SP/2 (m/z= 267.0) is resulted by demethylation [77]. The same products formed with a similar concentration distribution for ZnO using different LEDs. For SMT, the product distribution was similar for TiO2and ZnO, while for SMP, it was different; SP/1 and SP/2 formed mainly in the case of ZnO, and SP/4 was observed only for TiO2using LED365nm. (Figure S3). However, in the case of TiO2/LED398nm, not only did the conversion rate of SMP increase drastically but also the intermediates were changed in the case of lower- energy 398 nm radiation: besides the main product SP/6 (m/z= 217.0), which forms via -SO2-extrusion, the formation of hydroxylated products is negligible. The significant change of the primary products in the case of TiO2/LED398nmprocess indicates that the reaction mechanism of SMP is different in this case.
The primary product of sulfonamides often forms via desulfonation in both direct and indirect photodegradation processes [78–80]. Boreen et al. attributed the indirect oxidation partly to the interaction with triplet excited-state dissolved organic matters when the -SO2- extrusion happens due to the electron transfer and not to the energy transfer.
The -SO2- extrusion as the primary transformation way was also reported in a previous work of the authors; the reaction happened selectively, BiOI/BiOCl photocatalysts [51]
and direct charge transfer was supposed as the primary transformation process. Ge et al.
compared the major conversion pathways for the transformation of different sulfonamides initiated by photolysis,•OH-based, and singlet oxygen and desulfonation was particularly characteristic of photolysis, which includes direct photolysis and photosensitization via triplet excited-state dissolved organic matters [81]. All of these suggest that besides•OH and direct charge transfer, the relative contribution of the reaction with singlet oxygen and direct energy transfer cannot be ignored and, despite their selectivity, can significantly contribute to the conversion of individual sulfonamides.
3.3. Mineralization of Sulfonamides and Ecotoxicity Assays
In the case of ozonation and UV photolysis, the intermediates of sulfonamides often have toxic effects. Moreover, chemicals together produce combination effects that are larger than the effects of the component separately. Thus, the change of ecotoxicity of the treated solution was investigated usingVibrio fischerias a test organism. The 1.0×10⁻⁴M concentration SMT and SMP caused a relatively low (<20%) inhibition. For SMT, the toxicity
Materials2022,15, 49 9 of 20
did not change or even increased slightly due to the formation of toxic products, then slowly decreased as their further transformation progressed (Figure6a). For SMP, more significant changes were observed; it increased intensively and later decreased, and finally, toxicity lowered below the parent compound in the case of LED365nm(Figure6b). The ecotoxicity change in the case of LED398nmdepends on the photocatalysts: for SMT, the ZnO, while for SMP, the TiO2is the more efficient.
Materials 2022, 14, x FOR PEER REVIEW 9 of 22
Figure 5. The proposed primary stable products of SMT and SMP transformation during hetero- geneous photocatalysis.
3.3. Mineralization of Sulfonamides and Ecotoxicity Assays
In the case of ozonation and UV photolysis, the intermediates of sulfonamides often have toxic effects. Moreover, chemicals together produce combination effects that are larger than the effects of the component separately. Thus, the change of ecotoxicity of the treated solution was investigated using Vibrio fischeri as a test organism. The 1.0 × 10⁻⁴ M concentration SMT and SMP caused a relatively low (<20%) inhibition. For SMT, the toxicity did not change or even increased slightly due to the formation of toxic products, then slowly decreased as their further transformation progressed (Figure 6a). For SMP, more significant changes were observed; it increased intensively and later decreased, and finally, toxicity lowered below the parent compound in the case of LED365nm (Figure 6b).
The ecotoxicity change in the case of LED398nm depends on the photocatalysts: for SMT, the ZnO, while for SMP, the TiO2 is the more efficient.
Figure 6. Change of ecotoxicity of the SMT (a) and SMP (b) solutions as a function of treatment time.
The main goal of AOPs is generally not only the transformation but the complete mineralization of pollutants to avoid the accumulation of potentially toxic intermediates.
In the case of SMT, both TiO2 and ZnO irradiated with LED365nm reduced the TOC by
~80%. Using LED398nm, the ZnO is more efficient for SMT transformation than TiO2, but
0 10 20 30 40 50 60
0 30 60 90 120
Inhibition (%)
t (min)
SMT-TiO2/LED365nm SMT-ZnO/LED365nm SMT-TiO2/LED398nm SMP-ZnO/LED398nm
0 10 20 30 40 50 60
0 30 60 90 120
Inhibition (%)
t (min)
SMP-TiO2/LED365nm SMP-ZnO/LED365nm SMP-TiO2/LED398nm SMP-ZnO/LED398nm
a b
Figure 6.Change of ecotoxicity of the SMT (a) and SMP (b) solutions as a function of treatment time.
The main goal of AOPs is generally not only the transformation but the complete mineralization of pollutants to avoid the accumulation of potentially toxic intermediates.
In the case of SMT, both TiO2and ZnO irradiated with LED365nmreduced the TOC by
~80%. Using LED398nm, the ZnO is more efficient for SMT transformation than TiO2, but mineralization is two times faster with TiO2and finally (at 120 min) approaches the value measured in the case of LED365nm, while using ZnO/LED398nmno more than 33%
TOC was removed (Figure4c,d).
For SMP, TiO2is more efficient (90 and 62% decrease for LED365nm and LED398nm, respectively) than ZnO (66% and 35% decrease for LED365nmand LED398nm, respectively) for TOC decrease in the case of both LEDs (Figure4c,d), despite that, the SMP transforma- tion rate for ZnO/LED365nmexceeds that for TiO2/LED365nm(Figure3b, Table1). Using TiO2/LED398nm, not only the transformation rate of SMP was extremely fast (Table1), but also the mineralization was favorable, especially during the first period of treatment, and finally reached the value measured for ZnO/LED365nm. A plausible explanation of this could be that changes in the mechanism result in more easily oxidizable intermediates and, consequently, increase the mineralization rate. Comparing the mineralization rates, the efficiency change in the same order for both sulfonamides; and TiO2shows better mineralization capacity than ZnO. The difference is much better manifested for LED398nm than LED365nm. It confirms that the•OH is the most important reactive species in terms of mineralization.
For SMT, the formation of inorganic ions (NH4+, NO3−, NO2−and SO42−) followed the mineralization efficiency: for LED365nm,similar results were obtained with both cata- lysts, with a slightly faster SO42−formation rate for ZnO and an enhanced NH4+produc- tion for TiO2(Figures S4 and S5). In the case of LED365nm,85% of S-content was detected as SO42−; lower values (44% for TiO2 and 65% for ZnO) were measured for LED398nm. For LED365nmthere was no significant difference between SMT and SMP in terms of in- organic ion formation rate, but it is worth comparing the SO42−conversion of SMT and SMP when TiO2/LED398nmis used. The SO42−conversion for SMT at 15 min is negligible, and no more than 25% at 60 min, while these values are 20% and 50% for SMP, confirming the different conversion mechanisms of the two sulfonamides and the importance of desul- fonation for SMP, as the first step of transformation. (Figure S5). The SO42−-formation rate for TiO2/LED398nm, when –SO2-extrusion is supposed to be the dominant transforma- tion pathway, is similar to TiO2/LED365nmand even faster for ZnO/LED365nm(Figure S5).
It proves that desulfonation is an important step not only for TiO2/LED398nm; it can prob-
Materials2022,15, 49 10 of 20
ably occur directly from the target substances as the first step of the transformation and from the aromatic intermediates.
No more than 30% of the nitrogen content was transformed into NH4+, the NO3−
conversion was even lower (<14%) (Figures S4 and S5). For both sulfonamides, NO2−
formation (<6%) was observed only for ZnO, which likely forms via the reduction of NO3−
by eCB−, and not favored on TiO2surface [82]. NO2−could be easily oxidized with•OH to NO3−(kNO2−+•OH= 6.0×10⁹M−1s−1[83]), thus its concentration remains low.
To understand the reason for the unique behavior of the SMP, we have investigated the effect of wavelength and photocatalyst on the•OH formation rate and charge separation efficiency, using COU and 1,4-BQ.
3.4. Transformation of Coumarin—The Comparison of•OH Formation Efficiency
The reaction of COU with•OH (kCOU+•OH= 6.9×10⁹M−1s−1[84]) results in highly fluorescent 7-hydroxy-coumarin (7-HC) [85,86]; its formation rate is proportional to the•OH formation rate. The ratio of COU transformation rate and 7-HC formation rate provides further information about the contribution of•OH to the COU transformation [85,87,88].
The COU adsorption was negligible for both photocatalysts (<1.0%), similar to sul- fonamides. The effect of the catalyst dose was determined in previous measurements;
the r0COU reached a maximum value at 1.0 g dm−3 in the case of both photocatalysts.
In this work, the initial concentration of COU was 1.0×10⁻⁴M, and the catalyst dosage was 1.0 g dm−3.
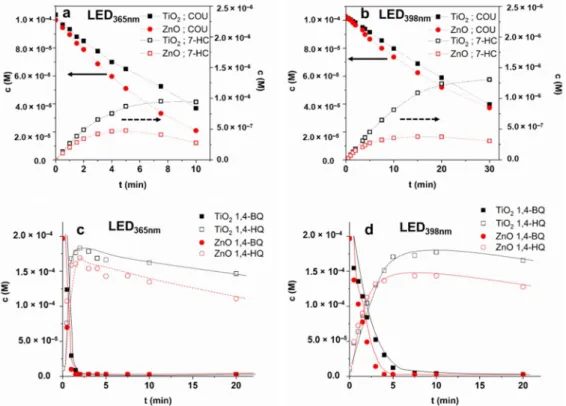
The transformation of COU was slightly faster for ZnO, especially in the case of LED398nm, while the formation rate of 7-HC was significantly higher for TiO2, than for ZnO in both cases (Table2). The maximum concentration of this hydroxylated product is almost twice for TiO2than for ZnO in the case of LED365nmand more than three times higher in the case of LED398nm(Figure7a,b). The r0COU/r07-HCratio for TiO2(0.027 and 0.041 for LED365nmand LED398nm, respectively) also exceeds the value determined for ZnO (0.019 and 0.025 for LED365nmand LED398nm,respectively). These prove the higher contribution of
•OH to the transformation when TiO2is used, mainly when LED398nmis applied (Table2).
Most probably, for ZnO the transformation of COU via direct charge transfer processes is favorable due to the higher electron mobility of photogenerated charges [89,90].
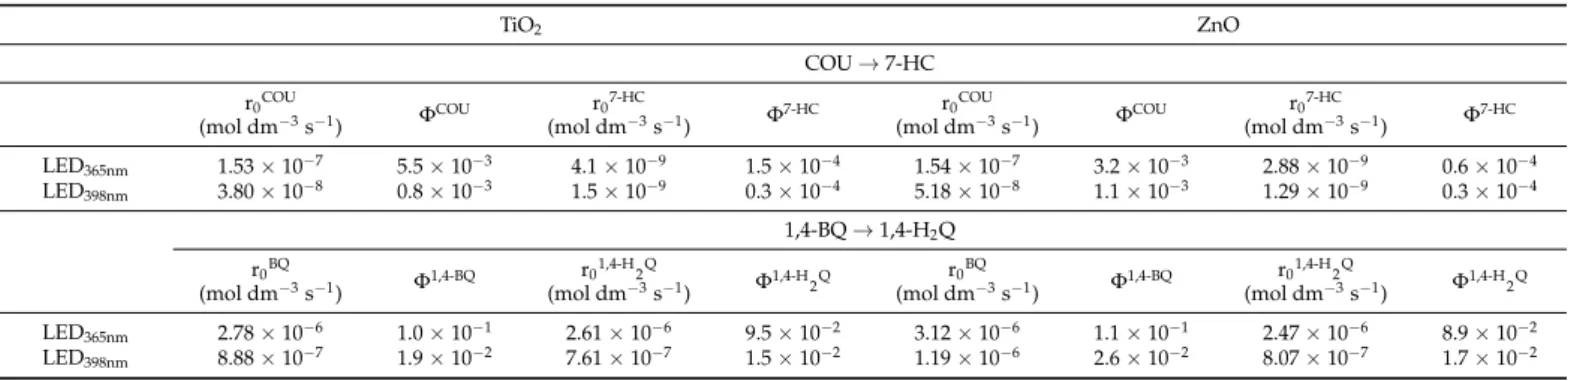
Table 2.The initial transformation rates of target substances (r0COUand r01,4-BQ), the initial formation rate of their primary products (r07-HCand r01,4-H2Q), and the apparent quantum efficiency (Φ) of the related processes.
TiO2 ZnO
COU→7-HC r0COU
(mol dm−3s−1) ΦCOU r07-HC
(mol dm−3s−1) Φ7-HC r0COU
(mol dm−3s−1) ΦCOU r07-HC
(mol dm−3s−1) Φ7-HC
LED365nm 1.53×10⁻⁷ 5.5×10⁻³ 4.1×10⁻⁹ 1.5×10⁻⁴ 1.54×10⁻⁷ 3.2×10⁻³ 2.88×10⁻⁹ 0.6×10⁻⁴
LED398nm 3.80×10⁻⁸ 0.8×10⁻³ 1.5×10⁻⁹ 0.3×10⁻⁴ 5.18×10⁻⁸ 1.1×10⁻³ 1.29×10⁻⁹ 0.3×10⁻⁴
1,4-BQ→1,4-H2Q r0BQ
(mol dm−3s−1) Φ1,4-BQ r01,4-H 2Q
(mol dm−3s−1) Φ1,4-H2Q r0BQ
(mol dm−3s−1) Φ1,4-BQ r01,4-H 2Q
(mol dm−3s−1) Φ1,4-H2Q
LED365nm 2.78×10⁻⁶ 1.0×10⁻¹ 2.61×10⁻⁶ 9.5×10⁻² 3.12×10⁻⁶ 1.1×10⁻¹ 2.47×10⁻⁶ 8.9×10⁻²
LED398nm 8.88×10⁻⁷ 1.9×10⁻² 7.61×10⁻⁷ 1.5×10⁻² 1.19×10⁻⁶ 2.6×10⁻² 8.07×10⁻⁷ 1.7×10⁻²
The apparent quantum yield (ΦCOU) relates to the COU transformation is higher for TiO2 than for ZnO (Table2); opposite that, the light absorption properties of ZnO are more favorable at 365 nm (Figure1b). When LED398nmis used, primarily the rutile phase can be excited due to its lower bandgap. Since the rutile content of TiO2 is only 15%, theΦCOUis significantly lower at this wavelength than for ZnO (Table2). Comparing the ΦCOUvalue determined at two different wavelengths was 7 times higher for TiO2, but only 3 times higher for ZnO at 365 nm than 398 nm. Similar ratios can be observed forΦ7-HCvalues.
Materials2022,15, 49 11 of 20
The different wavelengths and photon flux can affect photogenerated charge carriers’ formation and recombination rate [91,92], affecting the quantum efficiency of•OH formation.
Materials 2022, 14, x FOR PEER REVIEW 11 of 22
most twice for TiO2 than for ZnO in the case of LED365nm and more than three times higher in the case of LED398nm (Figure 7a,b). The r0COU/r07-HC ratio for TiO2 (0.027 and 0.041 for LED365nm and LED398nm, respectively) also exceeds the value determined for ZnO (0.019 and 0.025 for LED365nm and LED398nm, respectively). These prove the higher contribution of
•OH to the transformation when TiO2 is used, mainly when LED398nm is applied (Table 2).
Most probably, for ZnO the transformation of COU via direct charge transfer processes is favorable due to the higher electron mobility of photogenerated charges [89,90].
Figure 7. The concentration of COU and 7-HC (a,b) in aerated suspensions and the concentration of 1,4-BQ and 1,4-H2Q (c,d) in oxygen-free suspensions ((a,c): LED365nm; (b,d): LED398nm).
The apparent quantum yield (ΦCOU) relates to the COU transformation is higher for TiO2 than for ZnO (Table 2); opposite that, the light absorption properties of ZnO are more favorable at 365 nm (Figure 1b). When LED398nm is used, primarily the rutile phase can be excited due to its lower bandgap. Since the rutile content of TiO2 is only 15%, the ΦCOU is significantly lower at this wavelength than for ZnO (Table 2). Comparing the ΦCOU value determined at two different wavelengths was 7 times higher for TiO2, but only 3 times higher for ZnO at 365 nm than 398 nm. Similar ratios can be observed for Φ7-HC values. The different wavelengths and photon flux can affect photogenerated charge carriers’ formation and recombination rate [91,92], affecting the quantum efficiency of
•OH formation.
Figure 7.The concentration of COU and 7-HC (a,b) in aerated suspensions and the concentration of 1,4-BQ and 1,4-H2Q (c,d) in oxygen-free suspensions ((a,c): LED365nm; (b,d): LED398nm).
The efficiency of both photocatalysts was lower at 398 nm, but despite the nearly 80%
reflection and the wide bandgaps (3.2 eV), pretty good activities were measured compared to the irradiation at 365 nm. It is probably due to the presence of rutile for TiO2and the heterojunction between the rutile and anatase phases. The results on COU conversion confirmed that•OH formation is much more efficient for TiO2than for ZnO, and that wavelength also has a significant effect on•OH formation efficiency but does not explain the behavior of SMP.
3.5. Transformation of 1,4-BQ—The Comparison of Charge Separation Efficiency
Besides•OH formation efficiency, the possibility of direct charge transfer and efficiency of eCB−was also studied and compared. Fónagy et al. demonstrated that 1,4-benzoquinone (1,4-BQ) can be used as a direct eCB−scavenger under anoxic atmosphere, and the amount of the formed 1,4-H2Q is proportional to that of eCB−generated during the excitation of a photocatalyst [93]. Thus, we used the transformation rate of 1,4-benzoquinone (1,4-BQ) and the formation rate of 1,4-H2Q to investigate and compare the formation rate of photo- generated eCB−The backward reaction is also possible; reaction between 1,4-H2Q and hVB+
(Equation (2)) results in 1,4-BQ [93,94].
1,4-BQ + 2 eCB−+ 2 H+→1,4-H2Q (1) 1,4-H2Q + 2 hVB+→1,4-BQ + 2 H+ (2)
hVB++ OH−/H2O→•OH (3)
1,4-BQ +•OH→Products (4)
1,4-H2Q +•OH→Products (5)
Materials2022,15, 49 12 of 20
The transformation rate of 1,4-BQ via direct charge transfer in O2-free suspension highly exceeds that of the COU transformation, mainly based on reactions initiated by
•OH in O2-containing suspension (Table 2). The difference between the efficiency of photocatalysts was observed when LED398nmwas applied; the 1,4-BQ transformation was faster for ZnO than TiO2(Figure7d), most probably due to the higher electron mobility of ZnO [89,90]. The transformation was slower for both TiO2and ZnO using 398 nm light due to intense reflection at this wavelength and generating fewer eCB−−hVB+pairs than 365 nm photons. In both cases, the maximum concentration of 1,4-H2Q was higher for TiO2and just slowly transformed. The 1,4-BQ was present (c > 2.3 (±0.2)×10−6M) during the whole treatment time, clearly indicating the backward reaction via hVB+(Equation (2)). In the absence of O2,the reformed 1,4-BQ (Equation (2)) acts as an eCB−acceptor (Equation (1)), which opens up the way for•OH formation (Equation (3)). Most probably, the slow decrease of the sum of 1,4-BQ and 1,4-H2Q concentrations is caused by•OH initiated transformation (k1,4-BQ•OH= 1.2×10⁹M−1s−1[95] (Equation (4); k1,4-H2Q +•OH= 5.2×10⁹M−1s−1[96]
(Equation (5)) (Figure7d).
Sulfonamides react fast not only with•OH but also eaq−. Mezyk et al. investigated the kinetics and efficiencies of•OH and eaq− based reactions to the transformation of four different sulfa drugs (sulfamethazine, sulfamethizole, sulfamethoxazole, and sulfam- erazine) [97]. The rate constants of•OH based oxidation (7.8–8.5×10⁹M−1 s−1) and degradation efficiencies were similar (changed from 35% to 53%). The rate constants of reduction with the eaq−(1.0–2.1×10¹⁰M−1s−1) was even higher and varied within small ranges, but the corresponding degradation efficiency resulted in highly different values from 0.5% to 71%. They proposed that•OH adds predominantly to the sulfanilic acid ring, while reaction with eaq−occurs at different reaction sites of the different heterocyclic rings.
The higher transformation rate of SMT and SMP, for ZnO than TiO2is probably due to their direct reaction with photogenerated charges. Although the significant contribution of direct charge transfer to the conversion is a possible way to explain the difference of transforma- tion rates observed between TiO2and ZnO, it is difficult to interpret the behavior of SMP in the case of TiO2/LED398nmby this way considering that the number of photogenerated charges is much higher for LED365nm.
3.6. Reaction Mechanism—Effect of Radical Scavenger, Dissolved O2,and the Quality of TiO2
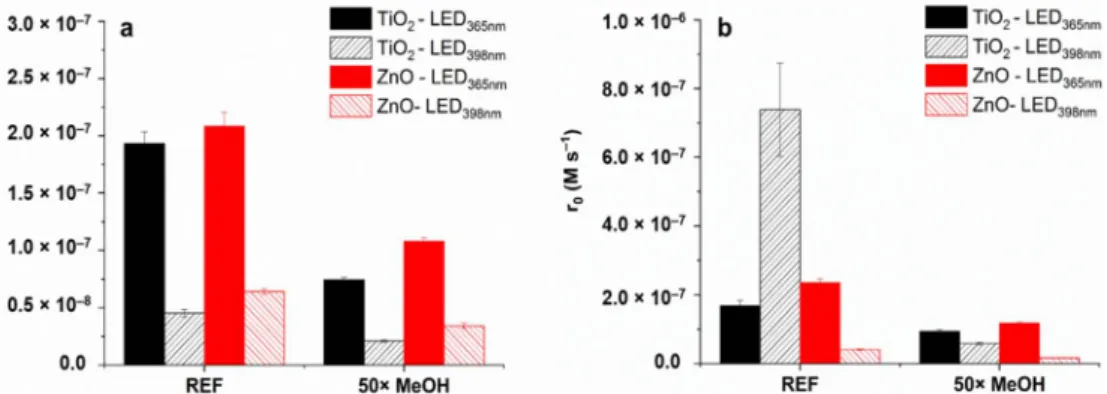
Sulfonamides react fast with•OH (kSMT +•OH= 8.3×10⁹M−1s−1[97]); thus, the effect of methanol (MeOH) as•OH-scavenger (kMeOH +•OH = 9.7×10⁸M−1s−1[98]) was in- vestigated. The addition of 2.5× 10⁻³ M MeOH to 1.0 ×10⁻⁴ M SMT or SMP scav- enges more than 70% of •OH reduced the transformation rates to about half in each case (Figure8) for TiO2/LED398nm,the SMP transformation was decreased to a similar value than TiO2/LED365nmor ZnO/LED365nm. MeOH can also be used as a hVB+scav- enger [82,99,100]; therefore, it might prevent the direct oxidation of SMP, but this is not a likely explanation in this case. The direct energy transfer is supposed to be the main reason for the photocatalytic isomerization of trans-caffeic acid in TiO2suspension [26].
The addition of MeOH completely inhibited the transformation in that case; the effect was much larger than expected based on the radical scavenging capacity of MeOH, similar to its effect on SMP transformation for TiO2/LED398nm.
Both energy transfer and direct charge transfer could increase the conversion rate, change the reaction pathway, and alter the quality of the primary intermediate. The unique behavior of SMP for TiO2/LED398nmneeded further investigation to clarify since the effect of MeOH was not enough for its proper interpretation, although its high impact indirectly confirmed the role of direct energy transfer.
In O2 containing suspension, eCB− reacts with molecular O2, which is a source of the ROS formation. The further transformation of O2•−creates a possibility to the•OH- formation via H2O2, while in O2-free suspension•OH formation is limited to the reaction of H2O/OH−with hVB+. In the O2-free suspension, the initial conversion of SMP is slower but still very significant, especially since most organic compounds are not converted at