THE EFFECT OF ITACONIC ACID ON MITOCHONDRIAL SUBSTRATE-LEVEL
PHOSPHORYLATION
PhD Thesis
Beáta Németh
János Szentágothai Doctoral School of Neurosciences Semmelweis University
Supervisor: Christos Chinopoulos, MD, Ph.D Official Reviewers: Zsuzsa Szondy, MD, D.Sc
Tamás Kardon, MD, Ph.D
Head of the Final Examination Committee:
József Mandl, MD, D.Sc
Members of the Final Examination Committee:
Balázs Sarkadi, MD, D.Sc Károly Liliom, Ph.D
Budapest
2017
2
“Discovery consists of seeing what everybody has seen, and thinking what nobody has thought.”
Albert Szent-Györgyi
TABLE OF CONTENTS
1. THE LIST OF ABBREVIATIONS ... 4
2. INTRODUCTION ... 6
2.1. Metabolism − the hub of biochemical activities ... 9
2.2. Immune system − patrolling, guarding and eliminating keeper of the gates ... 9
2.3. Macrophages − the big eaters ... 10
2.4. Substrate-level phosphorylation in the mitochondria ... 13
2.5. Itaconic acid ... 19
2.5.1. Synthesis of itaconic acid ... 20
2.5.2. Compartmentalization of itaconi acid synthesis in Aspergillus terreus ... 21
2.5.3. Industrial production of itaconic acid... 22
2.5.4. Itaconic acid as an antimicrobial agent ... 23
2.5.5. Itaconic acid in mammalian cells ... 25
2.5.6. The pathway of itaconate metabolism in murine liver mitochondria... 27
3. OBJECTIVES ... 30
4. METHODS ... 31
4.1. Animals ... 31
4.2. Isolation of mitochondria ... 31
4.3. Determination of membrane potential (ΔΨm) in isolated liver mitochondria ... 31
4.4. Mitochondrial respiration ... 32
4.5. Cell cultures ... 33
4.6. Mitochondrial membrane potential (ΔΨm) measurement in cultured BMDM and RAW-264.7 cells ... 34
4.7. Image analysis ... 34
4.8. Measurement of in situ mitochondrial oxidation and glycolytic activity ... 35
4.9. Western blot analysis ... 35
4.10. Fluorescein-tagged siRNA and cell transfections ... 36
3
4.11. Acod1-FLAG plasmid transfections ... 36
4.12. Immunocytochemistry ... 36
4.13. Determination of SDH activity ... 37
4.14. Statistics ... 37
4.15. Reagents ... 37
5. RESULTS ... 38
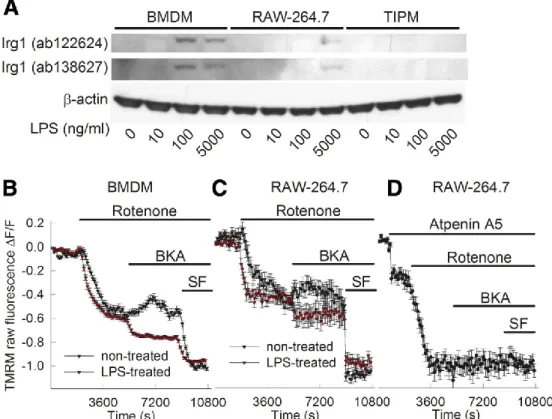
5.1. The effect of LPS on matrix SLP in macrophage cells ... 38
5.2. The effect of transfecting cells with siRNA directed against Acod1 on matrix SLP during treatment with LPS ... 41
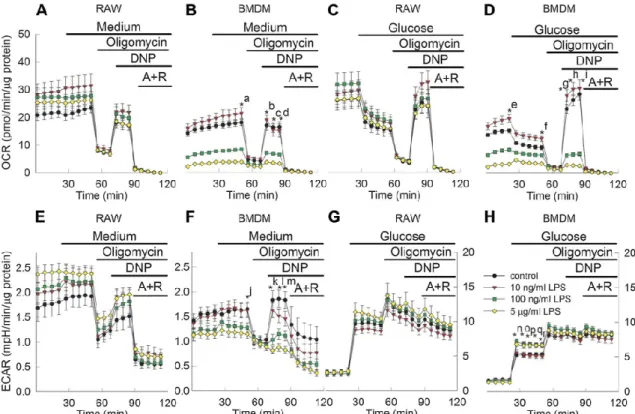
5.3. The effect of LPS treatment on oxygen consumption and extracellular acidification rates in macrophages ... 46
5.4. Categorization of respiratory substrates used for isolated mitochondria ... 50
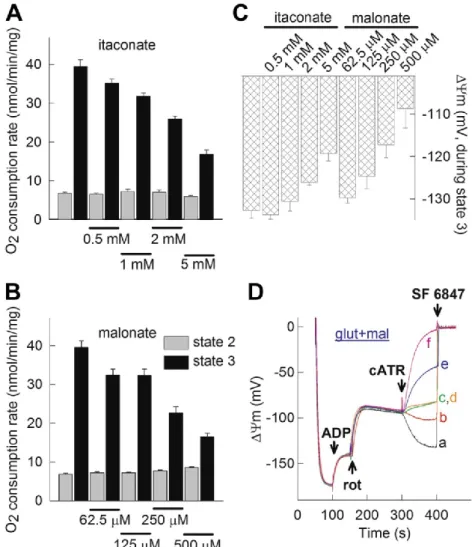
5.5. The dose-dependent effect of itaconate on ANT directionality in rotenone-treated isolated mitochondria ... 51
5.6. The effect of malonate on ANT directionality in rotenone-treated isolated mitochondria ... 54
5.7. The effect of the succinate-CoA ligase inhibitor KM4549SC on ANT directionality in rotenone-treated isolated mitochondria ... 57
6. DISCUSSIONS ... 60
7. CONCLUSIONS ... 66
8. SUMMARY ... 67
9. ÖSSZEFOGLALÁS ... 68
10. BIBLIOGRAPHY ... 69
11. BIBLIOGRAPHY OF THE CANDIDATE’S PUBLICATIONS ... 82
11.1. The publications related to the PhD thesis ... 82
11.2. The publications not related to the PhD thesis ... 82
12. ACKNOWLEDGEMENTS ... 84
4 1. THE LIST OF ABBREVIATIONS
Acod1 cis-aconitate decarboxylase 1 gene (previous name: immunoresponsive gene 1, Irg1) (in mouse)
Acod1 cis-aconitate decarboxylase 1 protein (previous name: immunoresponsive protein 1, Irg1) (in mouse)
ADP adenosine 5'-diphosphate ANT adenine nucleotide translocase ATP adenosine 5'-triphosphate
BKA bongkrekic acid (ANT inhibitor) BMDM bone marrow-derived macrophages
CAD cis-aconitate decarboxylase protein (in fungus Aspergillus terreus) cad1 cis-aconitate decarboxylase gene (in fungus Aspergillus terreus) cATR carboxyatractyloside (ANT inhibitor)
DNP 2,4-dinitrophenol (uncoupler) ECAR extracellular acidification rate ETC electron transport chain
FAD flavin adenine dinucleotide (oxidized form) FADH2 flavin adenine dinucleotide (reduced form) FMN flavin mononucleotide (oxidized form) GABA γ-aminobutyric acid
GDH glutamate dehydrogenase GDP guanosine 5'-diphosphate GTP guanosine 5'-triphosphate
KGDHC α-ketoglutarate dehydrogenase complex LPS lipopolysaccharide
MGTK methylglutaconase (methylglutaconyl-CoA hydratase)
NAD(P)+ nicotinamide adenine dinucleotide (phosphate) (oxidized form) NAD(P)H nicotinamide adenine dinucleotide (phosphate) (reduced form) OCR oxygen consumption rate
Pi inorganic phosphate ROS reactive oxygen species SDH succinate dehydrogenase
5
SF 6847 3,5-di-tert-butyl-4-hydroxybenzylidenemalononitrile (uncoupler) siRNA short-interfering RNA
SLP substrate-level phosphorylation
STK / SUCL succinate thiokinase / succinate-CoA ligase (succinyl-CoA synthetase) TAMs tumor associated macrophages
TCA tricarboxylic acid cycle (citric acid cycle) TIPM thioglycollate-induced peritoneal macrophages TLR Toll-like receptor
TMRM tetramethylrhodamine methyl ester ΔΨm mitochondrial membrane potential
6 2. INTRODUCTION
Itaconic acid, matrix substrate-level phosphorylation (SLP) and macrophages represent the main focus of this thesis. From a more general point of view, it is about immune cell specific metabolism.
Usually, metabolism is viewed as the function of cells generating a store of energy by catabolism, and to synthesizing macromolecules for cell maintenance and growth through anabolic pathways. However, today we know that there are some disorders, such as diabetes, atherosclerosis, cancer, inflammatory conditions, in which there are obvious dysfunctions in metabolism. In early 1900s Otto Warburg proposed that metabolic dysregulation was a feature of tumor cells (Warburg, 1923). The German biochemist discovered that when oxygen becomes limiting, mitochondrial oxidative metabolism is restricted in tumor cells, i.e., the cancer cells take up large amounts of glucose and metabolize it to lactic acid, even in the presence of oxygen. This process has become known as the Warburg effect.
There is an emerging field of interest in studies of immune system metabolism (immunometabolism). The aim of these investigations are: how immune cells function in terms of their intracellular metabolism, how these metabolic pathways affect the phenotype and activation of immune cells, and how the immune system affects the metabolic functions of its host organism (Pearce et al., 2013).
Studies on murine macrophages uncovered a gene, cis-aconitate decarboxylase 1 (Acod1), as one of the most highly expressed gene under pro-inflammatory conditions, which product, cis-aconitate decarboxylase 1 protein (Acod1), is associated with mitochondria (Degrandi et al., 2009). Furthermore, experiments revealed that in mammalian cells Acod1, similarly to cis-aconitate decarboxylase (CAD) in fungus Aspergillus terreus, synthesizes itaconic acid through decarboxylation of the tricarboxylic acid (TCA) cycle intermediate cis-aconitic acid (Michelucci et al., 2013).
The same metabolite, itaconic acid, was discovered in lipopolysaccharide (LPS)- activated macrophages (Strelko et al., 2011).
In the mitochondrial matrix, as the part of TCA cycle, succinate-CoA ligase (SUCL) catalyzes the reversible conversion of succinyl-CoA and ADP (or GDP) to CoASH, succinate and ATP (or GTP) (Figure 1). This reaction is known as substrate- level phosphorylation, and plays a critical role in producing high-energy phosphates in
7
mitochondria − it is the only means of ATP (or GTP) source under hypoxia or impaired electron transport chain (ETC). In murine macrophages itaconic acid and SLP are placed within the same compartment, that is, in the mitochondria. Whatsoever, itaconate is formed from the TCA cycle intermediate, and at the same time, SLP is also part of TCA cycle. The consideration arises: Does itaconic acid have any impact on SLP, or not?
In isolated mitochondria, the TCA cycle, that is, the operation or not of SLP could be manipulated using different substrates (for details see: “Categorization of respiratory substrates used for isolated mitochondria”). The functionality of SLP is essential during compromised ETC. Under experimental conditions different inhibitors of the complexes of the ETC are used to mimic respiratory chain failure. Changes in operation of SLP are deduced from directionality of adenine nucleotide translocase (ANT). In the experiments using “biosensor test” (Figure 3) the effect of ANT inhibitor on mitochondrial membrane potential (ΔΨm) during ADP-induced respiration is examined. ΔΨm is estimated using fluorescence quenching of a cationic dye, which accumulates inside energized mitochondria. As the hypothesis through this thesis is that itaconate affects SLP, any of its effects could be detected using “biosensor test”.
8
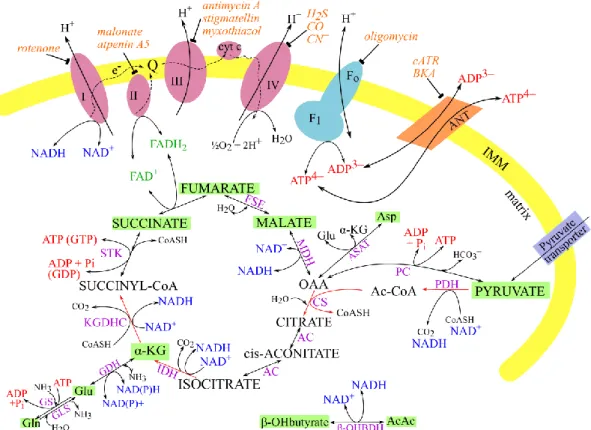
Figure 1. Schematic representation of TCA cycle and ETC. Electron carriers, NADH and FADH2, transduce their reducing equivalents to the ETC (shapes in magenta) through C-I and II. CoQ serves as a mobile carrier of electrons as well as cytochrome c. Electron flow through C-I, III and IV is accompanied by proton flow from the matrix to the intermembrane space. The overall proton gradient across the inner mitochondrial membrane (IMM) drives the phosphorylation of ADP to ATP by Fo-F1 ATP synthase.
The complex-specific inhibitors are shown in orange. ANT, adenine nucleotide translocase; BKA, bongkrekic acid; cATR, carboxyatractyloside; Pi, inorganic phosphate; OAA, oxaloacetate; α-KG, α-ketoglutarate; Gln, glutamine; Glu, glutamate;
Asp, aspartate; AcAc, acetoacetate; β-OHBDH, β-hydroxybutyrate dehydrogenase;
PDH, pyruvate dehydrogenase; PC, pyruvate carboxylase; CS, citrate synthase; ASAT, aspartate aminotransferase; AC, aconitase; GS, glutamine synthetase; GLS, glutaminase; GDH, glutamate dehydrogenase; IDH, isocitrate dehydrogenase;
KGDHC, α-ketoglutarate dehydrogenase complex; STK, succinate thiokinase; FSE, fumarase; MDH, malate dehydrogenase. Substrates used to manipulate SLP in isolated mitochondria are highlighted in green (for details see: “Categorization of respiratory substrates used for isolated mitochondria”).
9
2.1. Metabolism − the hub of biochemical activities
Metabolism is sometimes overlapping cross-talk of different and complex biochemical pathways. This great hub of interconnected chemical changes incorporates two contrasting processes, catabolism and anabolism. These two mechanisms together constitute the chemical pathways of reactions that convert food into usable forms of energy and structured biomolecules. Catabolism, in other means the degradation of ingested food or stored fuels (carbohydrates, lipids and proteins), generates either usable or storable forms of energy. As a result of catabolic reactions complex biomolecules are converted to smaller ones, such as carbon dioxide (CO2), water (H2O), ammonia (NH3).
In mammals, this process usually requires consumption of oxygen. Oxidative breakdown of food is linked to energy-production and releasing of reducing power. The energy released during catabolic processes is used to ATP synthesis, furthermore reduced electron carriers are also obtained (NAD(P)H and FADH2), and some of the energy is lost as heat. On the other hand, anabolic pathways are in charge of biosynthesis of large molecules from smaller precursors by energy utilization processes – it requires the phosphoryl group transfer potential of ATP and the reducing power of NAD(P)H and FADH2. Biochemical reactions based on energy mobilization perform various important functions − for example, nerve impulse conduction, muscle contraction, active ion transport, thermogenesis, cell growth and division.
ATP, an interchangeable currency in living organisms, is the essential link between energy-producing and energy-utilizing pathways. Hydrolysis or more precisely the transfer of phoshoryl, pyrophosphoryl, or adenylyl group from ATP to substrates results in coupling the energy of ATP breakdown to energy-utilizing reactions. Under physiological conditions ATP is chelated with a divalent magnesium cation (Jahngen and Rossomando, 1983).
2.2. Immune system − patrolling, guarding and eliminating keeper of the gates The immune system is the body’s own defense system against pathogens. This sensitive and specific biochemical system is capable of distinguishing molecular “self”
from “non-self”. In this way the immune system eliminates those entities that may pose a threat to the organism. The immune response to an invader is an intricate and coordinated set of interactions among many classes of proteins, molecules and cell types
10
(Nelson and Cox, 2008). A specialized array of cells arises from undifferentiated stem cells in the bone marrow − a variety of leukocytes, including macrophages and lymphocytes.
From our point of view macrophages are of the interest in this work, and let it be given a somewhat detailed overview of them.
2.3. Macrophages − the big eaters
Macrophages were originally identified by Ilya Metchnikoff more than 100 years ago (Nathan, 2008). These large, amoeba-like cells are terminally differentiated cells of the immune system. They do not need energy and biomass to proliferate but instead to sustain a high phagocytic and secretory activity. Macrophages, found in all tissues, play crucial roles in innate immunity and can respond to local immune- and/or pathogen-derived signals to adopt different activation states (Mantovani et al., 2013).
Macrophages are by origin leukocytes and may have different names according to where they function in the body. They are termed: alveolar macrophages – in lung;
Kupffer cells – in liver; microglia – in central nervous system; splenic macrophages – in spleen marginal zone, red and white pulp.
Macrophages recognize the pathogens via Toll-like receptors (TLRs). These evolutionarily conserved receptors are a group of special receptors called PRRs (Pattern-Recognition Receptors) which recognize conserved microbial structures called PAMPs (Pathogen-Associated Molecular Patterns) or DAMPs (Danger-Associated Molecular Patterns) that are endogenous molecules released from necrotic or dying cells. TLRs are homologues of the Drosophila Toll protein, discovered to be important for defense against microbial infection. PAMPs, exclusively expressed by microbial pathogens, include various bacterial cell wall components such as LPS, peptidoglycan and lipopeptides, as well as flagellin, bacterial DNA and viral double-stranded RNA.
DAMPs include intracellular proteins such as heat shock proteins as well as protein fragments from the extracellular matrix (Rosin and Okusa, 2011).
The major structural component of the outer wall of all Gram-negative bacteria, LPS, is recognized by Toll-like receptor 4 (TLR4). Ten human and twelve murine TLRs have been characterized, TLR1 to TLR10 in humans, and TLR1 to TLR9, TLR11,
11
TLR12 and TLR13 in mice, the homolog of TLR10 being a pseudogene. TLRs are characterized by an extracellular domain containing leucine-rich repeats and a cytoplasmic tail that contains a conserved region called the Toll/IL-1 receptor domain.
LPS consists of a polysaccharide region that is anchored in the outer bacterial membrane by a specific carbohydrate lipid moiety termed lipid A. Lipid A is responsible for the immunostimulatory activity of LPS.
Macrophages undergo specific differentiation depending on the local tissue environment. The concept of classic and alternative activation of macrophages has been in practice since the 1990s when it was discovered that the cytokine interleukin (IL)-4 induced different effects on macrophage gene expression compared to that of interferon (IFN)-γ and LPS. Later, in 2000, Mills and colleagues proposed a new terminology for macrophage classification (Mills et al., 2000). The scientific community accepted that M1 (classically activated) macrophages exhibit inflammatory functions, whereas M2 (alternatively activated) macrophages exhibit anti-inflammatory functions. Today the M1/M2 classification of macrophages is considered an oversimplified approach. For example, the tumor associated macrophages (TAMs) do not fit into the criteria of M1 or M2 macrophages (Qian and Pollard, 2010); furthermore, macrophages expressing T cell receptors (TCR) and CD169 have also been identified (Qi Chávez-Galán et al., 2015).
M1 and M2 activation is characterized by distinct metabolic states, which differ from those of resting macrophages (Rodríguez-Prados et al., 2010). M1 macrophages, activated by LPS and IFN-γ, undergo a switch from oxidative phosphorylation to glycolysis, similar to Warburg effect in tumors. Most of the glucose is converted to lactate, with little being used for oxidative phosphorylation. Even though glycolysis is an inefficient means of ATP production compared to the TCA cycle, still it could be a mechanism to rapidly generate ATP. How does LPS promote switch from oxidative phosphorylation to glycolysis? There are at least four main processes (Kelly and O’Neill, 2015). i) LPS increases the expression of inducible nitric oxide synthase (iNOS), which generates nitric oxide, a reactive nitrogen species that can inhibit oxidative phosphorylation. ii) In LPS-induced macrophages the expression of hypoxia- inducible factor-1α (HIF-1α) is increased, which increases the expression of its target genes, and leads to increased glycolytic flux. iii) LPS causes a marked change from expression of 6-phosphofructo-2-kinase (encoded by PFKFB1) to the PFKFB3 isoform
12
thereby increasing levels of the metabolite fructose-2,6-bisphosphate. The later one activates the glycolytic enzyme 6-phosphofructo-1-kinase. iv) LPS inhibits AMP- activated protein kinase, resulting in decreased β-oxidation of fatty acids and mitochondrial biogenesis. Further feature of classically activated macrophages is the increased flux through the pentose phosphate pathway, which provides purines and pyrimidines for biosynthesis in the activated cell. M1 macrophages are known to release reactive oxygen species (ROS) and reactive nitrogen species (including NO) in phagosomes serving as a mechanism of pathogen killing (West et al., 2011). To phagocyte, a large turnover of membrane is required; therefore, macrophages increase phospholipid synthesis and switch from cholesterol to phosphatidylcholine production (Ecker et al., 2010). In contrary, M2 macrophages, activated by IL-4, have low glycolysis rates, but perform high fatty acid oxidation and oxidative phoshporylation rates (Vats et al., 2006).
Macrophages are known to be associated with solid tumors (Gordon and Taylor, 2005). They can be recruited to the tumor site from surrounding tissues (Kitamura et al., 2015). Studies have shown that TAMs can express both M1 and M2 polarization fenotypes (Allavena et al., 2008). Notably, switching TAMs to a predominantly M1 phenotype has been proposed as a key anti-cancer immunotherapeutic treatment strategy (Mills et al., 2016). TAMs are known to promote tumor progression (Komohara et al., 2014). They induce angiogenesis, lymphogenesis, stroma remodeling and immune suppression. They also play a key role in promoting tumor invasion and metastasis (Komohara et al., 2016).
Efforts to fully understand macrophage functions involve in vitro studies of primary macrophage populations or macrophage-like cell lines. They are suitable for the study of cellular responses to microbes and their products. Through this thesis the following macrophage lines are mentioned: RAW-264.7 cells, BMDM cells, TIPMs.
RAW-264.7 cells are macrophage-like, Abelson leukemia virus transformed cell line derived from BALB/c mice. This cell line is a commonly used model of mouse macrophages for the study of cellular responses to microbes and their products.
Bone marrow-derived macrophages (BMDM), as it stands in the name, they are derived from bone marrow cells. They are primary cells, cultured in vitro in the presence of growth factors. Compared to other primary cells, the BMDM are
13
homogenous, have a proliferative capacity, are transfectable, and have a lifespan longer than a week.
Thioglycollate-induced peritoneal macrophages (TIPMs) are used as primary macrophages in lots of studies, mainly because they are easy to obtain. The peritoneal cavity harbors a number of immune cells including macrophages, B cells and T cells, and is a preferred site for the collection of naïve tissue resident macrophages.
2.4. Substrate-level phosphorylation in the mitochondria
Mitochondria are double-membrane-bound compartments, which range in size between 1 and 10 μm in length. They occur in numbers that directly correlate with the cell's level of metabolic activity. The morphologies of these subcellular organelles vary among different cell types. As an example, fibroblast mitochondria are usually long filaments, whereas hepatocyte mitochondria are more uniformly spheres or ovoids.
When mitochondria are observed in live cells in electron micrographs, it is apparent that they are far more dynamic than static organelles. Combined action of fission and fusion continually changes their shapes, resulting in extended reticular networks of mitochondria (Youle and van der Bliek, 2012).
As mitochondria move within cytoplasm, they often appear to be the favored
“cargoes” of microtubules (Yaffe, 1999). This association with microtubules may determine the unique orientation and distribution of mitochondria in different types of cells − for example, it can form long moving chains (packed between adjacent myofibrils in a cardiac muscle), or remain fixed in one position (wrapped tightly around the flagellum in a sperm).
Mitochondria play a key role in ATP synthesis, and are important in other cellular processes, including fatty acid synthesis, Ca2+ homeostasis, ROS production and the biogenesis of hem and iron-sulfur proteins.
Mitochondria, sometimes termed the “powerhouse” of the cell, can decide upon
“whether to live, or die” by releasing adequate signals to the environment. “To live”
means synthesizing ATP and suppling it to the body's energy requiring processes; “let die” means suspension of ATP synthesis and facilitating signal cascade transduction utilizing apoptotic and necrotic reactions. Cytochrome c, known to be an electron carrier
14
within the inner mitochondrial membrane, is among activators of caspases, the central executioners during apoptosis. This little but powerful organelle is like a two edged sword. One compartment that is enclosing two opposing features – it is the powerhouse of the cell and its arsenal, too.
Most of the energy in animal cells is produced during oxidative phosphorylation in the mitochondria. This process occurs through passing electrons along a series of carrier molecules, called the electron transport chain. As earlier mentioned (see:
“Metabolism – the hub of biochemical activities”), electron carriers, such as NAD(P)H and FADH2, transduce their reducing equivalents to the enzymes of the electron transport chain. The electron transport chain incorporates four respiratory enzyme complexes arranged in a specific orientation in the inner mitochondrial membrane. The passage of electrons between these complexes is accompanied by pumping of protons across the membrane. In this content, the energy of electron flow is coupled to the pumping of protons across the inner mitochondrial membrane, which together produces an electrochemical gradient, the proton-motive force. The proton-motive force has two components: i) the transmembrane potential difference (ΔΨm, being in the range of 150-180 mV, negative inside), and ii) the transmembrane proton concentration gradient (ΔpH). According to the chemiosmotic model, proposed by Peter Mitchell, the proton- motive force is capable of doing work which is used by Fo-F1 ATP synthase to make ATP from ADP and Pi.
The mitochondrial Fo-F1 ATP synthase is a reversible molecular machine. It is able to synthesize, and also to hydrolyze ATP (Boyer, 2002). The directionality of ATP synthase is conducted by the proton-motive force (Feniouk and Yoshida, 2008). As mentioned above, the proton-motive force consists of two components, but in the presence of sufficiently high concentration of inorganic phosphate, as it is the case in vivo (Wu et al., 2007), ΔpH is very small (Chinopoulos et al., 2009), so the directionality of Fo-F1 ATP synthase is in general controlled by ΔΨm. The value of ΔΨm at which Fo-F1 ATP synthase shifts from ATP-forming to ATP-consuming is termed “reversal potential” (Erev_ATPase) (Chinopoulos et al., 2011a).
The newly synthesized ATP is transported to the cytosol by adenine nucleotide translocase in exchange for ADP. This anti-porter works with a 1:1 stoichiometry across the inner mitochondrial membrane, and to be more exact, it utilizes the free forms of
15
ADP3– and ATP4– (however, Fo-F1 ATP synthase utilizes the Mg2+ bound forms of ATP and ADP) (Senior et al., 2002). Together with ANT, phosphate translocase is also an essential membrane transporter of the inner mitochondrial membrane. It promotes symport of one Pi (i.e. H2PO4–
) and one H+ into the matrix. As well as the ATP-ADP exchange is driven by proton-motive force, the symport of Pi and H+ is also favored by transmembrane proton gradient. ANT is a reversible transporter, it can change the directionality. In mitochondria with compromised respiration, ATP could enter mitochondria by reverse operational ANT, and to be hydrolyzed by the Fo-F1 ATP synthase. This process can maintain an appreciable proton-motive force in the absence of a functional respiratory chain (Scott and Nicholls, 1980). The value of ΔΨm at which ANT shifts from ATP-export to ATP-import is termed “reversal potential” (Erev_ANT) (Metelkin et al., 2009).
In mitochondria with dis-functional ETC or in the absence of oxygen before becoming extramitochondrial ATP consumer there is one more possibility of ATP provision for reversal operating Fo-F1 ATP synthase. ATP may be synthetised by matrix substrate-level phosphorylation. A decrease in ΔΨm (a shift toward more positive values) due to ETC inhibition or to an increase in the inner membrane permeability stops ATP synthesis and switches to ATP consumption, leading to bioenergetic failure in cells. In the mitochondrial matrix, two reactions are capable of substrate-level phosphorylation: the mitochondrial phosphoenolpyruvate carboxykinase (PEPCK) and the succinate-CoA ligase. Mitochondrial PEPCK is thought to participate in the transfer of the phosphorylation potential from the matrix to cytosol and vice versa (Lambeth et al., 2004). Succinate-CoA ligase is a mitochondrial matrix enzyme that catalyses the reversible conversion of succinyl-CoA and ADP or GDP to succinate and ATP or GTP (Johnson et al., 1998a). The enzyme is a heterodimer, being composed of an invariant α subunit encoded by SUCLG1, and a substrate-specific β subunit, encoded by either SUCLA2 or SUCLG2. This dimer combination results in either an ADP-forming SUCL (A-SUCL, EC 6.2.1.5) or a GDP-forming SUCL (G-SUCL, EC 6.2.1.4). The β subunit thus determines the substrate specificity of the enzyme. Both β subunits are widely expressed in human tissues, with SUCLG2 predominantly expressed in anabolic tissues such as liver, and SUCLA2 in catabolic tissues such as brain and skeletal muscle (Johnson et al., 1998a; Lambeth et al., 2004). SUCLG1 is ubiquitously expressed. The
16
widespread expression of both A-SUCL and G-SUCL in a wide range of animal species has been firmly established (Johnson et al., 1998a,b), and both enzymes are located in the matrix ofmitochondria, where they could participate in the citric acidcycle.
The previous works of our group showed that when the ETC compromised and Fo-F1 ATP synthase reverses, the mitochondrial membrane potential is still maintained, albeit at decreased levels. Even though the Fo-F1 ATP synthase reverses, and pumps protons out of the matrix at the expense of ATP, ANT can function in forward mode as long as the matrix substrate-level phosphorylation is operational (Chinopoulos et al., 2010).
The directionality of Fo-F1 ATP synthase is controlled by ΔΨm, while Fo-F1 ATP synthase itself is controlls the matrix ATP and ADP levels (Feniouk and Yoshida, 2008). Using thermodynamic assumptions and computer modeling (Chinopoulos et al., 2010), a so called “B space” (Figure 2) has been revealed within which Fo-F1 ATP synthase reverses its directionality (i.e., hydrolysis ATP), and still ANT operates in forward mode (i.e., exports ATP from the matrix). For maintaining this “B space” it is known that it requires ATP supply generated by substrate-level phosphorylation, a mechanism that is independent from proton-motive force. Succinate-CoA ligase does not require oxygen for ATP production, and it is even activated during hypoxia (Phillips et al., 2009).
Experiments on in situ and isolated mitochondria also supported the conclusion from computation estimations (Chinopoulos et al., 2010), and it is obvious that ATP generated in reaction catalyzed by succinate-CoA ligase prevents mitochondria to become consumer of cytosolic ATP in the absence of oxygen or when the electron transport chain is impaired. Matrix substrate-level phosphorylation could be endogenous rescue machinery which, even though the mitochondria are depolarized, can maintain the ΔΨm at suboptimal level. Mitochondria could keep their integrity as long as matrix substrate-level phosphorylation is in operation, and provide ATP for the reversible reaction of the Fo-F1 ATP synthase, but prevents ANT to reverse.
17
Figure 2. Computational estimation of Erev_ANT and Erev_ATPase as a function of [ATP]in/[ADP]in ratio. Black line represents the Erev_ATPase, white line the Erev_ANT. A space: Fo-F1 ATP synthase forward, ANT forward mode.
B space: Fo-F1 ATP synthase reversed, ANT forward mode.
C space: Fo-F1 ATP synthase reversed, ANT reversed mode.
D space: Fo-F1 ATP synthase forward, ANT reversed mode – it is a theoretical consideration, and has never been experimentally reproduced.
SLP is operational in “B space”, and may or may not operate in “A/C/D space”. Blue arrows represent the reversible transition between the spaces.
(Reproduced from: Chinopoulos, 2011a)
The pioneering findings of our group showed that, in progressively depolarizing mitochondria, the ATP synthase and ANT may change directionality independently from one another (Chinopoulos et al., 2010). It was also demonstrated that when the electron transport chain is dysfunctional, provision of succinyl-CoA by the α- ketoglutarate dehydrogenase complex (KGDHC) is crucial for maintaining the functional succinate-CoA ligase yielding ATP (Kiss et al., 2013). In the irreversible reaction catalyzed by KGDHC, α-ketoglutarate, CoASH and NAD+ is converted to succinyl-CoA, NADH and CO2. After these findings the question was: What is the source of NAD+ when the ETC is dysfunctional? It is common knowledge that NADH generated in the citric acid cycle is oxidized by complex I, and at the same time NAD+
18
is recycled. In the absence of oxygen or when complexes are not functional, an excess of NADH in the matrix is expected. We presented that mitochondrial diaphorases and a finite pool of oxidizable quinones are the source of NAD+ generated within the mitochondrial matrix during respiratory arrest caused by anoxia or dysfunctional ETC (Kiss et al., 2014). A diaphorase activity is attributed to a flavoprotein known as DT- diaphorase or NAD(P)H:quinone oxidoreductase (Ernster, 1958a,b). It appears to be a 2-electron transfer flavoprotein, which catalyzes the conversion of quinones into hydroquinones.
These finding were of importance to prove the relevance and functionality of SLP in mitochondria with compromised ETC. These ground experiments were of necessity before we considered the effect of itaconate on SLP.
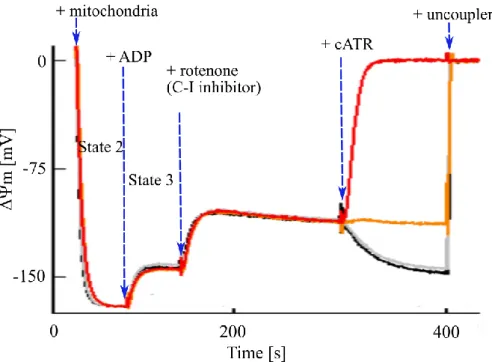
In experiments with mitochondria to point out the relevance of SLP the so called
“biosensor test” was used (Figure 3). To place respiration-impaired mitochondria withing space B or space C, its ΔΨm, matrix ATP/ADP ratio, reversal potential of Fo-F1 ATP synthase and ANT are needed. To determine these parameters it is an extremely challenging experimental undertaking. The reversal potential of Fo-F1 ATP synthase is more negative than that of the ANT (Chinopoulos et al., 2010). This means that whenever the ANT reverses, the ATP synthase works in reverse, too. In experiments insetead of measuring ΔΨm, matrix ATP/ADP ratio, Erev_ANT and Erev_ATPase at any given time, it is simpler and equally informative to examine the effect of ANT inhibitors on ΔΨm (estimated by fluorescence quenching of a cationic dye, which accumulates inside energized mitochondria) during ADP-induced respiration. Since one molecule of ATP4–
is exchanged for one molecule of ADP3– by ANT, the exchange is electrogenic (Klingenberg, 2008). Therefore, during the forward mode of ANT (i.e., transporting ADP3– into and ATP4– out of the matrix), abolition of its operation by a specific inhibitor leads to an increase in ΔΨm (i.e., repolarization); wheres during the reverse mode of ANT (i.e., transporting ATP4– into and ADP3– out of the matrix), the same condition leads to loss of ΔΨm (i.e., depolarization). This “biosensor test” − the effect of ANT inhibitor on a safranin O or TMRM fluorescence reflecting ΔΨm − was successfully used in addressing the directionality of ANT during respiratory inhibition (Chinopoulos et al., 2010). By determining the directionality of ANT, at the same time, we could also decide on the operation or not of SLP.
19
Figure 3. Schematic representation of the “biosensor test”. Fluorescence quenching of a cationic dye (safranin O), which accumulates inside energized mitochondria, reflects ΔΨm. State 2: mitochondrial polarization by substrates (substrates always present in the medium before addition of mitochondria). State 3: ADP-induced depolarization.
After addition of complex I inhibitor, rotenone, the ETC is compromised, and ΔΨm is shifted toward more positive values, i.e., it is depolarized. During ETC arrest ΔΨm is supported by reversal of the ANT and/or reversal of Fo-F1 ATP synthase. Addition of ANT inhibitor, carboxyatractyloside (cATR), can induce: repolarization (black trace) – implying forward operation of ANT, depolarization (red trace) – implying reversal operation of ANT, no change (orange trace) – implying ANT operating at its thermodynamic equilibrium. Addition of uncoupler (e.g. SF 6847) maximally depolarizes mitochondria, and it is used for ΔΨm calibration.
2.5. Itaconic acid
Itaconic acid (2-methylidenebutanedioic acid, methylenesuccinic acid, CAS registry number: 97-65-4) is an unsaturated dicarboxylic acid. This organic compound plays an important role in immunity as well as in industrial biotechnology. Itaconic acid is produced from cis-aconitate by the extramitochondrial cis-aconitate decarboxylase, an enzyme encoded by the cad1 gene in fungus Aspergillus terreus (Steiger et al., 2013).
20
Itaconic acid has a high potential as a biochemical compound, because the double bond of its methylene group makes it useful for polymer synthesis. It can be used as a monomer for the production of plethora of products including resins, plastics, paints and synthetic fibers (Okabe et al., 2009; Willke and Vorlop, 2001; Steiger et al., 2013), reviewed in (Cordes et al., 2015). Itaconic acid has been identified in a small number of metabolomic studies of mammalian tissue specimens, such as activated macrophages (Sugimoto et al., 2012), Mycobacterium tuberculosis-infected lung tissue (Shin et al., 2011), urine and serum samples (Kvitvang et al., 2011), and glioblastomas (Wibom et al., 2010). More recently, it has been shown that human and mouse macrophages produce itaconic acid from cis-aconitate through an enzyme exhibiting cis-aconitate decarboxylase activity, coded by the cis-aconitate decarboxylase 1 gene (previous name: immunoresponsive gene 1, Irg1) (Michelucci et al., 2013).
Some of the key features of itaconic acid are:
It is of high interest to industry for its use in polymer synthesis − it is biotechnologically produced by the fungus Aspergillus terreus.
It is generated through decarboxylation of the TCA cycle intermediate cis- aconitic acid by CAD in Aspergillus terreus and Acod1 in mammals.
It plays an important role during inflammation and provides antimicrobial effects in macrophages.
2.5.1. Synthesis of itaconic acid
The first discoveries about itaconic acid root back into 1836. During distillation of citric acid Baup observed the formation of an unknown compound (Baup, 1836). A few years later the same substance was synthesized by decarboxylation of cis-aconitic acid. Crasso, the scientist who did the experiment, introduced the synthesized component as itaconic acid. The name itaconic acid represents an anagram of cis- aconitic acid (Turner, 1840; Cordes et al., 2015). Almost a century later, for the first time, Kinoshita found that itaconic acid was produced in vivo. He recognized that a filamentous fungus – which he descriptively named as Aspergillus itaconicus – was able to synthesize itaconic acid (Kinoshita, 1931; Steiger et al., 2013). To date it is known that, beside Aspergillus species, like Aspergillus itaconicus and Aspergillus terreus (Calam et al., 1939), itaconic acid is produced also by other fungi like Ustilago zeae
21
(Haskins et al., 1955) and Ustilago maydis (Haskins et al., 1955; Klement et al., 2012), as well as the yeast Candida sp. (Tabuchi et al., 1981) and Rhodotorula sp. (Kawamura et al., 1981). In a recent years, Sugimoto and coleagues (Sugimoto et al., 2012) discovered itaconic acid synthesis in mammalian immune cells, too.
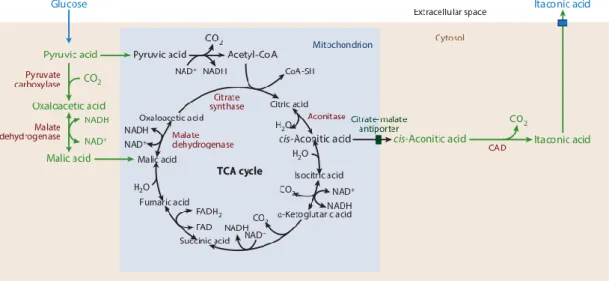
2.5.2. Compartmentalization of itaconi acid synthesis in Aspergillus terreus In 1957, Bentley and Thiessen proposed the itaconic acid formation pathway in fungus Aspergillus terreus (Bentley and Thiessen, 1957a,b). According to their hypothesis itaconic acid is formed from the citric acid cycle intermediate cis-aconitic acid by the the enzyme cis-aconitic acid decarboxylase, which is encoded by the gene cad1. Later, this pathway was confirmed by isotope tracing experiments with 14C and 13C labeled substrates (Bonnarme et al., 1995).
Figure 4. Compartmentalization of itaconic acid synthesis in Aspergillus terreus.
(Adopted from: Cordes et al., 2015)
Starting from a sugar substrate, as a carbon source for itaconic acid production, the fungus takes up glucose from the extracellular environment, and processes it via glycolysis to pyruvate in the cytosol (Figure 4). Here the pathway splits. Pyruvic acid can enter the tricarboxylic acid cycle in the mitochondria either via acetyl-CoA or malic acid. During first steps of citric acid cycle, citrate and cis-aconitate are formed. In Aspergillus terreus, CAD is localized in the cytosol, and consequently, it is the location of itaconic acid production, too. Taken it into account, transport of cis-aconitic acid
22
from mitochodria to the cytosol is required. This relocation is done by citrate-malate antiporter (Jaklisch et al, 1991). However, the exact transport mechanism is still unknown. As a final step in itaconic acid biosynthesis, a secretion mechanism for itaconic acid is required because Aspergillus terreus accumulates itaconic acid in the extracellular environment (Steiger et al., 2013). Potential transporters involved are not yet known. The notion that itaconic acid is secreted in large amounts by Aspergillus terreus calls on hypothesizing that the compound is not further metabolized by this fungus and may have other functions.
2.5.3. Industrial production of itaconic acid
The discovery of itaconic acid has been of growing interest for industry because it can be used as a starting material for chemical synthesis of polymers (Okabe et al., 2009; Yu et al., 2011). The chemical structure of itaconic acid reveals its reactive methylene group which allows a self-polymerization to polyitaconic acid (Steiger et al., 2013). Therefore, itaconic acid is a potential replacement for crude oil-based products, and it is industrially used as a precursor for plastic polymer synthesis as well as for resins, lattices and fibers (Willke and Vorlop, 2001; Okabe et al., 2009; El-Imam and Du, 2014). Although the levels of itaconic acid which were reached with Aspergillus terreus are about 85 g/L, further optimizations are required by industrial companies.
Compared to the industrial production of citric acid by Aspergillus niger where titers are measured about 200 g/L, the itaconic acid titers in industrial production are still low.
Toward efficient itaconic acid production certain drawbacks of using filamentous fungi should be sort out.
The production of itaconic acid requires continuous oxygen supply. The process is strictly aerobic because low oxygen concentrations damage the mycelia and affect fungal metabolism (Gyamerah, 1995; Willke and Vorlop, 2001). This oxygen sensitivity could be reduced by gene engineered Aspergillus terreus. The hemoglobin gene of the aerobic bacterium Vitreoscilla expressed in Aspergillus terreus showed increased itaconic acid formation (Lin et al., 2004). Furthermore, the genetically modified strains showed a better recovery upon disturbed oxygen supply.
It has been reported that itaconic acid itself inhibits the grow of Aspergillus terreus and, in turn, decreases the itaconic acid production. This kind of suppression of
23
itaconic acid production could be overcome by using mutant strains that are itaconic acid resistant (Yahiro et al., 1995).
Another possible strategy to increase itaconic acid yields is in taking advantage of another host organism. As mentioned above, Aspergillus niger is known to produce 200 g/L of citric acid, a potential precursor in itaconic acid synthesis. The only obstacle is that Aspergillus niger lacks cad1 gene. Although, after the cad1 gene of Aspergillus terreus was engineered into Aspergillus niger, still itaconic acid titers were low compared to the synthetised citric acid. Many-fold increase in itaconic acid production was detected only after overexpression of mitochondrial transporter in combination with a plasma membrane transporter (Van der Straat et al., 2014).
Despite the efforts to optimize itaconic acid yields Aspergillus terreus is still the dominant production host.
2.5.4. Itaconic acid as an antimicrobial agent
Itaconic acid, together with other inflammatory metabolites and cytokines, performs an efficient immune response. On the contrary, invading pathogens aren't that naïve, and have developed a defense strategy against itaconic acid, degrading and detoxifying its antimicrobial effects (Ménage et al., 2014; Sasikaran et al., 2014).
Antimicrobial activity of itaconic acid is administered through action on pathogen metabolism (Figure 5). Modes of these actions are:
i) inhibition of isocitrate lyase, the key enzyme of the glyoxylate shunt, ii) inhibition of methylisocitrate lyase, the enzyme of 2-methylcitrate cycle, iii) inhibition of propionyl-CoA carboxylase, the enzyme of citramalate cycle.
The glyoxylate shunt allows many bacteria to utilize acetyl-CoA generating carbon sources such as fatty acids or cholesterol for biomass production under glucose- limiting conditions (Kumar R. 2009). As an example, Salmonella enterica and Mycobacterium tuberculosis depend on this metabolic mechanism during persistence within macrophages (McKinney et al., 2000; Fang et al., 2005; Kumar R. 2009).
24
Figure 5. Antimicrobial activity of itaconic acid. Action of itaconic acid on pathogen metabolism. In blue: eznyzmes inhibited by itaconic acid; in red: inhibited biochemical pathways. (Adopted from: Cordes et al., 2015)
The glyoxylate shunt, like the citric acid cycle, begins with the condensation of acetyl-CoA and oxaloacetate to form citrate, which is then isomerized to isocitric acid.
Instead of being decarboxylated, isocitric acid is converted by isocitrate lyase into succinic acid and glyoxylate. In the next step malic acid is produced by malate synthase condensing acetyl-CoA with glyoxylate (Sharma et al., 2000; Dunn et al., 2009). In the final step of glyoxylate shunt, malate is oxidized to oxaloacetate, as in the citric acid cycle.
Itaconic acid inhibits isocitrate lyase, the key enzyme of glyoxylate shunt. It functions as a competitive inhibitor, competing with succinic acid (McFadden et al., 1971), presumably by binding to the active site of the enzyme. The glyoxylate shunt with its exclusive presence in microbes, offers possibility for a potential drug target (Muñoz-Elías and McKinney, 2006).
In addition to isocitrate lyase, itaconic acid also inhibits other enzymes of invading pathogens. When glucose availability is limited, invading pathogens, such as Mycobacterium tuberculosis, use cholesterol from the host as a carbon source (Pandey
25
and Sassetti, 2008; Russell et al., 2010). During cholesterol degradation, in the last step, propionyl-CoA is produced. Since propionyl-CoA is toxic for the pathogens (Berg et al., 2002; Upton and McKinney, 2007), they detoxify this compound to succinic acid and pyruvic acid in the 2-methylcitrate cycle. The key enzyme of this cycle is methylisocitrate lyase – an enzyzme very similar to isocitrate lyase –, which converts methylisocitric acid to pyruvic acid and succinic acid, and is also inhibited by itaconic acid (Van der Geize et al., 2007). Itaconic acid exhibits a dual inhibition on bacterial enzymes: first, inhibition of methylisocitrate lyase activity cancels detoxification of propionic acid; second, the inhibition of isocitrate lyase leads to the inhibiton of the bacterial biomass generation through the glyoxylate shunt. This means that itaconic acid plays a prominent role as an endogenous antimicrobial compound (Michelucci et al., 2013).
Beside the above-mentioned pathways – glyoxylate shunt and 2-methylcitrate cycle – itaconic acid also inhibits propionyl-CoA carboxylase, an enzyme that carboxylizes propioyl-CoA to methylmalonyl-CoA in the citramalate cycle (Berg et al., 2002). This pathway is proposed to the proteobacterium Rhodospirillum rubrum, which lacks isocitrate lyase activity. The inhibition of propionyl-CoA carboxylase by itaconic acid leads to an inhibition of acetic acid and propionic acid assimilation in cell extracts of this bacterium.
2.5.5. Itaconic acid in mammalian cells
Strelko and colleagues reported about itaconic acid as a novel mammalian metabolite that most likely plays a role in macrophages during immune responses (Strelko et al., 2011). Another group also discovered itaconic acid in the extracellular environment of mammalian cells – as a metabolite of LPS-activated macrophages –, but did not discuss its biological relevance (Sugimoto et al., 2012).
Following the discovery of itaconic acid in mammalian immune cells, its biosynthesis pathway was also revealed. Experminets using LPS-activated macrophages, incubated with uniformly labeled [U-13 C6]glucose, revealed that mammalian cells produce itaconic acid through decarboxylation of the TCA cycle intermediate cis-aconitic acid (Strelko et al., 2011; Michelucci et al., 2013). This is the same metabolic pathway as described for Aspergillus terreus. Applying sequence
26
homology search for Aspergillus CAD, the Acod1 enzyme was revealed, as a CAD homologue in mammals (Michelucci et al., 2013).
Acod1 upregulation was observed in different type of cells: murine macrophages infected with Mycobacteria (Basler et al., 2006) or Salmonella enterica (Michelucci et al., 2013) as well as in LPS-stimulated bone marrow-derived dendritic cells (Hoshino et al., 2002); it was detected in human fetal peripheral blood mononuclear cells (PBMCs) and LPS-stimulated adult PBMCs (Xiao et al., 2011) as well as in endotoxin-activated PBMC-derived macrophages (Michelucci et al., 2013); murine microglial cells – macrophage analogues of the central nervous system –, performed Acod1 upregulation after being infected in vivo with Toxoplasma gondii (Li et al., 2006) and in vitro after LPS stimulation (Thomas et al., 2006); in the lung tissue of mice during the early phase of influenza A virus infection (Preusse et al., 2013) and in chickens infected with Marek’s disease (Smith et al., 2011). Increased Acod1 expression was detected after infection with neurotropic viruses. In this analysis, Acod1 expression was detected in granule cell neurons of the cerebellum and in cortical neurons from the cerebral cortex (Cho et al., 2013). Independently from bacterial or viral infections, an upregulation of Acod1 expression has been detected in the early events leading to implantation in the pregnant uterus (Terakawa et al., 2011).
Experiments with MitoTracker Green FM, a fluorescent compound that accumulates specifically in mitochondria, revealed that Acod1 is localized to the mitochondria (Degrandi et al., 2009). It is in contrast to its localization in Aspergillus terreus, where the enzyme synthesizing itaconate, CAD, is placed to the cytosol.
Although the applications of itaconic acid and its derivatives extend to dental, ophthalmic, and drug delivery fields (Okabe et al., 2009), and in complexation with benzylammonium it is used to prepare water soluble coating for food packaging to reduce bacteria contamination, it does not enter the food chain to an appreciable degree.
Still, it was shown to be extensively metabolized when administered per os to cats, dogs and murine animals (Booth et al., 1952; Adler et al., 1957).
There are evidences about itaconic acid affecting energy metabolism. Itaconic acid inhibits rat liver phosphofructokinase-2, a regulatory enzyme of the glycolytic pathway. Due to the inhibition of the glycolytic pathway, it has been shown that itaconic acid suppresses the synthesis of fatty acids from glucose. In rats, an itaconic acid-
27
enriched diet leads to a reduced visceral fat accumulation; therefore, itaconic acid could play a role in controlling obesity (Sakai et al., 2004). In addition to the inhibition of glycolysis, itaconic acid has an inhibitory effect on succinate dehydrogenase (SDH) (Booth et al., 1952; Dervartanian and Veege; 1964). This enzyme complex binds to the inner mitochondrial membrane and oxidizes succinic acid to fumaric acid as part of the TCA cycle and in turn reduces FAD to FADH2, which feeds into the electron transport chain. Apart from SDH inhibition, itaconate could contribute to the accumulation of succinic acid. In the review by Mills and O’Neill, two other possible sources are discussed: i) the first source is an increased glutamine uptake in LPS-activated macrophages and subsequent anaplerosis of α-ketoglutaric acid into the TCA cycle, which may lead to increased succinic acid production; ii) the second source is based on γ-aminobutyric acid (GABA) production; GABA can then be a substrate for succinic acid synthesis via transamination (Mills and O’Neill, 2014).
2.5.6. The pathway of itaconate metabolism in murine liver mitochondria More than 50 years ago it was reported, by Adler and colleagues that exogenously added itaconic acid to isolated mitochondria is oxidized as most members of the citric acid cycle (Adler et al., 1957). The same group elucidated the pathway of itaconic acid metabolism towards pyruvate and acetyl-CoA, (Wang et al., 1961);
however, at that time, the identity of succinate-CoA ligase (referred to as “succinate- activating enzyme”, or “P enzyme”), and its role in substrate-level phosphorylation was not yet revealed (Sanadi et al., 1954; Labbe et al., 1965; Ottaway et al., 1981).
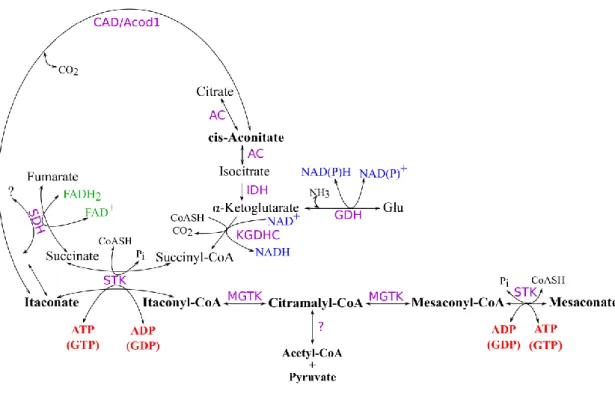
Based on these earlier findings we merged itaconic acid metabolism with the part of TCA cycle and related metabolic reactions that involve SLP. As shown in Figure 6, itaconate (shown in bold) arises from cis-aconitate, an intermediate of the aconitase reaction, but only in tissues where cis-aconitate decarboxylase is expressed (Xiao et al., 2011). In the fungus Aspergillus terreus, CAD is an extramitochondrial protein (Steiger et al., 2013); in mammalian cells, an iron-responsive element binding protein exhibiting aconitase activity has been found in the cytosol (Haile et al., 1992), however, in cells of macrophage lineage (where itaconate is formed) cis-aconitate decarboxylase associates to mitochondria (Degrandi et al., 2009). cis-aconitate may arise from either isocitrate or citrate, since the reaction catalyzed by aconitase is reversible. Exogenously
28
administered itaconate would be further metabolized only after entry into the mitochondria. Such entry is expected to occur through the dicarboxylate carrier (SLC25A10), although, to the best of our knowledge, this has not been verified.
Figure 6. Schematic representation of itaconate and mesaconate metabolism in relation to a segment of the TCA cycle and reactions involved in SLP. SDH: succinate dehydrogenase; STK: succinate thiokinase (succinate-CoA ligase); KGDHC: α- ketoglutarate dehydrogenase complex; GDH: glutamate dehydrogenase; MGTK:
methylglutaconase (methylglutaconyl-CoA hydratase); CAD/Acod1: cis-aconitate decarboxylase; AC: aconitase (aconitate hydratase); IDH: isocitrate dehydrogenase.
In the mitochondrial matrix, itaconate could weakly inhibit succinate dehydrogenase in a competitive manner (Booth et al., 1952; Adler et al., 1957; Haile et al., 1992; Xiao et al., 2011). The work of Adler et al. showed that itaconate would also become oxidatively catabolized in the citric acid cycle in a malonate-sensitive manner (Adler et al., 1957), however, due to the lack of hydrogen on the α-carbon of itaconate, a double bond cannot be formed; therefore it cannot be processed by SDH as such. Two
29
possibilities by which itaconate is converted to products suitable for oxidation by the SDH could be envisaged: i) saturation of itaconate to methylsuccinate is the most likely scenario, in view of the fact that methylsuccinate is known to be processed by SDH (Franke et al., 1957; Dervartanian and Veeger, 1964); ii) itaconate hydroxylation yielding hydroxymethyl-succinate is also a viable theoretical possibility, but to the best of our knowledge this has not been addressed. A possible decarboxylation or isomerisation of itaconate would yield products that cannot be further metabolized by SDH.
On the other hand, in acetone extracts of murine liver mitochondria, itaconate metabolism was shown to occur extensively in the presence of ATP, Mg2+ and CoASH (Adler et al., 1957). Furthermore, in intact liver mitochondria and in the presence of ATP and Mg2+ but absence of oxygen, itaconate became thioesterified to itaconyl-CoA which was later converted to citramalyl-CoA through methylglutaconyl-CoA hydratase (also known as methylglutaconase, MGTK) (Abramov and Duchen, 2005). Citramalyl- CoA could be further converted to either mesaconyl-CoA by MGTK, or to acetyl-CoA and pyruvate (Adler et al., 1957; Wang, S. F. et al., 1961). Mesaconyl-CoA can lose the CoASH in a reaction catalyzed by succinate-CoA ligase, forming mesaconate. This also means that mesaconate would exhibit similar effects on SLP as itaconate; however, mesaconate is much less potent than itaconate (Adler et al., 1957), probably because of a lower affinity of succinate-CoA ligase for mesaconate than for itaconate.
30 3. OBJECTIVES
In one of the earlier works, our group highlighted the critical importance of matrix substrate-level phosphorylation during respiratory arrest (Chinopoulos et al., 2010). In the absence of oxygen or when the electron transport chain is impaired, matrix substrate-level phosphorylation is the only means of high-energy phosphates production in mitochondria. Mitochondrial substrate-level phosphorylation is almost exclusively attributable to an citric acid cycle enzyme, succinate-CoA ligase, which catalyzes the reversible conversion of succinyl-CoA and ADP (or GDP) to coenzyme A, succinate and ATP (or GTP) (Johnson et al., 1998a). Thanks to matrix substrate-level phosphorylation, even though the electron transport chain is compromised and Fo-F1 ATP synthase reverses – instead of ATP synthesis it hydrolysis ATP –, the mitochondrial membrane potential is maintained, albeit at decreased levels (Chinopoulos et al., 2010). This process prevents mitochondria from becoming cytosolic ATP consumers (Chinopoulos, 2011a,b).
We assumed that itaconic acid exerts bioenergetic effects on adenine (or guanine) nucleotide production in the mitochondrial matrix via succinate-CoA ligase.
We set as an aim:
to investigate specific bioenergetic effects of increased itaconate production mediated by LPS-induced stimulation of cis-aconitate decarboxylase 1 in macrophages;
to investigate the dose-dependent effect of exogenously added itaconate to isolated liver mitochondria, under defined metabolic conditions to reveal the mechanism(s) of itaconate on SLP.
31 4. METHODS
4.1. Animals
Mice were of C57Bl/6 background. The animals used in our study were of both sexes and between 2 and 3 months of age. Mice were housed in a room maintained at 20-22°C on a 12 hours light-dark cycle with food and water available ad libitum. All experiments were approved by the Animal Care and Use Committee of the Semmelweis University (Egyetemi Állatkísérleti Bizottság).
4.2. Isolation of mitochondria
Liver mitochondria from all animals were isolated as described in Tyler and Gonze, 1967, with minor modifications detailed in Chinopoulos et al., 2010. Following cervical dislocation, the liver was rapidly removed, minced, washed and homogenized using a glass/PTFE Potter-Elvehjem tissue grinder in ice-cold isolation buffer containing, in mM: mannitol 225, sucrose 75, HEPES 5 (free acid), EGTA 1 and 1 mg/ml bovine serum albumin (BSA, essentially fatty acid-free), pH 7.4 adjusted with Trizma® (Sigma-Aldrich, St. Louis, MO, USA). The homogenate was centrifuged at 3,000 g for 10 min; the upper fatty layer of the supernatant was aspirated and the pellet was discarded, then the remaining supernatant was centrifuged at 10,000 g for 10 min;
this step was repeated once. At the end of the third centrifugation, the supernatant was discarded, and the pellet was suspended in 100 ml of the same buffer with 0.1 mM EGTA.
Protein concentration was determined using the bicinchoninic acid assay, and calibrated using bovine serum standards (Smith et al., 1985) using a Tecan Infinite®
200 PRO series plate reader (Tecan Deutschland GmbH, Crailsheim, Germany). Yields were typically 0.4 ml of ~60 mg/ml per mouse liver.
4.3. Determination of membrane potential (ΔΨm) in isolated liver mitochondria ΔΨm of isolated mitochondria (1 mg per 2 ml of medium containing, in mM:
KCl 8, K-gluconate 110, NaCl 10, HEPES 10, KH2PO4 10, EGTA 0.005, mannitol 10, MgCl2 1, substrates as indicated in the legends, 0.5 mg/ml bovine serum albumin [fatty acid-free], pH 7.25 and 5 µM safranine O) was estimated fluorimetrically with safranine O (Åkerman and Wikström, 1976). Traces obtained from mitochondria were calibrated to millivolts by voltage-fluorescence calibration curve. To this end, safranine O
32
fluorescence was recorded in the presence of 2 nM valinomycin and stepwise increasing [K+] (in the 0.2-120 mM range), which allowed calculation of ΔΨm by the Nernst equation, assuming a matrix [K+] = 120 mM (Chinopoulos et al., 2010). Fluorescence was recorded in a Hitachi F-7000 spectrofluorimeter (Hitachi High Technologies, Maidenhead, UK) at a 5 Hz acquisition rate, using 495 and 585 nm excitation and emission wavelengths, respectively, or at a 1 Hz rate using the O2k-Fluorescence LED2-Module of the Oxygraph-2k (Oroboros Instruments, Innsbruck, Austria) equipped with an LED exhibiting a wavelength maximum of 465 ± 25 nm (current for light intensity adjusted to 2 mA, i.e., level 4) and an <505 nm short-pass excitation filter (dye-based, filter set Safranin). Emitted light was detected by a photodiode (range of sensitivity: 350-700 nm), through an >560 nm longpass emission filter (dye-based).
Experiments were performed at 37oC. Safranine O is known to exert adverse effects on mitochondria if used at sufficiently high concentrations (i.e. above 5 μM, discussed elsewhere) (Kiss et al., 2014). However, for optimal conversion of the fluorescence signal to ΔΨm, a concentration of 5 μM safranine O is required, even if it leads to diminishment of the respiratory control ratio by approximately one unit (not shown).
Furthermore, the non-specific binding component of safranine O to mitochondria (dictated by the mitochondria/safranine O ratio) was within 10% of the total safranine O fluorescence signal, estimated by the increase in fluorescence caused by the addition of a detergent to completely depolarized mitochondria (not shown). As such, it was accounted for, during the calibration of the fluorescence signal to ΔΨm.
4.4. Mitochondrial respiration
Oxygen consumption was estimated polarographically using an Oxygraph-2k.
Liver mitochondria (2 mg) were suspended in 4 ml incubation medium, the composition of which was identical to that for ΔΨm determination. Experiments were performed at 37oC. Oxygen concentration and oxygen flux (pmol·s−1·mg−1; negative time derivative of oxygen concentration, divided by mitochondrial mass per volume and corrected for instrumental background oxygen flux arising from oxygen consumption of the oxygen sensor and back-diffusion into the chamber) were recorded using DatLab software (Oroboros Instruments).
33 4.5. Cell cultures
BMDMs preparation: Bone marrow cells from mice were first cultured in Minimum Essential Medium α (Life Technologies, Carlsbad, CA, USA) complemented with 10% fetal bovine serum (Life Technologies), 2 mM L-glutamine (Sigma-Aldrich, St. Louis, MO, USA), 1% penicillin/streptomycin (Sigma) and 10 mM HEPES in the presence of 10 ng/ml mouse M-CSF (macrophage colony-stimulating factor) (PeproTech EC Ltd., London, UK). After 2 days, non-adherent cells were plated on 9 cm diameter petri plates (Gosselin SAS, France) at a density of 5-10×106 cells/plate and cultured in the same medium but M-CSF was supplied as a 10% conditioned medium from CMG14-12 cells. Medium/cytokine was changed in every two days.
TIPMs preparation: Thioglycollate-induced peritoneal macrophages were obtained by lavage of the peritoneal cavity of C57BL/6 mice which were injected 3 days previously with 1 ml of a medium containing 4.38 mM sodium thioglycollate (Liofilchem, s.r.l., Abruzzi, Italy). The cells were plated and cultured similarly as for the BMDMs.
RAW-264.7 cells preparation: RAW-264.7 cells were cultured in RPMI 1640 medium containing L-glutamine (Lonza, Basel, Switzerland), supplemented with 10%
fetal bovine serum (Life Technologies) and 1% penicillin/streptomycin (Sigma). The medium was changed every 2 days. Cells were plated at either 250-500,000 cells/ml on 10 cm bacterial petri dishes (Bovimex, Székesfehérvár, Hungary) for Western blot analysis (see below), or at 30,000 or 90,000 cells/ml on 8-well chambered cover glass (Lab-Tek, Nalge Nunc, Penfield, NY, USA) for image analysis (see below). Eight hours after plating, fresh medium with or without ultrapurified LPS (InvivoGen, Toulouse, France) was added and the cells were cultured for additional 12 hours before cell lysis or imaging.
COS-7 cells preparation: COS-7 cells were grown on 175 cm2 flasks in DMEM with glutamine, 10% FCS and 1% streptomycin-penicillin. On reaching confluence (15- 17×106 cells/flask), cultures were harvested by trypsinization and were transfected by electroporation according to the manufacturer’s instructions (Amaxa Inc., Gaithersburg, MD, USA).
![Figure 2. Computational estimation of E rev_ANT and E rev_ATPase as a function of [ATP]in/[ADP]in ratio](https://thumb-eu.123doks.com/thumbv2/9dokorg/1382412.114101/17.892.188.702.142.478/figure-computational-estimation-ant-atpase-function-atp-ratio.webp)