The evolving beta cell phenotype
Doctoral dissertation
Ágnes Jermendy MD
Semmelweis University
Doctoral School of Clinical Medicine
Supervisor: László Madácsy M.D., Ph.D., D.Sc.
Head of the Comprehensive Exam Committee:
András Szabó M.D., Ph.D., D.Sc.
Members of the Comprehensive Exam committee:
László Gerő M.D., Ph.D., D.Sc.
Tamás Halmos M.D., Ph.D., D.Sc.
Beáta Dérfalvi M.D., Ph.D.
Budapest
2014
Table of contents
Abbreviations 4
1 Introduction 7
1.1 Beta cell generation 10
1.1.1 Pdx1 13
1.1.2 Ngn3, Notch signaling, and Hes 13
1.1.3 NeuroD1/Beta2 14
1.1.4 Pax4 and Pax6 15
1.1.5 Nkx2.2 and Nkx6.1 15
1.1.6 MafA and MafB 16
1.2 Regulation of insulin gene expression 17
1.3 Glucose-stimulated insulin secretion 18
1.4 Immature glucose-stimulated insulin secretion 19 1.5 Role of transcription factors in the maturation of beta cells 21
1.6 Role of MafA in mature beta cell function 21
2 Aims (1-4) 23
3 Methods 25
3.1 Animals 25
3.2 Laser-capture microdissection 25
3.3 Microarray hybridization 26
3.4 Adenovirus infection 27
3.5 RNA extraction 28
3.6 Quantitative real-time PCR 28
3.7 Insulin secretion in vitro 29
3.8 Insulin secretion in vivo 29
3.9 Western blot analysis 30
3.10 Immunostaining 30
3.11 Data analysis 31
4 Results 32
5 Discussion 62
6 Conclusions 71
7 Summary 72
8 Összefoglalás 74
9 References 76
10 Bibliography of the candidate‟s publications 90
10.1 Publications related to the thesis 90
10.2 Publications not related to the present thesis 90
11 Acknowledgements 93
Abbreviations
AdDN-MafA: adenovirus dominant-negative MafA AdGFP: adenovirus GFP
AdNeuroD1: adenovirus NeuroD1 AdPdx1: adenovirus Pdx1
ANOVA: analysis of variance Arg: arginine
Arx: aristaless related homeobox ATP: adenosine triphosphate bHLH: basic helix-loop-helix
Cav1.2, Cav1.3: voltage-gated calcium channel alpha 1C, 1D subunit cDNA: complimentary DNA
CDS: coding sequence CMV: cytomegalovirus Cox: cytochrome c oxidase
Cpt: carnitine-palmitoyl transferase DAPI: 4'-6-Diamidino-2-phenylindole
DAVID: Database for Annotation, Visualization and Integrated Discovery dChip: DNA-Chip analyser
dNTP: deoxyribonucleotide triphosphate E47: E protein 47
EST: expressed sequence tag FBS: fetal bovine serum FC: fold change
Foxa2: forkhead box A2 GFP: green fluorescent protein GK: Goto-Kakizaki rat
Gln: glutamine
Glp1r: glucagon-like peptide 1 receptor Glut2: glucose transporter 2
Got: glutamine-oxalacetate transferase
Gpd: glycerol-3-phosphate dehydrogenase GSIS: glucose-stimulated insulin secretion Hes: hairy and enhancer of split
HSV: herpes simplex virus INS-1: insulinoma 1
IPGTT: intraperitoneal glucose tolerance test Isl1: islet 1
KCl: potassium chloride
Kir6.2: potassium inwardly-rectifying channel KRBH: Krebs-Ringer bicarbonate buffer LCB: lower confidence boundary
LCM: laser capture microdissection Leu: leucine
LSM: laser scanning microscope
MafA: musculoaponeurotic fibrosarcoma oncogene homolog A MafB: musculoaponeurotic fibrosarcoma oncogene homolog B Mdh: malate dehydrogenase
Me: malic enzyme
MODY: mature onset diabetes in young mRNA: messenger RNA
NADH: nicotinamide adenine dinucleotide
NADPH: nicotinamide adenine dinucleotide phosphate Nd: NADH dehydrogenase
NeuroD1: neurogenic differentiation 1 Ngn3: neurogenin 3
Nkx2.2, Nkx6.1: NK2 homeobox 2, NK6 homeobox 1 P: postnatal day
Pax4, Pax6: paired box 4, 6 PBS: phosphate buffered saline Pc: pyruvate carboxylase
Pcsk1: proprotein convertase subtilisin/kexin type 1 Pdx1: pancreatic and duodenal homeobox 1
PK, PKM, PKLR: pyruvate kinase, muscle, liver and red blood cell isoform PP: pancreatic polypeptide
Ptf1a: pancreas specific transcription factor 1a PVDF: polyvinylidene fluoride
qPCR: quantitative real-time polymerase chain reaction RBC: red blood cell
RPMI: Roswell Park Memorial Institute medium
RT-PCR: reverse transcription polymerase chain reaction
SDS-PAGE: sodium dodecyl sulfate polyacrylamide gel electrophoresis SEM: standard error of mean
Slc: solute carrier
Snap: synaptosomal-associated protein
SNARE: soluble N-ethylmaleimide-sensitive factor activating protein receptor Sox9: sex determining region Y box 9
Stx1a: syntaxin 1A
Stxbp: syntaxin binding protein Suclg: succinate-CoA ligase Sur1: sulfonylurea receptor 1
TBST: Tris buffered saline with Tween 20 UTR: untranslated region
Vamp: vesicle-associated membrane protein WKY: Wistar-Kyoto rat
1. Introduction
The very essence of diabetes is the failure of the insulin-producing pancreatic beta cells, either due to autoimmune destruction in type 1 diabetes or as a consequence of permanent glucotoxicity combined with peripheral insulin resistance in type 2 diabetes.
Diabetes mellitus in all its forms is a serious and costly disease and it has become a major health problem worldwide during the past few decades. People in many countries are becoming heavier, more sedentary and older [1, 2]; which increases the prevalence of type 2 diabetes [3] and could potentially result in a decline in life expectancy [4]. In addition, both type 1 and type 2 diabetes is complicated by severe end-organ damage in vital organs of the body including the retina, the kidney glomerulus and peripheral nerves, because of the long-term effects of chronic hyperglycaemia on the microvasculature [5]. People with diabetes are also at greater risk for developing artherosclerosis, affecting coronary, cerebrovascular and peripheral arterial circulation.
The exact relationship between chronic hyperglycaemia and macrovascular complications has not been clearly established, however the evidence is accumulating, as early strict glycemic control seems to generate a positive legacy in terms of cardiovascular outcomes [6-8]. Taken together, data strongly imply that normalization of blood glucose levels is essential early in the timecourse of diabetes in order to prevent or delay micro- and macrovascular complications. There has been an impressive improvement in the treatment of diabetes with higher standards of care, advances in insulin therapy and new medications; however, patients still need to receive a life-long therapy and too many patients develop complications, and face reduced life quality and expectancy. Therefore, the quest for cure still remains.
Much effort has been made to provide a curative therapy for both type 1 and type 2 diabetes by reconstituting endogenous insulin production with the replenishment of the insulin-producing pancreatic beta cells. Currently, the only forms of clinically available beta cell replacement are whole-organ pancreas transplantation and pancreatic islet transplantation. Whole-organ pancreas transplantation has three specific categories: the most commonly performed simultaneous pancreas-kidney transplantation (SPK), pancreas after kidney transplantation (PAK), and pancreas transplant alone (PTA). The
progress in the past years has been steady and the outcomes with pancreas transplantation are excellent [9] with satisfying results in terms of glycemic control.
Still, the procedure has many drawbacks. The surgery has about 4-5% mortality and patients have to receive a life-long immunosuppressive therapy [9]. In certain cases, however, whole pancreas transplantation could be a reasonable choice of treatment, for instance in patients with end-stage renal disease, or in patients with extreme lability of diabetes [10, 11].
Islet transplantation has been in the focus of attention since the late 1970‟s. It is a minimally invasive procedure, complications are rare, and in recent years rapid advances have been made in transplant technology. The goal of the transplantation is to infuse enough beta cells in form of islets to control blood glucose levels without insulin injections. The islets are isolated from cadaver pancreases by enzymatic digestion and mechanical stimuli. Isolated islets are then injected into the portal vein system to the liver with a catheter through a small surgical incision on the abdomen. Transplanted islets release insulin and ensure an almost physiologic glycemic control, however, long-term follow-up on islet recipients showed that graft function decreases over time.
Moreover, patients have to face a life-long immunosuppressive therapy. Beta cell failure after islet transplant is not fully understood, rejection as well as the deleterious effects of immunosuppressants, and suboptimal location of islet grafts may play role in the process. The landmark study in the islet transplantation field, the so-called Edmonton trial described a new protocol that uses a much larger amount of islet cells and a different type of immunosuppressive therapy. Scientists from Edmonton, Canada reported that seven out of seven patients who received islet cell transplants no longer needed to take insulin, and their blood glucose concentrations were normal a year after surgery [12]. The five year follow-up study on sixty-five patients has been published, and the results are still promising concerning to the control of blood glucose levels, but only 10% of the patients remained totally insulin-independent at 5 years [13]. These findings point to the need for further progress in improving islet engraftment, preserving islet function, and reducing toxic immunosuppression.
The application of this treatment is restricted by the very limited availability of donor tissue. Nowadays, due to the limited supply of cadaveric pancreases, the main
indication for islet transplantation is problematic hypoglycemia. Islet cells are obtained from cadavers and at least two cadavers are needed per transplant. Furthermore, as with any transplant, the islet cells must be immunologically compatible and freshly obtained. These requirements are difficult to meet, and the list of patients in wait for transplants far exceeds the available donor tissue.
The shortage of donor organs spurs the research into alternative means of generating beta cells. Essentially, a limitless supply of competent insulin-producing beta cells would be desirable, and cell-based therapies for both type 1 and type 2 diabetes are heavily investigated. Differentiated beta cells are difficult to culture and expand, whereas, stem or progenitor cells hold the capacity to multiply in culture and they are multipotent, in a sense that they are capable of forming cells from more than one germ layer. Presently, it is not clear whether it will be desirable to produce only beta cells for diabetes therapy or whether other types of pancreatic islet cells are also necessary.
Theoretically, insulin-secreting beta cells that are derived in vitro from stem or precursor cells under experimental conditions could be transplanted into patients.
Obviously, researchers have encountered many obstacles during the procedure of stem cell differentiation and the road to stem cell therapy will be long. However, this field of research holds the promise for a future curative therapy for diabetes.
Clearly, the understanding of beta cell development, and beta cell biology with detailed mechanisms of insulin transcription, translation and secretion is needed in order to provide better treatment and hopefully, one day, a cure for patients with diabetes. Over the past few decades, beta cells have been studied extensively. Most research has focused on the development of the pancreatic beta cells, and on the regulation and molecular biology of insulin synthesis and release. Consequently, many features of beta cell biology are now better understood, and a detailed description of the current knowledge is provided below. However, there are many aspects of beta cell biology yet to be described, and the current thesis is aimed at investigating the natural course of beta cell maturation and phenotypic changes and impairment in diabetic conditions.
1.1 Beta cell generation
A beta cell is defined by its ability to store large amounts of insulin and to secrete it in a regulated manner in response to a demand, such as glucose stimulation [14]. There are different approaches to obtain functional, insulin-producing cells from various types of progenitor cells. The possible tissue sources for generating beta cells include (1) fetal tissue {(a) human embryonic stem cells [15, 16], and (b) umbilical cord blood for mesenchymal stromal cells [17, 18]}, and (2) adult tissue {(c) induced pluripotent stem cells from human somatic cells [18], (d) bone marrow-derived mesenchymal stromal cells [19], (e) organ specific stem or progenitor cells such as oval cells [20], (f) duct epithelial cells [21], (g) acinar cells [22] and (h) liver cells [23, 24]}. Early attempts to generate beta cells directly from embryonic stem cells or other cell sources were successful in producing insulin containing cells [25-27], however, these cells were not true beta cells as they failed to secrete insulin in a regulated manner and they did not contain proinsulin-derived C-peptide [28, 29]. Later, it has become evident, that most effective protocols for the derivation of cells that express insulin recapitulate normal embryonic development, and such protocols using human embryonic stem cells yielded a cell population with more beta cell like characteristics [15]. Of note, these in vitro derived cells still fail to function like normal beta cells, and further differentiation is necessary in vivo (after implantation of beta-like cells into mice) in order to achieve a more mature beta cell phenotype [16].
The precise knowledge of transcription factors that regulate the development of the embryonic pancreas from the endoderm germ layer into a fully mature pancreas with endocrine and exocrine functions became essential. From mouse models we know that there are four distinct phases of beta cell generation [30]. The primary endocrine cell phase (before embryonic day 13 in mice) during which a few endocrine cells are generated, which are mostly glucagon positive, with few insulin positive cells, that contain low levels of insulin, co-express glucagon, and lack mature beta cell markers, including transcription factors Nkx6.1, MafA and Pdx1 (detailed description of beta cell transcription factors is provided below) [31]. The next phase is called secondary transition (embryonic days 13-18 in mice), during which beta cell neogenesis from
ductal epithelium (tubular progentiors) accelerates dramatically, and the newly formed cells are more similar to mature beta cells. The process of differentiation of progenitor cells down the endocrine linage is initiated by the transient expression of transcription factor Ngn3 [32]. Simultaneously, exocrine acinar cells start to differentiate, and the progenitor cells became restricted to the ducts. The third phase of beta cell formation starts shortly before birth and lasts through the first few weeks of postnatal life [33].
This period is characterized by a significant expansion in beta cells due to proliferation.
A similar expansion also occurs in human infants [34]. The final phase of beta cell generation occurs in adulthood, when replacement or expansion of beta cell mass happens in response to metabolic needs. This period is not well characterized, as signals that drive the process are not well known and the sources of new beta cells remained unidentified. Latest research suggests that in mice, adult beta cell regeneration mostly depends on proliferation of preexisting beta cells rather than neogenesis; whereas in humans, neogenesis from pancreatic ductal epithelium and beta cell proliferation probably contributes equally to the regeneration process [35].
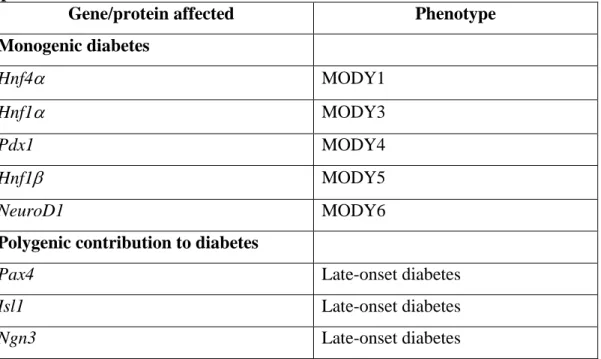
Table 1. Transcription factors involved in endocrine pancreas development and implicated in diabetes.
Gene/protein affected Phenotype
Monogenic diabetes
Hnf4 MODY1
Hnf1 MODY3
Pdx1 MODY4
Hnf1 MODY5
NeuroD1 MODY6
Polygenic contribution to diabetes
Pax4 Late-onset diabetes
Isl1 Late-onset diabetes
Ngn3 Late-onset diabetes
Several transcription factors are now recognized to be critical regulators of pancreatic development based on mouse models in which specific genes have been deleted (gene
knock-outs) or inhibited. Remarkably, almost without exception, disruption of these genes has resulted in phenotypes of impaired development of the pancreas and consequent diabetes. Furthermore, lessons learned from the gene knock-outs in mice have been used to successfully identify mutations in several of the corresponding orthologous genes in individuals with familial monogenic type 2 diabetes (Table 1).
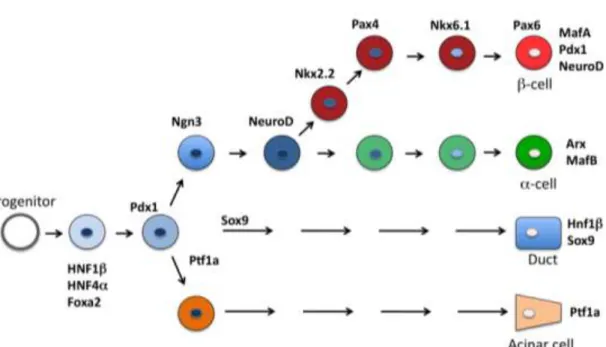
Detailed description of some of the most crucial transcription factors is given below and a simplified transcription factor cascade is depicted in Figure 1., based on recent reviews [36]. Expression patterns of transcription factors limit the boundaries of the developing pancreas and determine the differentiation programs of individual cell lineages. Importantly, transcription factors appear to serve dual functions in determining early cellular development and later in maintaining the phenotype of terminally differentiated cells.
Figure 1. A simplified model of the transcription factor cascade during endocrine differentiation in the developing pancreas. Arx, aristaless related homeobox; Foxa2, forkhead box A2; Hnf1, and 4, hepatic nuclear factor 1 and 4; MafA, and B, musculoaponeurotic fibrosarcoma oncogene homolog A and B; NeuroD1, neurogenic differentiation 1; Ngn3, neurogenin 3; Nkx2.2, and 6.1, NK2 homeobox 2 and NK6 homeobox 1; Pax4, and 6, paired box 4, and 6; Pdx1, pancreatic and duodenal homeobox 1; Ptf1a, pancreas specific transcription factor 1a; Sox9: sex determining region Y box 9. The figure is a modified version of the model by German [36].
1.1.1. Pdx1
The pancreatic duodenal homeobox gene-1 (Pdx1) is a master regulator of both pancreatic development and the differentiation of progenitor cells into the beta cell phenotype [37]. Because Pdx1 is a pancreas-specific homeoprotein, it was cloned and identified as a beta and delta cell specific regulatory factor for transcriptional expression of insulin and somatostatin genes and has subsequently been shown to regulate the expression of other islet-specific genes, including Glut2 [38], and glucokinase [39]. In the differentiated beta cell, Pdx1 is a glucose-responsive regulator of insulin gene expression [40, 41]. The function of Pdx1 in response to glucose is regulated by both its phosphorylation [42] and nuclear translocation [43].
The patterns of expression of Pdx1 in the developing pancreas are maintained throughout development and provide both spatial and temporal contributions to the commitment of endoderm to a pancreatic phenotype. Based on mouse models, Pdx1 expression is first detected in murine cells in a narrow band of foregut endoderm, then is seen in both ventral and dorsal pancreatic buds, later Pdx1 is expressed throughout the developing ductal tree. As the exocrine pancreas appears and the islets begin to form into the hormone-producing cells, Pdx1 expression shifts to the endocrine compartment [44]. During the later stages of islet development, the expression of Pdx1 becomes mostly restricted to the mature beta cells of the endocrine pancreas [44]. In the adult pancreas, subpopulations of somatostatin-producing and pancreatic polypeptide-producing cells also express Pdx-1 [44].
Targeted disruption of the Pdx1 gene in mice results in agenesis of the pancreas [45]. Notably, a child born without a pancreas (pancreatic agenesis) was homozygous for an inactivating mutation in Pdx1 [46], underscoring the importance of this transcription factor in the development of the human, as well as the mouse, pancreas.
1.1.2. Ngn3, Notch signaling, and Hes
Notch signaling is an important factor in the somatogenesis of the vertebrate embryo [47], and there is evidence of Notch signaling in the developing pancreas, suggesting a primary role for governing cell fate [48, 49].
The basic concept of Notch signaling relies on lateral inhibition [47]. Percursor cells express extracellular ligands, such as Jagged, that activate Notch receptors on adjacent cells, and downstream signaling results in expression of Hes genes. The Hes genes encode basic helix-loop-helix (bHLH) factors that function to repress Ngn3 and other target genes, therefore prevents the differentiation of these cells adjacent to the original differentiating cell. In essence, the lateral inhibition model provides a mechanism by which the cell that will differentiate into the endocrine lineage (Ngn3 positive) inhibits its neighboring cells, forcing them to adopt a non-endocrine fate.
In the generation of the pancreas, Ngn3 is required for the development of all endocrine cell lineages [49] and has been designated as a marker of islet precursor cells. Ngn3 promoter contains binding sites for and is activated by upstream factors Hnf3, Hnf1, and Hnf6 (hepatic nuclear factors). Expression of Ngn3 starts around pancreatic bud formation from the foregut, and it peaks during the major wave of endocrine cell genesis. By birth, Ngn3 expression is greatly diminished and it is not detectable in the adult pancreas.
Significantly, mice homozygous for an Ngn3-null mutation failed to generate any endocrine cells or putative endocrine precursors during development [49]. These observations led to the assumption that Ngn3 expression is a functional marker of an islet cell precursor population in the developing pancreas. More recently, a case of permanent neonatal diabetes and congenital malabsorptive diarrhea secondary to enteroendocrine cell dysgenesis was reported, where severe deficiency of Ngn3 was confirmed due to biallelic mutations [50]. This finding also confirms the essential role of Ngn3 in humans.
1.1.3. NeuroD1/Beta2
The basic helix-loop-helix transcription factor NeuroD1 (also known as Beta 2) is a key regulator of both insulin gene transcription in pancreatic beta cells and the terminal differentiation of neurons, hence its name [51, 52]. NeuroD1 expression initiates slightly later than Ngn3 during pancreatic development. First, the expression appears within and in proximity to ductal epithelium, and later it becomes restricted to islets.
NeuroD1 heterodimerizes with ubiquitously expressed E47 to regulate transcription of
the insulin gene and other beta cell-specific genes. Expression of the NeuroD1 gene is activated by Ngn3 [53].
Mice homozygous for a targeted disruption of the NeuroD1 gene survive to birth, but die within 3–5 days postpartum of severe hyperglycemia. The islets of these mice are dysmorphic and have markedly diminished numbers of endocrine cells arranged in streaks and irregular aggregates and reduced numbers of beta cells [54].
1.1.4. Pax4 and Pax6
Pax4 and Pax6 are paired box homeoproteins, whose expression is restricted to the endocrine pancreas and the central nervous system [55, 56].
Pax4 is expressed in the developing pancreas buds, and by the time of birth, expression is restricted to beta cells. Targeted disruption of Pax4 in mice results in a striking pancreatic phenotype; there is a virtual absence of beta and delta cells, but alpha cells are increased [55]. The Pax4-null mice survive birth, but die within 3 days of hyperglycemia and dehydration. Pdx-1 expression in Pax4-null pancreas is absent, a finding consistent with the absence of differentiated beta cells. Thus, Pax4 functions early in the development of islet cells to promote the differentiation of beta and delta cells.
Pax6 is expressed early in the epithelium of the developing pancreas, and later, contrary to Pax4, it is expressed widely in differentiated endocrine cells, including alpha, beta, delta and PP cells. A spontaneous mutation of the Pax6 gene in mice results in abnormal organization of the islets, with decreased number of alpha, beta, delta and PP cells, and reduced glucagon and insulin production [57]. Knock-out Pax6 nullizygous mice die within minutes of birth, and these animals fail to form islets [58].
These mouse models of gene knock-outs implicate both Pax4 and Pax6 as key regulators of the terminal steps in cellular differentiation of the endocrine pancreas.
1.1.5. Nkx2.2 and Nkx6.1
Members of the Nkx family of homeoprotein transcription factors, Nkx2.2 and Nkx6.1, are regulators of the differentiation of pancreatic endocrine cells [59]. Nkx2.2 is
expressed early in developing pancreatic buds and is later restricted to alpha, beta, and PP cells of islets. Nkx6.1 is expressed primarily in beta cells of adult islets.
Disruption of either the Nkx2.2 or Nkx6.1 gene in mice results in death soon after birth due to severe diabetes [60]. The pancreata of Nkx2.2 and Nkx6.1 knockout mice have no insulin-producing cells, and glucagon producing cells are diminished, although the exocrine pancreas is histologically normal [60, 61].
1.1.6. MafA and MafB
MafA and MafB are members of a large family of basic leucine zipper transcription factors. In the adult pancreas, MafA expression is restricted to mature beta cells [62], whereas MafB is typical of the mature alpha cells. Interestingly, during embryogenesis, MafB is expressed early in pancreatic endocrine cells (both in glucagon-positive and insulin-positive cells), where it regulates the expression of key factors that are required for the production of mature alpha and beta cells [63]. MafA is produced only in insulin-positive cells within the pancreas, with production first detected around secondary transition, during the principal wave of beta cell production [64]. At a late stage of differentiation, even after birth, beta cells undergo a switch from MafB to MafA, concomitant with the acquisition of glucose sensing and other characteristics of the mature beta cell [65].
MafA is an essential, glucose-responsive transcriptional activator in adult beta cells, due in part to regulating genes associated with cell identity, including insulin, Glut2 and prohormone convertase PC1/3. Adult islet MafA levels appear to be a sensitive barometer of beta cell function, since many key metabolic and cellular effectors, such as glucose [62], fatty acids [66], and insulin [67], greatly impact MafA expression.
It is noteworthy, that MafA null mutant mice have overall normal pancreatic development, but develop diabetes later in life [68]. This finding in accordance with the notion that MafA is not necessary for beta cell specification, but it plays a role in beta cell function in mature animals.
In contrast to MafA knock-outs, in MafB null mutants, there is delayed development of early insulin-positive and glucagon-positive cells, and a 50% reduction
in insulin-positive and glucagon-positive cells overall, with an abundance of hormone- negative cells that appear otherwise to be of the endocrine lineage. Thus, MafB appears to be a key regulator of alpha and beta cell formation [63].
1.2. Regulation of insulin gene expression
Increases in blood glucose levels stimulate insulin gene transcription and insulin secretion. Insulin gene transcription is mainly controlled by a 340 bp promoter region upstream of the transcription start site of the insulin gene. The insulin promoter region comprises cis-acting sequence motifs, which serve as binding sites for both beta cell- specific and ubiquitous transcription factors [69]. Much of the glucose responsiveness inherent to the insulin promoter is conferred by the A3, E1 and C1 sites, which are bound by the transcription factors Pdx1 [70], NeuroD1 [51] and MafA [71]
respectively. These three transcription factors act in a coordinated and synergistic manner to stimulate insulin gene expression in response to increased glucose levels [69, 72] (Figure 2). Compared with humans, rodents (rat and mouse) have two insulin genes, of which the insulin II gene and its promoter is mostly similar to that of humans [73]. On the basis of the analysis of transcription factor-binding sites and spacing of the cis-regulatory elements, there are significant differences between rodent and human insulin gene promoters. However, a detailed comparative analysis of the insulin promoters from various species suggest that the all three regulatory elements (A3, E1 and C1), important for glucose regulation of insulin gene expression, are conserved between species with the A-box (A3) to which Pdx1 binds being the most highly conserved one [74].
Figure 2. Insulin gene promoter is activated by the glucose-responsive, synergistic action of transcription factors Pdx1, MafA and NeuroD1.
Although Pdx1, NeuroD1 and MafA have been shown to be crucial for glucose regulation of insulin gene transcription, the exact mechanisms by which glucose modulates the function of these transcription factors remains to be established. In the case of Pdx1, it has been proposed that glucose modulates the function of Pdx1 by regulating the localization and DNA-binding activity of Pdx1 [75]. Several lines of evidence suggest that also NeuroD1 changes its localization in response to changing glucose levels. Under normal glucose conditions, NeuroD1 is mainly cytosolic, and exposure to high glucose causes its translocation into the nucleus [76]. MafA expression itself requires high glucose. Although expression of MafA is low under normal glucose conditions, MafA transcription increases drastically in response to high glucose [71, 77].
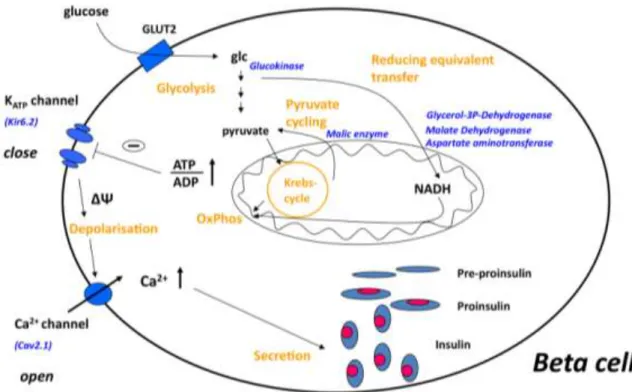
1.3. Glucose-stimulated insulin secretion
Beta cells are highly specialized cells that maintain blood glucose levels in the physiologically relevant range by rapid and precise changes in insulin secretion in response to nutrient secretagogues, particularly glucose [78]. Specialised metabolic pathways ensure the coupling of external nutrient stimuli to insulin secretion in adult beta cells [79] (Figure 3). During glycolysis in the adult beta cell, glucose is metabolized to pyruvate and the glucose-derived carbons are then oxidized in the mitochondria [80]. The very low expression of lactate dehydrogenase and monocarboxylate transporters results in negligible lactate production [81]. Glycolysis- derived cytosolic NADH is reoxidized in mitochondrial membrane shuttles, which include glycerol–phosphate, and the malate–aspartate, pyruvate–citrate and pyruvate–
malate shuttles [82, 83]. In addition, beta cells show strong pyruvate carboxylase activity [83] that facilitates the flux of pyruvate into the pyruvate–malate and pyruvate–
citrate shuttles. Glucose oxidation promotes the production of ATP, the key metabolic coupling factor for glucose-stimulated insulin secretion (GSIS). The closing of ATP- dependent K+ channels results in depolarisation, opening of voltage-activated Ca2+
channels and subsequent exocytosis of the insulin granules. GSIS can also be stimulated by glucose metabolism, which exerts its effect independently of the ATP-
dependent K+ channels, working through as yet undefined mechanisms [84]. In addition, there are other metabolic and neurohormonal amplifying pathways in beta cells that can potentiate insulin release.
Figure 3. The current concept of glucose-stimulated insulin secretion in pancreatic beta cells, described in details in the text. Abbreviations: glc, glucose; OxPhos, oxidative phosphorylation; ΔΨ, membrane depolarisation.
1.4. Immature glucose-stimulated insulin secretion from fetal/neonatal islets
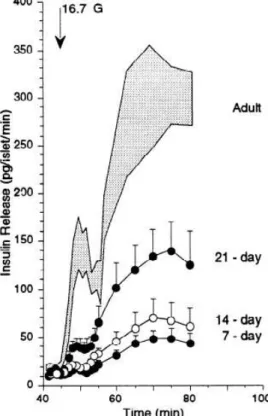
Although the metabolism of adult beta cells has been characterised extensively, that of fetal/neonatal beta cells is less well understood. Both human and rodent fetal and rodent neonatal islets [85-90] lack glucose responsiveness despite adequate insulin reserves [91], but secrete insulin in response to amino acids, particularly leucine [92, 93]. When newborn (P1) Sprague–Dawley rat islets were tested in a dose–response experiment using different secretagogues, insulin secretion was impaired in response to all stimuli; insulin secretion in response to different secretagogues started to rise at 1
week of age [93, 94]. The insulin secretion in response to glucose of perifused islets of different-aged rats [95] was small compared with adult islets at postnatal day (P) 7, with a slight increment at P14 and a doubling at P21; however, even at P21, the response was less than half of that of adult islets (see Figure 4, adapted from Bliss et Sharp). A variety of mechanisms focusing on individual genes have been proposed to account for immature insulin secretion, including lack of inhibition of fatty acid oxidation by glucose metabolism [95], lack of increased ATP content in response to glucose stimulation [96], and low levels and activity of mitochondrial glycerol-3- phosphate dehydrogenase and mitochondrial malate dehydrogenase, both NADH shuttle enzymes [97].
Figure 4. Insulin release from islets from rats of different ages in response to 16.7 mM glucose (G). Adapted from Bliss et Sharp, 1992 [95].
My primary objective was to study the mechanisms responsible for the immaturity of glucose-stimulated insulin secretion in rat beta cells by comparing gene expressional profiles of neonatal (P1) and adult beta cells. Beta cell immaturity proved to be a complex phenomenon, involving lower expression of many key metabolic enzymes
[98]. During the first weeks of postnatal life, expression of these genes increased in islets as insulin secretory responsiveness matured. Thus, the generalised low expression of key metabolic enzymes, may account for the poor glucose-responsiveness of neonatal beta cells [98].
1.5. Role of transcription factors in the maturation of beta cells
With many genes differentially expressed in the neonatal beta cell, a possible role of differential expression of key beta cell-enriched transcription factors must be considered. Pdx1 and MafA are most likely to be involved in the maturation process, because their expression is turned on after that of insulin during development [65].
Target genes of both Pdx1 [99] and MafA [100] have been reported, with many exocytotic genes regulated by Pdx1, and genes of insulin synthesis and secretion regulated by MafA. As discussed before, Pdx1 is crucial in pancreas formation [45, 101] and beta cell differentiation [38, 102, 103]. A role for MafA in maturation is supported by: (1) several of its putative target genes (insulin 2, prohormone convertase 1/3 (Pcsk1) and glucagon-like peptide 1 receptor (Glp1r) [100]) have reduced expression in neonatal beta cells [98]; (2) the switch from MafB+MafA–Insulin+ to MafB–MafA+Insulin+ cell state is a late stage event in beta cell differentiation [65];
and (3) the MafA-deficient mice appear normal at birth but later develop impaired secretagogue-stimulated insulin secretion and glucose intolerance [68]. In addition, insulin-expressing MafB+ cells derived from human embryonic stem cells lacked glucose-stimulated insulin secretion in vitro [15, 104] but acquired both glucose responsiveness and MafA production after transplantation into mice [16].
My secondary objective was to assess whether maturation of neonatal beta cells into glucose-responsive, mature insulin secreting cells is regulated by Pdx1 and/or MafA, by overexpressing these factors in neonatal islets.
1.6. Role of MafA in mature beta cell function
MafA is unique to the beta cells and appears to be essential for maturation [105], rather than being a developmental factor and playing a role in cell commitment [68]. MafA has been shown to be critical for adult beta cell function, because mice lacking MafA become glucose intolerant and develop diabetes, although insulin content of islets per se is not affected [68]. In addition, MafA knock-down experiments in cell lines suggested that MafA has a function beyond regulating insulin transcription. Several beta cell important genes were progressively down-regulated with the loss of functional MafA in cell lines [100]. The confirmation of these putative MafA target genes, including Glut2 and Pcsk1, is awaited in primary cells and in in vivo experiments.
There are natural and pathological conditions where beta cells are “dysfunctional” and do not respond to glucose with insulin secretion.
One such example is the previously discussed neonatal period, which is not really impairment but rather an immature state, characterized by the lack of glucose- responsive insulin secretion. In my secondary objective, we studied the effects of enhanced MafA expression in neonatal beta cells as we speculated that it could drive the acquisition of glucose-responsive insulin secretion [105].
Another dysfunctional beta cell state develops when adult beta cells are exposed to chronic glucotoxicity. MafA levels were reported to be lower and GSIS is impaired in glucotoxic beta cells, along with the down-regulation of several important genes of the beta cell metabolism [106]. Normalization of glucose homeostasis reconstitutes MafA expression and restore glucose-stimulated insulin secretion [106].
My tertiary objective was to establish the causal relationship between MafA expression and functional integrity of adult beta cell; and to study MafA targets besides insulin with the inhibition of MafA function in adult rat beta cells.
My final objective was to investigate the ability of MafA over-expression in a diabetic model to restore glucose-stimulated insulin secretion.
2. Aims
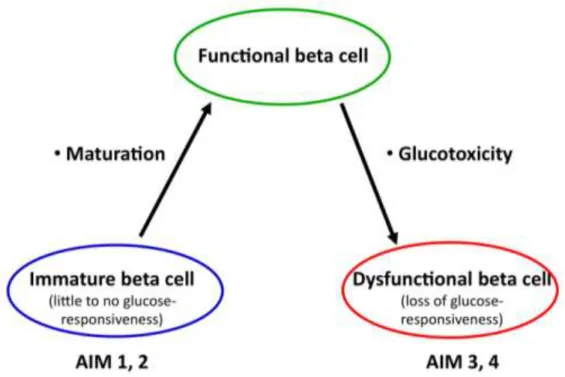
The general objective of my PhD thesis is to provide a molecular description of the evolving beta cell phenotype; from the immature neonatal period, through the mature, glucose-responsive stage, to the development of glucotoxicity and a dysfunctional beta cell phenotype (Figure 5).
AIM 1. To characterize the underlying mechanisms responsible for the immature, glucose-unresponsive phenotype of neonatal beta cells.
Postulating that the mechanisms responsible for neonatal beta cell immaturity are complex, we used microarray analysis to compare the gene expression profile of neonatal (postnatal day P1) and adult beta cells excised by laser-capture microdissection. Sets of genes with differential expression were confirmed with quantitative realtime PCR (qPCR) and immunostaining. Moreover, expression pattern of these genes were followed during the first weeks of postnatal life, as the insulin secretion of the islets matures.
AIM 2. To assess whether maturation of neonatal beta cells into glucose- responsive, mature insulin secreting cells is regulated by transcription factor MafA and/or Pdx1.
We characterized the expression of MafA and Pdx1 and that of other key beta cell genes during the first 4 weeks of postnatal life. We hypothesized that enhancing the expression levels of these factors in neonatal beta cells could drive the acquisition of glucose-responsive insulin secretion.
AIM 3. To characterize the importance of MafA in regulating beta cell function in adult rat islets.
We hypothesized that there is a causal relationship between MafA expression and functional integrity of adult beta cell; and we studied MafA targets besides insulin with the inhibition of MafA function in adult rat beta cells.
AIM 4. To test the role of MafA in dysfunctional beta cells.
We investigate the ability of MafA overexpression in a diabetic model to restore glucose-stimulated insulin secretion.
Figure 5. The paradigm of beta cell. The aims of the current thesis are described in the text.
3. Methods
3.1. Animals
Adult Sprague-Dawley rats (male and female), female Goto-Kakizaki (GK) rats (12 weeks old) and age-, gender-matched Wistar-Kyoto rats were purchased from Taconic Farms (Germantown, NY). In order to have P1 animals (P0 as day of birth) pregnant animals were purchased and checked daily until delivery. Animals were kept under conventional conditions in climatized rooms, with free access to tap water and standard pelleted food. Fed glucose levels and body weight of the adult animals were monitored weekly. All procedures were approved by the Joslin Institutional Animal Care and Use Committee. Neonatal pups were nursed until they were killed at P1, P2, P7, P9, P11, P13, P15, P21 or P28. For immunostaining, excised pancreases (n=3 for P2, P7 and adult) were fixed by immersion in 4% paraformaldehyde, and stored in PBS until paraffin embedding and sectioning. For laser capture microdissection (LCM), excised pancreas immersed in TissueTek OCT medium (VWR Scientific Products, San Diego, CA) was rapidly frozen in chilled isobutane and immediately stored at -80°C.
Adult male rats were anaesthetized with Nembutal for islet isolation by collagenase digestion according to the method described by Gotoh [107] with rodent Liberase RI (Roche, Indianapolis, IN). Islets from two adults were pooled as one sample. For neonatal islets, rats were decapitated and pancreases from a litter (10–12 pups) were pooled, finely minced and digested with Liberase solution. Adult and neonatal islets were purified by gradient separation using Histopaque-1077 (Sigma, St Louis, MO), and after overnight culture were handpicked under a stereomicroscope to ensure high purity. Islets were then further processed for in vitro experiments, or were put in Buffer RLT reagent (Qiagen, Germantown, MD) for RNA extraction and stored at -80°C.
3.2. Laser-capture microdissection
Frozen sections (8 μm) on uncoated slides were quickly processed for LCM: first in 70% ethanol for 10 sec, haematoxylin for 40 sec, dehydrated for 10 sec each in 70%
and 95% ethanol, stained with eosin for 10 sec and finally dehydrated for 3 min in 100% ethanol followed by xylene for a minimum of 2 min. Once sections were air- dried, beta cell-enriched cores of islets were microdissected using a PixCell II LCM system (Arcturus, Mountain View, CA). For each sample, at least 4,000 „hits‟ from two to five islets per section were excised from 10–20 sections. Total RNA from each sample was extracted using a modification of the RNA microisolation protocol as described [108-110]. T7-based RNA amplification was carried out using the RiboAmp kit (Arcturus) according to the manufacturer‟s recommendations. To obtain enough amplified RNA for microarray, a second round of RNA amplification was performed [111].
3.3. Microarray hybridization
Biotinylated cDNA (BioArray HighYield RNATranscript Labeling kit; Enzo Life Sciences, Farmingdale, NY, USA) of four adult and four neonatal beta cell-enriched samples were run on Affymetrix GeneChip Rat Genome U34A (Affymetrix, Santa Clara, CA; adult by MGH Cancer Center DNA Microarray Core Facility; neonatal by Joslin DERC Genomic Core). Data have been deposited in a MIAME-compliant database (GEO series accession number GSE24790). Analysis was performed using a DNA-Chip Analyzer (dChip; Harvard School of Public Health, Boston, MA, USA;
www.dchip.org). This software uses the model-based expression analysis, which allows probe-level analysis on multiple arrays. As the LCM RNA samples were amplified before labeling, we followed the manufacturer‟s recommendation of using 50% masked data for analysis. Principal component analysis for sample classification with dChip software revealed that one of the adult samples was an outlier; therefore this array was excluded from further analysis. Data from multiple arrays are normalized to a common baseline array having the median overall brightness. Thus, by pooling information across multiple arrays, it is possible to assess the standard errors for the expression indices and to calculate confidence intervals for fold changes. Lower confidence boundary (LCB) and p values (<0.050) were used to assess differentially expressed genes.
Differentially expressed genes were classified into functionally related clusters using Database for Annotation, Visualization and Integrated Discovery (DAVID) software [112, 113]. The functional annotation tool of DAVID using high-classification stringency identified enriched functionally related gene groups; the enrichment p values are reported.
3.4. Adenovirus infection
Using the AdEasy system with a CMV promoter (Stratagene, La Jolla, CA) we generated recombinant adenoviruses expressing: AdMafA, expressing the full human MafA coding sequence; AdDN-MafA, containing a dominant negative mutant of MafA lacking the N-terminal transcriptional activation domain [100]; and AdNeuroD1, expressing the hamster NeuroD1 coding sequence; an adenovirus encoding green fluorescent protein alone (AdGFP) served as control. Adenovirus containing the coding sequence for Pdx1 (AdPdx1) was a kind gift from Dr. D. Melton [22]. All adenoviruses were amplified in 293Ad cells purchased from Stratagene (La Jolla, CA), and were purified with the Vivapure AdenoPACK 100 kit (Sartorius Stedim Biotech, Gottingen, Germany). Virus titers were established based on quantification of plaque formation.
After overnight culture in RPMI 1640 (11 mM glucose with 10% Fetal Bovine Serum [FBS] and 1% Penicillin-Streptomycin), islets were dispersed to single cells using trypsin (>10000 U/mg, from Sigma, St Louis, MO; final concentration 1 mg/mL) and DNAse (from Roche, Indianapolis, IN; final concentration 60 U/mL). Dispersed islet cell numbers were established and was calculated for the independent virus infections.
Dispersed islets cells were incubated with adenoviruses at a multiplicity of infection (MOI) of 1 to 5 for 24 hours at low (5 mM) glucose RPMI 1640 (low 5 mM glucose with 10% FBS and antibiotics) on ultra-low attachment hydrophobic plates (Corning, Corning, NY), which allowed islet cell reaggregation. After the virus incubations, the media was changed to high (20 mM) glucose RPMI 1640 with the same supplements.
The switch from low to high glucose concentration was chosen because it enables the strongest activation of important glucose-sensitive beta cell transcription factors including MafA, Pdx1 and NeuroD1.
3.5. RNA extraction from isolated islets and reverse transcription
Total RNA from isolated islets or reaggregated islet samples after various times of culture was extracted using RNeasy Plus Mini Kit (Qiagen, Germantown, MD). After quantification by spectrophotometry, 500 ng total RNA from each sample was used as starting material for cDNA preparation. Reverse transcription was done in 25 mL reaction solution containing 5 mL Superscript buffer, 0.1 M dithiothreitol (DTT), 50 ng random hexanucleotide primers, 10 mM dNTP, 200 units of RNaseOUT, and 200 units of Superscript II reverse transcriptase (Invitrogen, Carlsbad, CA). Reverse transcription reactions were incubated for 10 min at 25°C, 60 min at 42°C, and 10 min at 95°C. The resulting cDNA was diluted 1: 2 in nuclease-free water, resulting in 10 ng/mL final concentration and stored at -20°C until analysis.
Table 2. Sequences of oligonucleotide primers used for real-time PCR.
Gene Name Size
(bp) 5' oligonucleotide 3'oligonucleotide
Carnitine
palmitoyltransferase 1 295 GAGACACCAACCCCAAC
ATC GTCTCTGTCCTCCCTTCTCG
Carnitine
palmitoyltransferase 2 196 GCAGATGAACCACAACA TCC
TTCCAAGCACTTCTGGACA C
Glutamate oxalacetic
transferase 1 158 TGACCGGATTCTGACCAT G
AGATGTGCTTCTCGTTGAC C
Glycerol-3-phosphate
dehydrogenase 2 107 TGAGTTTCTGCAGCTGAT GA
TTGGAACTCTACGGTCCAA GT
Malate dehydrogenase
1 149 ACTCGTTCCCTGTCGTGA
TC
TCATGCGGAGGAGAGAAA C
Malic enzyme 1 159 TTAGCCCACAGACTCATG GG
AGGACTTTCTCAGCAGCAG G
Pyruvate carboxylase 167 TTGAAGGATGTGAAGGG CC
ACCTTTCGGATAGTGCCCT C
Pyruvate kinase, L-type 248 AGCCGTGACCCAACTGA
G TCCACATCATCTGCCCAG
Ribosomal protein L32 82 CAATGTGTCCTCTAAGAA
CCGAAA CCTGGCGTTGGGATTGG
3.6. Quantitative real-time PCR (qPCR) for confirmation of differential expression of genes
qPCR with SYBR Green detection was performed using the ABI7300 Real-time PCR System (Applied Biosystems, Foster City, CA, USA) with primers (Table 2) designed
using Primer Express (Applied Biosystems). Oligonucleotide specificity was computer tested (BLAST, NCBI), and later confirmed by dissociation curve analysis and resolving the PCR products in agarose gel electrophoresis. Each primer set displayed approximately equal efficiency for amplification of target cDNA. The reactions were set by mixing 10 μl SYBR Green Master Mix (Applied Biosystems) with 1 μl of each 5′ and 3′ oligonucleotides (10 pmol/μl) and 1 μl cDNA sample (10 ng/μl). To exclude genomic DNA contamination, RT-negative samples were run for each cDNA sample.
After normalization of the gene of interest to a control ribosomal gene (L32 or S25) [114], the comparative CT (threshold cycle) method was used to calculate relative gene expression levels. Adenoviral-hMafA mRNA was determined by comparison of two different sets of primers: one recognizing the coding sequence (CDS) of both endogenous (rat) and adenoinfected (human) MafA, and the other recognizing the 3′
untranslated (UTR) sequence of MafA only present in the endogenous transcript.
3.7. Insulin secretion in vitro
Insulin secretion of the islet cell aggregates was measured with sequential static incubations 24, 36, 48 and 72 hours after adenoviral infections. Aggregates were preincubated for 1 hour in low (2.8 mM) glucose Krebs-Ringer bicarbonate buffer (KRBH, with 16 mM HEPES and 0.1% Bovine Serum Albumin, pH 7.4) to establish basal conditions. The buffer was then replaced for fresh low glucose KRBH for 1 hour, followed by KRBH containing various reagents stimulating insulin secretion (16.7 mM glucose, low glucose with 10 mM leucine and 4 mM glutamine, low glucose with 10 mM arginine, or low glucose with 30 mM KCl). Media aliquots were collected at the end of the low glucose incubation and after stimulation and stored at -20°C until insulin analysis with Insulin Rat EIA kit (ALPCO Diagnostics, Salem, NH). Aggregate lysates after sonication were assayed for DNA content (CyQUANT kit, Invitrogen, Carlsbad, CA) and insulin content.
3.8. Insulin secretion in vivo: intra-peritoneal glucose tolerance test
For intraperitoneal glucose tolerance tests (IPGTT), rats were fasted with free access to
water only, for 8–12 h. Rats were then injected intraperitoneally with 10% glucose solution at a dose of 2 g/kg body weight. Blood glucose readings were performed from the tail vein at 0, 30, 60, 90 and 120 minutes post injection, using OneTouch Ultra blood glucose meter (LifeScan, Milpitas, CA).
3.9. Western Blot analysis
20 μg of total protein extract of sonicated islets were boiled for 5 min in the presence of β-mercaptoethanol and resolved on 10% SDS-PAGE (polyacrylamide gel electrophoresis), transferred to PVDF membranes and probed with either MafA antibody (1:2000, [65]) or HSV antibody (1:5000, Abcam, Cambridge, MA), which detects the HSV-tagged DN-MafA protein. GFP was used as a loading control. Primary antibodies were diluted in Tris-buffered saline containing 0.05% Tween 20 (TBST).
Membranes were washed in TBST and incubated with either anti-rabbit or anti-mouse secondary antibodies conjugated to horseradish peroxidase (Bio-Rad Laboratories, Hercules, CA). The blots were visualized with chemiluminescence SuperSignal West Dura reagent (Pierce, Thermo Fisher Scientific, Waltham, MA).
3.10. Immunostaining
Paraffin sections were blocked for endogenous peroxidase, microwaved in 10 mmol/l citrate buffer pH 6.0 for 15 min at 20% power and then incubated overnight at 4°C with anti-pyruvate kinase antibody (1:100 goat-anti rabbit, US Biologicals, Swampscott, MA), then with biotinylated anti-goat IgG (Vector Laboratories, Burlingame, CA) 1 hour, with ABC reagent 1 hour and visualized with VIP (Vector VIP substrate kit for peroxidase, Vector Labs). Incubations with anti-rabbit glycerol-3-phosphate dehydrogenase (1:100, the kind gift of M. MacDonald, Department of Pediatrics, University of Wisconsin, WI), donkey biotinylated anti-rabbit IgG (1:400), were followed by streptavidin-conjugated Alexafluor Green (1:400). Sections were double stained for insulin (guinea pig anti-human, 1:200, Linco Research, St Charles, MO) with Texas Red-conjugated Affinipure donkey anti-guinea pig IgG (1:400) as secondary antibody. Images were taken with an Olympus BH2 or, in confocal mode, a
Zeiss 410 or 710 LSM microscope. Sections of different ages were stained and photographed in parallel using the same settings, so the relative intensities reflect the protein levels. For beta cell composition, pancreatic sections double stained with anti- insulin and a cocktail of anti-non-beta cell hormones were imaged by tile scan collection, and then the insulin-positive area of all clusters at least 35 μm diameter were quantified as proportion of total islet area (Table 5).
3.11. Data analysis
For statistical analysis, unpaired Student‟s t test was used. To see differences among groups, ANOVA was used followed by post hoc analysis (Tukey‟s). A p value <0.050 was considered statistically significant.
4. Results
Characterization of immature, glucose-unresponsive neonatal beta cells
Microarray analysis revealed different mRNA expression patterns in neonatal compared with adult beta cells
Using dChip analysis on 50% masked probes and the high stringency LCB cutoff of 2 and p<0.050, we found 217 genes/ 38 expressed sequence tags (ESTs) higher in neonatal compared with adult beta cell-enriched cores and 345 genes/33 ESTs lower in neonatal; with a false-discovery rate of 4.9%. Hierarchical clustering analysis of differentially expressed genes showed a clear separation between neonatal and adult control samples (Figure 6). Differentially expressed genes ranged widely across biochemical functions, including metabolism, cell cycle, ion channels and cell surface proteins.
Figure 6. Heat map display of the differentially expressed genes in laser captured enriched beta cells from neonatal (P1) and adult pancreas. dChip analysis with LCB cutoff of 2 and p<0.050.
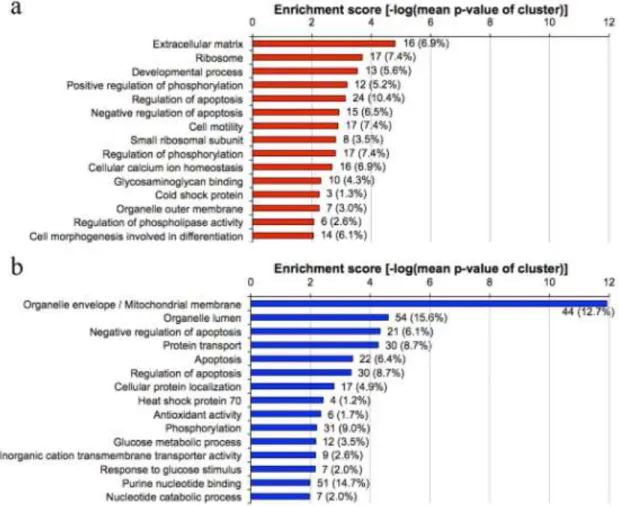
For an unbiased analysis of the differentially expressed genes in neonatal beta cells (LCB>2, p<0.050), DAVID functional annotation clustering [112, 113] was used.
The functional annotation clustering algorithm of the DAVID program systematically analyzes gene lists according to gene ontology terms and statistically highlights the most overrepresented (enriched) biological annotation as clusters of biological processes [112]. Here the top 15 clusters for higher and lower expressed genes in the neonatal compared to adult beta cells are presented (Figure 7.). Bars represent enrichment scores, which are calculated as the negative logarithm of the geometric mean of the individual over-representation P value in each cluster. The number of genes and corresponding percent of each biological process relative to a total number of genes in a specific comparison are shown to the right of the bars.
Figure 7. Gene ontology analysis of genes expressed significantly higher (panel a), in red, lower confidence boundary >2) or lower (panel b, in blue, lower confidence boundary <-2) in neonatal versus adult beta cell-enriched islet cores.
The three most highly enriched clusters from the genes expressed higher in the neonatal beta cell samples (extracellular matrix, ribosomes and developmental process) might be expected for newly differentiated tissues. The enrichment score of the organelle/mitochondrial membrane genes (11.92, which is more than double that of other categories) indicates a very strong over-representation. This robust enrichment suggests a systemic lower expression of mitochondrial genes, especially those for the membrane bound proteins and shuttle enzymes. Clusters that might also be expected for immaturity of beta cell function, such as calcium handling and membrane-bound vesicles, had enrichment scores of 1.5 but were only ranked as clusters 30 and 31 respectively; regulation of hormone secretion cluster showed no enrichment (enrichment score 0.67).
In contrast the three most highly enriched clusters for the genes with lower expression in the neonates were organelle/mitochondrial membrane, organelle lumen and negative regulation of apoptosis. Of interest, clusters of regulation of apoptosis/cell death are enriched in both neonatally higher and lower differentially expressed genes, even though the same genes are not represented in both. The frequency of apoptosis is about 3-fold higher in neonatal beta cells than adults [115].
Less stringent criteria (LCB cutoff of 1.2 and p<0.050) were used to selectively analyze genes important in the beta cell phenotype. The number of genes higher in neonatal samples increased to 363 probe sets for genes/54 ESTs and those with reduced gene expression increased to 685 genes/ 68 ESTs. It is striking that a high percentage of genes in the mitochondrial shuttles and fatty acid metabolism were differentially expressed. We focused on differentially expressed genes of the beta cell-specialized metabolic pathway, grouping them into functional clusters (Table 3 and 4).
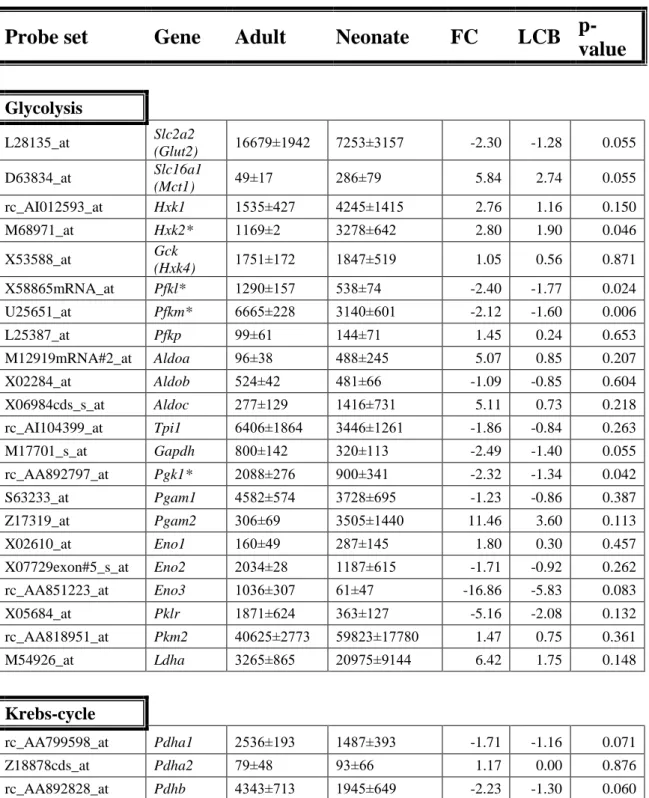
Table 3. Expression of metabolic genes in beta cells grouped into functional categories (Glycolysis, Krebs-cycle, Mitochondrial shuttles). Genes of the various pathways are listed with the mean±SEM, fold change (FC), lower confidence boundary (LCB) and p-value as determined with dChip. Where multiple probe sets were on the microarray, the more stringent _at set is listed; if no_at probe set, the set with highest expression is listed. Microarray signals of adult (n=3) and neonatal (n=4) samples.
Those with significance (p<0.050, fold change of 1.5 or greater, LCB of 1.2, and signal mean difference of at least 100) are marked with asterisks.
Probe set Gene Adult Neonate FC LCB p- value
Glycolysis
L28135_at Slc2a2
(Glut2) 16679±1942 7253±3157 -2.30 -1.28 0.055 D63834_at Slc16a1
(Mct1) 49±17 286±79 5.84 2.74 0.055
rc_AI012593_at Hxk1 1535±427 4245±1415 2.76 1.16 0.150
M68971_at Hxk2* 1169±2 3278±642 2.80 1.90 0.046
X53588_at Gck
(Hxk4) 1751±172 1847±519 1.05 0.56 0.871
X58865mRNA_at Pfkl* 1290±157 538±74 -2.40 -1.77 0.024
U25651_at Pfkm* 6665±228 3140±601 -2.12 -1.60 0.006
L25387_at Pfkp 99±61 144±71 1.45 0.24 0.653
M12919mRNA#2_at Aldoa 96±38 488±245 5.07 0.85 0.207
X02284_at Aldob 524±42 481±66 -1.09 -0.85 0.604
X06984cds_s_at Aldoc 277±129 1416±731 5.11 0.73 0.218
rc_AI104399_at Tpi1 6406±1864 3446±1261 -1.86 -0.84 0.263
M17701_s_at Gapdh 800±142 320±113 -2.49 -1.40 0.055
rc_AA892797_at Pgk1* 2088±276 900±341 -2.32 -1.34 0.042
S63233_at Pgam1 4582±574 3728±695 -1.23 -0.86 0.387
Z17319_at Pgam2 306±69 3505±1440 11.46 3.60 0.113
X02610_at Eno1 160±49 287±145 1.80 0.30 0.457
X07729exon#5_s_at Eno2 2034±28 1187±615 -1.71 -0.92 0.262
rc_AA851223_at Eno3 1036±307 61±47 -16.86 -5.83 0.083
X05684_at Pklr 1871±624 363±127 -5.16 -2.08 0.132
rc_AA818951_at Pkm2 40625±2773 59823±17780 1.47 0.75 0.361
M54926_at Ldha 3265±865 20975±9144 6.42 1.75 0.148
Krebs-cycle
rc_AA799598_at Pdha1 2536±193 1487±393 -1.71 -1.16 0.071
Z18878cds_at Pdha2 79±48 93±66 1.17 0.00 0.876
rc_AA892828_at Pdhb 4343±713 1945±649 -2.23 -1.30 0.060