A bifactor model of the Posttraumatic Growth Inventory Barna Konkolÿ Thegea,b†*, Éva Kovácsb,c†and Piroska Balogb
aDepartment of Psychology, University of Calgary, 2500 University Drive NW, Calgary, Canada T2N 1N4;
bInstitute of Behavioral Sciences, Semmelweis University, Budapest, Hungary;cDepartment of Social Work, John Wesley Theological College, Budapest, Hungary
(Received 20 November 2013; accepted 12 March 2014)
Purpose: The Posttraumatic Growth Inventory (PTGI) is a self-administered measurement instrument designed to provide information concerning positive psychological changes after a traumatic life event. The aim of the present study was to examine the psychometric properties of the PTGI in a Hungarian sample. By examining a bifactor model of the instrument, we also wanted to contribute to the establishment of an evidence-based practice concerning the use of different score types (total score versus subscale scores). Methods:
Altogether, 691 Hungarian respondents (82.2% female; Mage= 33.0 ± 13.4 years), who experienced some kind of trauma or loss, participated in this study. Results: A series of confirmatory factor analyses revealed that among the testedfirst- and second-order models, a bifactor model provided the best-fit to our data (χ2/df = 4.32, Comparative Fit Index = .91, root mean square error of approximation = .07, standardized root mean square residual = .04).
Further, the Hungarian version of the PTGI showed high internal consistency (Cronbach’s alpha = .93, omega total = .95, omega hierarchical = .87) and test–retest reliability (r= .90;p
< .01) coefficients. However, omega hierarchical coefficients (.14–.40) and explained variance values (.05–.10) for the subscales were low. Conclusions: The present study provided empirical support for the psychometric adequacy of the Hungarian adaptation of the PTGI and suggests that only the total and not the subscale scores of the inventory should be used.
Keywords: Posttraumatic Growth Inventory; psychometric properties; factor structure;
confirmatory factor analysis; bifactor model
1. Introduction
The Janus-faced phenomenon of losses involves suffering and pain on the one hand and positive changes through adjustment to trauma on the other (Maercker & Zoellner,2004). The experience of these latter positive changes as a result of highly challenging life crises has been labeledpost- traumatic growthby Tedeschi and Calhoun (1996). In the last decade and a half, many investi- gations have examined posttraumatic growth in different groups of trauma survivors including the bereaved (Engelkemeyer & Marwit,2008), war veterans (Feder et al.,2008; Kaler, Erbes, Tedeschi, Arbisi, & Polusny, 2011), political prisoners (Salo, Punamaki, Qouta, & El Sarraj, 2008), victims of traffic accidents (Nishi, Matsuoka, & Kim, 2010), survivors of terrorist attacks (Posta,2010), earthquake survivors (Gao et al.,2010), people infected with HIV (Night- ingale, Sher, & Hansen, 2010), patients suffering from rheumatoid arthritis (Dirik & Karanci,
© 2014 The Author(s). Published by Taylor & Francis
*Corresponding author. Email:bkonkoly@ucalgary.ca
†These authors contributed equally to the present study.
This is an open-access article distributed under the terms of the Creative Commons Attribution Licensehttp://creativecommons.org/
licenses/by/3.0/,which permits unrestricted use, distribution, and reproduction in any medium, provided the original work is properly cited. The moral rights of the named author(s) have been asserted.
Health Psychology & Behavioural Medicine, 2014
Vol. 2, No. 1, 529–540, http://dx.doi.org/10.1080/21642850.2014.905208
2008), cancer patients (Brunet, McDonough, Hadd, Crocker, & Sabiston,2010; Zwahlen, Hagen- buch, Carley, Jenewein, & Buchi,2010), and individuals suffering other losses including divorce (Lamela, Figueiredo, Bastos, & Martins,2014) or exile (Teodorescu et al.,2012).
Several instruments were developed for the assessment of the subjective experience of posi- tive psychological changes after traumatic events. One of the most commonly used is the Post- traumatic Growth Inventory (PTGI) developed by Tedeschi and Calhoun (1996). Beyond the original English-language version of the scale, it is now widely available in many other languages –including Bosnian (Powell, Rosner, Butollo, Tedeschi, & Calhoun,2003), Chinese (Ho, Chan,
& Ho, 2004), Dutch (Jaarsma, Pool, Sanderman, & Ranchor, 2006), German (Maercker &
Langner,2001), Hebrew (Lev-Wiesel & Amir,2003), Italian (Prati & Pietrantoni,2014), Japanese (Taku et al.,2007), Portuguese (Lamela et al.,2014; Teixeira & Pereira,2013), Spanish (Weiss &
Berger,2006), and Turkish (Dirik & Karanci,2008). Besides the cultural adaptations of the instru- ment, several researchers have developed shortened (Cann et al.,2010), revised (Kilmer et al., 2009; Lau et al.,in press), or altered versions of the questionnaire for special populations as chil- dren or adolescents (Cryder, Kilmer, Tedeschi, & Calhoun,2006; Taku, Kilmer, Cann, Tedeschi,
& Calhoun,2012).
Many studies have also investigated the psychometric properties of the PTGI. However, ambiguous results emerged in the different studies leaving an important question unanswered:
whether posttraumatic growth is a single unidimensional construct or a collection of different components. For example, the principal component analysis performed on the 21-item question- naire by the test developers revealedfive components which explained 62% of the total variance (Tedeschi & Calhoun,1996). These components were labeled as Relating to Others (seven items), New Possibilities (five items), Personal Strength (four items), Spiritual Change (two items), and Appreciation of Life (three items).
However, in other samples of subsequent investigations, one- (Joseph, Linley, & Harris,2005;
Polatinsky & Esprey,2000; Sheikh & Marotta, 2005), two- (Sheikh & Marotta, 2005), three- (Joseph et al.,2005; Powell et al.,2003; Weiss & Berger,2006), four- (Ho et al.,2004; Maercker
& Langner,2001; Taku et al.,2007), andfive-factor (Anderson & Lopez-Baez,2008; Jaarsma et al.,2006; Linley, Andrews, & Joseph,2007; Morris, Shakespeare-Finch, Rieck, & Newbery, 2005; Teixeira & Pereira,2013) solutions have been identified. When conducting confirmatory factor analyses, the five-factor model of the PTGI showed the best-fit compared to other models tested in the same samples – supporting the original conception by Tedeschi and Calhoun (Brunet et al.,2010; Hooper, Marotta, & Depuy,2009; Linely et al.,2007; Prati & Pie- trantoni,2014; Taku, Cann, Calhoun, & Tedeschi,2008).
Because of the theoretically plausible and consistently found correlation among the five factors of the construct, the possible existence of an underlying general posttraumatic growth second-order factor has emerged (Joseph et al.,2005; Sheikh & Marotta,2005) that can generally assess the positive changes after a traumatic event. This concept led to a heterogeneous research practice where some researchers used only the total score of the PTGI to measure posttraumatic growth (Osei-Bonsu, Weaver, Eisen, & Van der Wal,2012; Scrignaro, Barni, Bonetti, & Magrin, 2011; Widows, Jacobsen, Booth-Jones, & Fields, 2005), while other researchers also used or preferred the subscale scores of the instrument (Morris et al., 2005; Taku et al., 2008).
However, the decision for whether the components of a construct can be analyzed apart from the main construct or not should be based on solid confirmatory factor analytic research evidence which–compared to the amount of published literature using this instrument–might be con- sidered scarce for the PTGI.
A possible way to clarify the relationships between the components and the main construct itself is to conduct a confirmatory factor analysis using a bifactor model (Gibbons, Immekus, Bock, & Gibbons, 2007). Similar to conventional second-order models, the bifactor model
enables the estimation of specific and general factors simultaneously (Mészáros, Ádám, Szabó, Szigeti, & Urbán, 2014). However, this kind of model applies a latent structure where all items load onto a general dimension and onto one of several specific factors at the same time (Figure 1) – considered a more realistic representation of a complex psychological construct (Reise, Scheines, Widaman, & Haviland, 2013). Contrary to the traditional first- and second- order models, the general and all the specific factors are uncorrelated in a bifactor model. Conse- quently, the general factor reflects what is common among the items and represents the individual differences of the target dimension, while the specific factors represent item response variance not accounted for by the general factor (Reise, Moore, & Haviland,2010). In this way, a bifactor model helps to determine whether domain-specific factors can be used in a meaningful way over and above the general factor, for instance, when predicting external variables.
Therefore, the main goal of our study was to test alternative confirmatory factor analytic models of posttraumatic growth – including bifactorial solutions – to better understand the
Figure 1. A bifactor model of the PTGI.
Health Psychology & Behavioural Medicine 531
dimensionality of the construct measured by the PTGI. Second, we intended to present data on the psychometric properties of the Hungarian adaptation of the instrument.
2. Methods
2.1. Sample and procedure
Our convenience sample consisted of 691 respondents, 310 (50.1%) of whom answered the ques- tionnaire in a paper–pencil format while the remaining answered electronically. The data were collected in Hungary between 2009 and 2012; participants were recruited using electronic mailing lists and social networking websites. Participation in the study was completely voluntary and anonymous. Seventy-two individuals (10.4%) of the sample did not complete the whole ques- tionnaire and their data were excluded from the analyses. In order to investigate the temporal stab- ility of the instrument, 35 individuals were selected randomly from the original sample to complete the questionnaire again six weeks after thefirst administration. Of these, 31 question- naires were returned (88.6% response rate).
Our sample consisted of 509 women (82.2%) and 110 men (17.8%). The age range was 18–82 years and the mean age was 33 years (SD = 13.4). Level of educational attainment in the sample was as follows: 15 participants (2.42%) had elementary level education or less, 18 (2.91%)fin- ished secondary vocational school, 414 (66.88%)finished secondary grammar school, and 110 (17.77%) graduated from college/university.
Two additional questions (see later in Section 2.2) administered before the standard items of the PTGI made it possible to gain information about the adverse/traumatic event the respondents experienced and the date it happened. Almost a third (29.1%) of the sample reported the death of a related person, 27.1% reported the break-up of an intimate relationship or divorce, 12.8% reported job loss, 8.9% mentioned the illness of a significant person, 8.9% indicated their own illness, 6.6% indicated family problems, 1.3% mentioned injury-producing accidents, 1.3% cited loss of home, and 4% reported a variety of other negative life events (e.g. being abused, being a victim of rape or violent robbery). Two hundred and twenty-two (35.86%) participants reported these events occurred less than 12 months before data collection, 110 (17.70%) between 13 and 24 months, 263 (42.49%) between 25 and 60 months, and 24 (3.88%) between 61 and 120 months.
2.2. Instruments
In addition to basic socio-demographic characteristics, the PTGI (Tedeschi & Calhoun,1996) was administered–a 21-item scale assessing possible positive changes that emerge after traumatic experiences. Items in this self-administered questionnaire were rated on a six-point Likert scale (0 =‘I did not experience this change as a result of my crisis’, 5 =‘I experienced this change to a very great degree as a result of my crisis’). Thus, the total score can range from 0 to 105, with higher scores indicating greater posttraumatic growth. Beforefilling in the PTGI, respon- dents were asked to answer the following questions as well:‘Think of the most negative experi- ence/trauma that happened to you in the past 5 years. First, please describe this event and then provide its date’.
When conducting the adaptation process of the instrument into Hungarian, efforts were made to follow the guidelines proposed by Wild et al. (2005). As afirst step, three independent pro- fessionals (psychologists with master or doctoral levels of education) translated the questionnaire into Hungarian, followed by the development of a consensual version by the same experts. This variant was back-translated into English by an additional independent translator. Tedeschi and
Calhoun’s team, the authors of the original questionnaire, have checked the back translation and suggested some minor changes that were incorporated in thefinal Hungarian version (the full text of this adaptation is available as supplemental material to this article on the publisher’s website, available athttp://dx.doi.org/10.1080/21642850.2014.905208).
2.3. Statistical analyses
In order to identify the factor structure that bestfits the data, a series of confirmatory factor ana- lyses were performed using maximum-likelihood parameter estimates with the Mplus 7.0 soft- ware (Muthén & Muthén, 2012). In addition to the most commonly investigated first- and second-order solutions, we tested the appropriateness of bifactor models as well. This latter kind of model allows for separating the role of the general and domain-specific factors as it–con- trary to traditional second-order models–allows all items to load directly onto a general factor (Posttraumatic Growth) as well as on a domain-specific factor (such as ‘Personal Strengths’or
‘Spiritual Change’). Some recent studies suggest that this measurement structure may be a more effective approach to model construct-relevant multidimensionality (Brunner, Nagy, &
Wilhelm,2012; Reise et al.,2010,2013) and can contribute to the clarification of inconsistent results on the factor structure of instruments designed to measure complex constructs (Mészáros et al.,2014).
Six models were tested based on accumulated contemporary research. Model 1 was a single factor solution with one general posttraumatic growth factor responsible for all 21-item responses (cf. Anderson & Lopez-Baez,2008; Joseph et al.,2005; Kovács, Balog, & Preisz,2012; Sheikh &
Marotta,2005). Model 2 was a three-factor solution representing the three main correlating con- tributing factors of posttraumatic growth: Self-Perception, Interpersonal Relationships, and Life Philosophy (cf. Anderson & Lopez-Baez,2008; Joseph et al.,2005; Powell et al.,2003; Weiss &
Berger,2006). Based on the work of the original test developers, Model 3 consisted offive cor- related factors contributing to posttraumatic growth: Relating to Others, New Possibilities, Per- sonal Strength, Spiritual Change, and Appreciation of Life (cf. Tedeschi & Calhoun, 1996).
Model 4 was a slightly revised form of Model 3 where, in addition to the five first-order factors, a second-order posttraumatic growth factor was also incorporated (cf. Taku et al., 2008).1Model 5 was a bifactor model, including the three components of Model 2 and the general factor. Finally, Model 6 was an additional bifactor model consisting of thefive factors from Model 3 and the general factor of posttraumatic growth (Figure 1).
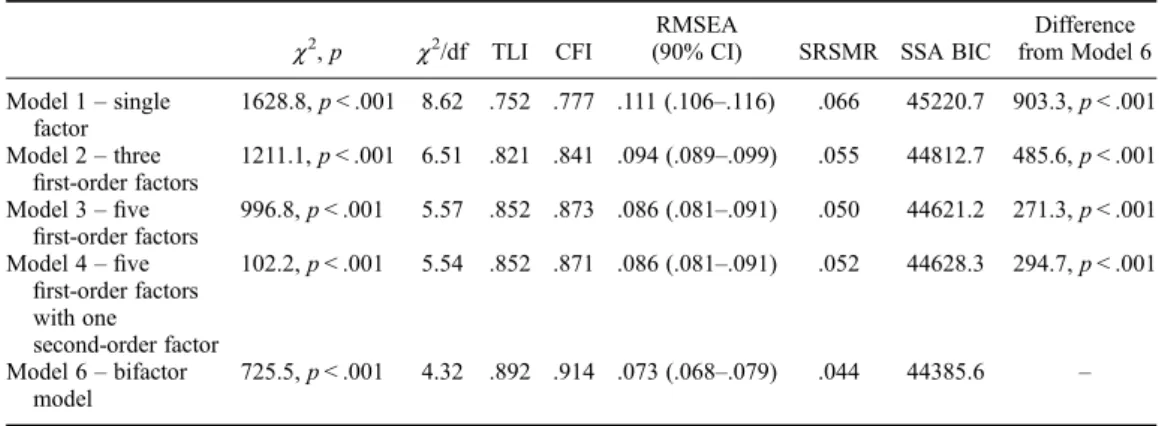
To compare the adequacy of the different models, severalfit indices were employed. Satisfac- tory degree offit requires the Comparative-Fit Index and the Tucker–Lewis Index to be higher than 0.90 (Hoyle,1995). The root mean square error of approximation below 0.05 indicates excel- lentfit, while a value below 0.08 indicates adequatefit (Browne & Cudeck,1993). The ideal value for the standardized root mean square residual is below 0.08 (Hu & Bentler,1999). Finally, Baye- sian information criteria were also reported, which do not have a clear cut-off; lower values mean betterfit (Hooper, Coughlan, & Mullen,2008).
Internal consistency was evaluated by calculating Cronbach’s alpha, omega total, and omega hierarchical coefficients (Zinbarg, Revelle, Yovel, & Li, 2005) for both the whole instrument and its dimensions according to the best fitting model. Omega total estimates the reliability of a latent factor combining the general and specific factor variance while omega hierarchical estimates the reliability of a latent factor with all other latent construct var- iance removed (Brunner et al.,2012), thus providing useful information on whether scores for a specific factor can be interpreted with confidence or only the total score (general factor score) should be used. Both kinds of omega coefficients were calculated using the Omega soft- ware (Watkins, 2013).
Health Psychology & Behavioural Medicine 533
The relationship of PTGI scores with demographic characteristics was evaluated using the Mann–Whitney test (sex) and Spearman correlation coefficients (age and educational attainment).
Non-parametric methods were used because of the slight deviation (skewness =−0.297, kurtosis
=−0.531) of the distribution of PTGI scores from the normal distribution according to the Shapiro–Wilk test (statistic = 0.98,p< .001). In the case of the significant Mann–Whitney stat- istic, effect size was calculated using the following formula:z/
√n .
3. Results
Descriptive statistics for the total and subscale scores are also displayed inTable 2. Total PTGI scores were independent of age (r=−.055,p= .174) and educational level (r= .047,p= .376), while females in the present sample (M= 55.18, SD = 22.45) reported significantly higher PTGI scores (U= 22346.5, p= .001) than their male counterparts (M= 47.13, SD = 23.67).
Respondents who completed the survey online (M= 58.32, SD = 20.18) also reached higher total scores (U= 37855, p< .001) than participants answering in paper–pencil format (M= 49.19, SD = 24.44). However, the magnitude of the sex and administration mode differences was negligible (effect sizerof .13 and .18, respectively).
The factor structure of the PTGI was evaluated using confirmatory factor analytic methods.
Table 1 presents thefit indices for the six tested models. Ourfindings suggest that a bifactor model with a 5 + 1 factor structure (Model 6) fits the data best resulting in a significantly betterfitting model compared to the other models (see the last column ofTable 1). Thefirst bifac- tor model with a 3 + 1 structure (Model 5) did not have interpretable modelfit information due to the emergence of negative variance estimates.
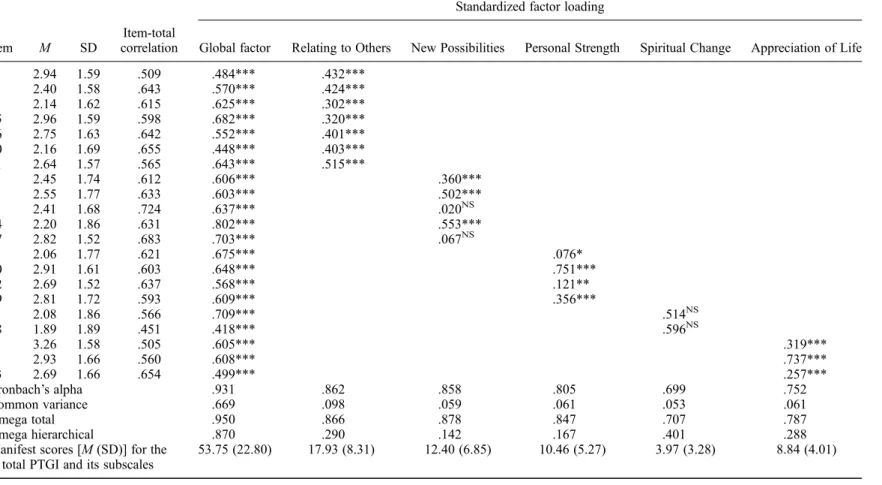
A detailed analysis (Table 2) of the structure for the bestfitting bifactor model revealed that all items loaded significantly onto the global posttraumatic growth factor; however, not all items loaded significantly with their specific domains, suggesting that these items may measure only global posttraumatic growth rather than ‘New Possibilities’ discovered after the traumatic event (Items 11 and 17) or ‘Spiritual Change’ (Items 5 and 18). Since the factor loading of these items on the main factor were quite strong–suggesting that these items represent valuable components of the construct, and the non-significant domain loading is not a result of item inade- quacy–we tested a further incomplete bifactor model. This model preserved the structure of Model 6 (Figure 1) with the exception of the domain measuring‘Spiritual Change’ –the items
Table 1. Modelfit indices for competing confirmatory factor analytic models of the PTGI.
χ2,p χ2/df TLI CFI
RMSEA
(90% CI) SRSMR SSA BIC
Difference from Model 6 Model 1–single
factor
1628.8,p< .001 8.62 .752 .777 .111 (.106–.116) .066 45220.7 903.3,p< .001 Model 2–three
first-order factors
1211.1,p< .001 6.51 .821 .841 .094 (.089–.099) .055 44812.7 485.6,p< .001 Model 3–five
first-order factors
996.8,p< .001 5.57 .852 .873 .086 (.081–.091) .050 44621.2 271.3,p< .001 Model 4–five
first-order factors with one
second-order factor
102.2,p< .001 5.54 .852 .871 .086 (.081–.091) .052 44628.3 294.7,p< .001
Model 6–bifactor model
725.5,p< .001 4.32 .892 .914 .073 (.068–.079) .044 44385.6 –
Notes: TLI, Tucker–Lewis Index; CFI, Comparative Fit Index; RMSEA, root mean square error of approximation;
SRSMR, standardized root mean square residual; SSA BIC, sample-size adjusted Bayesian information criterion.
Table 2. Descriptive statistics, reliability information, and fully standardized factor loadings from the bifactor confirmatory factor analytic model (Model 6) of the PTGI.
Standardized factor loading
Item M SD
Item-total
correlation Global factor Relating to Others New Possibilities Personal Strength Spiritual Change Appreciation of Life
6 2.94 1.59 .509 .484*** .432***
8 2.40 1.58 .643 .570*** .424***
9 2.14 1.62 .615 .625*** .302***
15 2.96 1.59 .598 .682*** .320***
16 2.75 1.63 .642 .552*** .401***
20 2.16 1.69 .655 .448*** .403***
21 2.64 1.57 .565 .643*** .515***
3 2.45 1.74 .612 .606*** .360***
7 2.55 1.77 .633 .603*** .502***
11 2.41 1.68 .724 .637*** .020NS
14 2.20 1.86 .631 .802*** .553***
17 2.82 1.52 .683 .703*** .067NS
4 2.06 1.77 .621 .675*** .076*
10 2.91 1.61 .603 .648*** .751***
12 2.69 1.52 .637 .568*** .121**
19 2.81 1.72 .593 .609*** .356***
5 2.08 1.86 .566 .709*** .514NS
18 1.89 1.89 .451 .418*** .596NS
1 3.26 1.58 .505 .605*** .319***
2 2.93 1.66 .560 .608*** .737***
13 2.69 1.66 .654 .499*** .257***
Cronbach’s alpha .931 .862 .858 .805 .699 .752
Common variance .669 .098 .059 .061 .053 .061
Omega total .950 .866 .878 .847 .707 .787
Omega hierarchical .870 .290 .142 .167 .401 .288
Manifest scores [M(SD)] for the total PTGI and its subscales
53.75 (22.80) 17.93 (8.31) 12.40 (6.85) 10.46 (5.27) 3.97 (3.28) 8.84 (4.01)
Note: NS, non-significant.
*p< .05.
**p< .01.
***p< .001.
HealthPsychology&BehaviouralMedicine535
loaded only onto the global factor in this solution–to represent the applicability of only the total score and the subscale scores of the other four components. However, similar to Models 1–5, this incomplete bifactor model also resulted in a worse modelfit compared to the complete bifactor solution of Model 6.
Temporal stability of the Hungarian adaptation was excellent; the test–retest analysis, con- ducted with a six-week time lag, revealed a very high correlation coefficient (r= .90,p< .01) between the total scores from the two measurement occasions. The same test–retest reliability coefficients for the subscales were slightly lower and ranged from .71 to .86 (in all cases, p< .01).
With regard to internal reliability, the traditional Cronbach’s alpha values were very good con- cerning the total scale and the subscales‘Relating to Others’,‘New Possibilities’, and‘Personal Strength’. In the case of‘Appreciation of Life’, the alpha value was still good but concerning
‘Spiritual Change’it was only acceptable (Table 2). The less traditional omega total indicator showed very similar results to those observed using the alpha coefficient: outstanding reliability for the latent general factor and the specific factors‘Relating to Others’,‘New Possibilities’, and
‘Personal Strength’. Again, in the case of‘Appreciation of Life’omega total was still appropriate, but for‘Spiritual Change’reliability was only acceptable. However, coefficient omega hierarch- ical, estimating reliabilities with the effects of all other factors removed, was considerably low for all specific factors (ranging from .14 to .40,p< .01 for all cases) and was high enough only for the general posttraumatic growth factor (Table 2). Data concerning variances showed a very similar pattern: while the general factor accounted for 66.9% of the common variance, the specific factors accounted for only 5.3–9.8% of the common variance (Table 2).
4. Discussion
Posttraumatic growth refers to positive psychological changes after highly challenging life crises or traumatic events which–according to previous research evidence over the past years–seems to be a phenomenon existing in several culturally substantially different parts of the world.
However, psychometric research on the instrument (PTGI) most widely used to measure this con- struct revealed substantial differences across samples concerning the factor structure and dimen- sionality of the PTGI. The aim of this study–in addition to presenting psychometric data on the instrument from another country: Hungary–was to offer an additional factor analytic model to better understand how the components of posttraumatic growth relate to each other and to provide further information regarding the appropriate use of the scale.
Results concerning the comparisons of alternative confirmatory factor analytic models revealed that a bifactor model–including a general posttraumatic growth factor andfive specific factors–namely Relating to Others, New Possibilities, Personal Strength, Spiritual Change, and Appreciation of Life–provided the best fit to the present data. If this bifactor solution, never before examined in the literature, is ignored, our results supported afive-factor model of the con- struct over a single- or a three-factor approach. However, it is worth noting that all three of these previously investigated alternative models clearly showed suboptimalfit for the present sample.
Item analysis of the instrument in the present sample confirmed that each questionnaire item contributed significantly to the measurement of the global posttraumatic growth construct indicat- ing adequate item composition. However, four items (Items 5, 11, 17, and 18) did not load sig- nificantly on their designated specific factor (‘New Possibilities’ and ‘Spiritual Change’) indicating that these items were more appropriate indicators of the global posttraumatic growth factor than their specific factors.
Examination of the reliability of the latent PTGI factors revealed that while the general post- traumatic growth factor had strong reliability estimates, omega hierarchical coefficients for the five specific PTGI factors were not high enough to support individual interpretation of these
subscales in subsequent research using the PTGI. Results concerning variances also showed that the specific factors did not make a strong contribution to the measurement of posttraumatic growth: the general factor accounted for an overwhelming proportion of total variance in the scores. Therefore, even though the traditional Cronbach’s alpha coefficients would allow the sep- arate use of the subdomains, results of the more subtle analyses only support the employment of the total (latent or manifest) PTGI score in future research.
The data of the present study also provided the opportunity to compare the descriptive data for the PTGI in Hungary versus other countries. Our data showed that the total scores reached by our respondents were in the middle of the range as defined by previous research: total PTGI scores found in the present sample were lower when compared to data, for example, from Australia (Morris et al., 2005), Canada (Brunet et al., 2010), or the USA (Sheikh &
Marotta, 2005; Tedeschi & Calhoun, 1996), while higher when considering reports from Germany (Maercker & Langner, 2001), the Netherlands (Jaarsma et al., 2006), or Turkey (Dirik & Karanci,2008), for instance. However, it is important to note that these comparisons can be viewed only as preliminary information on cultural differences since the large variabil- ity of the sample characteristics (type of adverse event experienced, time passed since trauma, demographic characteristics, etc.) hinder drawing reliable conclusions on this aspect of the results.
Limitations of the present investigation should also be noted. First, our sample was not repre- sentative of the Hungarian population–for instance, male and older individuals were underrepre- sented in our sample. Thus–even though these demographic variables showed no or very weak association with PTGI scores–the generalizability of ourfindings is uncertain even for this par- ticular country. Further–although it is a common weakness of research using the PTGI–this study also missed gathering unambiguous information on whether an individual experienced (one or more) trauma(s) as defined by the Diagnostic and Statistical Manual of Mental Disorders in relation to posttraumatic stress disorder (e.g. sexual abuse, serious threat to life) or merely a less decisive although still negative event (e.g. losing an old relative, becoming unemployed). Finally, the electronic and the paper–pencil format of data collection provided different conditions to our subjects which also might have influenced our results. Although it would be possible to investi- gate the invariance of the factor structures across modes of data collection using multi-group ana- lyses, the number and complexity (particularly that of the bifactor models) of these analyses are beyond the scope of this paper.
We can conclude that ourfindings support the psychometric adequacy of the Hungarian adap- tation of the PTGI measuring posttraumatic growth after ‘psychologically seismic’ events (Tedeschi & Calhoun,1996; Zoellner & Maercker, 2006). Similar to the conclusion by Osei- Bonsu et al. (2012), our results also indicate that only the total and not the subscale scores of the PTGI should be used in subsequent research using this instrument. Further cross-cultural studies are needed to confirm ourfindings regarding the appropriate use of total versus subscale scores to assess positive changes in people who experienced loss and trauma. Subsequent studies should also investigate whether the inclusion of further items (for example, in the very short‘Spiri- tual Change’ subscale) or the omission of some existing items would contribute to a more stable factor structure and thus more reliable and valid assessment of posttraumatic growth with the PTGI.
Acknowledgement
Thefirst author gratefully acknowledges thefinancial support of the Norlien Foundation and the IMPART program (Intersections of Mental Health Perspectives in Addictions Research Training) funded by the Cana- dian Institutes of Health Research.
Health Psychology & Behavioural Medicine 537
Note
1. A hierarchical (second-order) structure was not tested in case of the three-factor solution (Model 2) because with less than four factors, no statistical difference can be expected between a second-order model and a model with correlatedfirst-order factors (Geiser,2012).
References
Anderson Jr, W. P., & Lopez-Baez, S. I. (2008). Measuring growth with the Posttraumatic Growth Inventory.
Measurement and Evaluation in Counseling and Development,40(4), 215–227.
Browne, M. W., & Cudeck, R. (1993). Alternative ways of assessing modelfit. In K. A. Bollen & J. S. Long (Eds.),Testing structural equation models(pp. 136–162). Newbury Park, CA: Sage.
Brunet, J., McDonough, M. H., Hadd, V., Crocker, P. R. E., & Sabiston, C. M. (2010). The Posttraumatic Growth Inventory: An examination of the factor structure and invariance among breast cancer survivors.
Psycho-Oncology,19(8), 830–838.
Brunner, M., Nagy, G., & Wilhelm, O. (2012). A tutorial on hierarchically structured constructs.Journal of Personality,80(4), 796–846.
Cann, A., Calhoun, L. G., Tedeschi, R. G., Taku, K., Vishnevsky, T., Triplett, K. N., & Danhauer, S. C.
(2010). A short form of the Posttraumatic Growth Inventory.Anxiety, Stress & Coping,23(2), 127–137.
Cryder, C. H., Kilmer, R. P., Tedeschi, R. G., & Calhoun, L. G. (2006). An exploratory study of posttrau- matic growth in children following a natural disaster. American Journal of Orthopsychiatry, 76(1), 65–69.
Dirik, G., & Karanci, A. N. (2008). Variables related to posttraumatic growth in Turkish rheumatoid arthritis patients.Journal of Clinical Psychology in Medical Settings,15(3), 193–203.
Engelkemeyer, S. M., & Marwit, S. J. (2008). Posttraumatic growth in bereaved parents. Journal of Traumatic Stress,21(3), 344–346.
Feder, A., Southwick, S. M., Goetz, R. R., Wang, Y., Alonso, A., Smith, B. W.,…Vythilingam, M. (2008).
Posttraumatic growth in former Vietnam prisoners of war.Psychiatry,71(4), 359–370.
Gao, J., Wang, M., Deng, J., Qian, M., Liu, X., & He, Q. (2010). Revision and preliminary application of Chinese version of Post-traumatic Growth Inventory in adolescents experienced the Wenchuan earth- quake.Chinese Mental Health Journal,24(2), 126–130.
Geiser, Ch. (2012).Data analysis with Mplus. Methodology in the social sciences. New York: Guilford.
Gibbons, R. D., Immekus, J. C., Bock, R. D., & Gibbons, R. D. (2007).The added value of multidimensional IRT models.Chicago: Center for Health Statistics, University of Illinois.
Ho, S. M. Z., Chan, C. L. W., & Ho, R. T. H. (2004). Posttraumatic growth in Chinese cancer survivors.
Psychology,13, 377–389.
Hooper, D., Coughlan, J., & Mullen, M. R. (2008). Structural equation modelling: Guidelines for determin- ing modelfit.Electronic Journal of Business Research Methods,6(1), 53–60.
Hooper, L. M., Marotta, S. A., & Depuy, V. (2009). A confirmatory factor analytic study of the Posttraumatic Growth Inventory among a sample of racially diverse college students.Journal of Mental Health,18(4), 335–343.
Hoyle, R. H. (1995). The structural equation modeling approach: Basic concepts and fundamental issues. In R. H. Hoyle (Ed.), Structural equation modeling. Concepts, issues, and applications (pp. 1–15).
Thousand Oaks, CA: Sage.
Hu, L. T., & Bentler, P. M. (1999). Cutoff criteria for fit indexes in covariance structure analysis:
Conventional criteria versus new alternatives.Structural Equation Modeling,6(1), 1–55.
Jaarsma, T. A., Pool, G., Sanderman, R., & Ranchor, A. V. (2006). Psychometric properties of the Dutch version of the Posttraumatic Growth Inventory among cancer patients.Psycho-Oncology,15, 911–920.
Joseph, S., Linley, P. A., & Harris, G. J. (2005). Understanding positive change following trauma and adver- sity: Structural clarification.Journal of Loss and Trauma,10(1), 83–96.
Kaler, M. E., Erbes, C. R., Tedeschi, R. G., Arbisi, P. A., & Polusny, M. A. (2011). Factor structure and con- current validity of the Posttraumatic Growth Inventory–Short form among veterans from the Iraq War.
Journal of Traumatic Stress,24(2), 200–207.
Kilmer, R. P., Gil-Rivas, V., Tedeschi, R. G., Cann, A., Calhoun, L. G., Buchanan, T., & Taku, K. (2009). Use of the revised Posttraumatic Growth Inventory for children.Journal of Traumatic Stress,22(3), 248– 253.
Kovács, É., Balog, P., & Preisz, L. (2012). A Poszttraumás Növekedésérzés Kérdőív pszichometriai mutatói hazai mintán [Psychometric characteristics of the Posttraumatic Growth Inventory in a Hungarian sample].Mentálhigiéné és Pszichoszomatika,13(1), 53–87.
Lamela, D., Figueiredo, B., Bastos, A., & Martins, H. (2014). Psychometric properties of the Portuguese version of the Posttraumatic Growth Inventory short form among divorced adults.European Journal of Psychological Assessment,30(1), 3–14.
Lau, J. T. F., Yeung, N. C. Y., Yu, X., Zhang, J., Mak, W. W. S., Lui, W. W. S., & Zhang, J. (in press).
Psychometric properties of the Chinese version of the revised Posttraumatic Growth Inventory for chil- dren (PTGI-C-R).Asia-Pacific Journal of Public Health.doi:10.1177/1010539513479967
Lev-Wiesel, R., & Amir, M. (2003). Posttraumatic growth among holocaust child survivors.Journal of Loss and Trauma,8(4), 229–237.
Linley, P. A., Andrews, L., & Joseph, S. (2007). Confirmatory factor analysis of the Posttraumatic Growth Inventory. Journal of Loss and Trauma,12, 321–332.
Maercker, A., & Langner, R. (2001). Persönliche Reifung (personal growth) durch Belastungen und Traumata: Validierung zweier deutschsprachiger Fragebogenversionen [Posttraumatic personal growth: Validation of German versions of 2 questionnaires.].Diagnostica,47(3), 153–162.
Maercker, A., & Zoellner, T. (2004). The Janus face of self-perceived growth: Toward a two-component model of posttraumatic growth.Psychological Inquiry,15, 41–48.
Mészáros, V., Ádám, Sz., Szabó, M., Szigeti, R., & Urbán, R. (2014). The bifactor model of the Maslach Burnout inventory–Human services survey–An alternative measurement model of burnout.Stress and Health,30(1), 82–88.
Morris, B. A., Shakespeare-Finch, J., Rieck, M., & Newbery, J. (2005). Multidimensional nature of posttrau- matic growth in an Australian population.Journal of Traumatic Stress,18, 575–585.
Muthén, L. K., & Muthén, B. O. (2012).Mplus. Los Angeles, CA: Muthén & Muthén.
Nightingale, V. R., Sher, T. G., & Hansen, N. B. (2010). The impact of receiving an HIV diagnosis and cog- nitive processing on psychological distress and posttraumatic growth.Journal of Traumatic Stress,23 (4), 452–460.
Nishi, D., Matsuoka, Y., & Kim, Y. (2010). Posttraumatic growth, posttraumatic stress disorder and resilience of motor vehicle accident survivors.BioPsychoSocial Medicine,4, 7.
Osei-Bonsu, P. E., Weaver, T. L., Eisen, S. V., & Van der Wal, J. S. (2012). Posttraumatic Growth Inventory:
Factor structure in the context of DSM-IV traumatic events.ISRN Psychiatry(article ID 937582).doi:10.
5402/2012/937582
Polatinsky, S., & Esprey, Y. (2000). An assessment of gender differences in perception of benefit resulting from the loss of a child.Journal of Traumatic Stress,13(4), 709–718.
Posta, E. (2010). The narrative process and the stories of family members who lost loved ones on 9/11.The Sciences and Engineering,71(5-B), 3366.
Powell, S., Rosner, R., Butollo, W., Tedeschi, R. G., & Calhoun, L. G. (2003). Posttraumatic growth after war: A study with former refugees and displaced people in Sarajevo.Journal of Clinical Psychology, 59, 71–83.
Prati, G., & Pietrantoni, L. (2014). Italian adaptation and confirmatory factor analysis of the full and the short form of the Posttraumatic Growth Inventory.Journal of Loss and Trauma,19(1), 12–22.
Reise, S. P., Moore, T. M., & Haviland, M. G. (2010). Bifactor models and rotations: Exploring the extent to which multidimensional data yield univocal scale scores. Journal of Personality Assessment, 92(6), 544–559.
Reise, S. P., Scheines, R., Widaman, K. F., & Haviland, M. G. (2013). Multidimensionality and structural coefficient bias in structural equation modeling: A bifactor perspective. Educational and Psychological Measurement,73(1), 5–26.
Salo, J., Punamaki, R.-L., Qouta, S., & El Sarraj, E. (2008). Individual and group treatment and self and other representations predicting posttraumatic recovery among former political prisoners.Traumatology,14 (2), 45–61.
Scrignaro, M., Barni, S., Bonetti, M. L., & Magrin, M. E. (2011). Studying predictors of posttraumatic growth in cancer patients. In I. Brdar (Ed.),The human pursuit of well-being(pp. 83–91). Dordrecht:
Springer.
Sheikh, A. I., & Marotta, S. A. (2005). A cross-validation study of the Posttraumatic Growth Inventory.
Measurement and Evaluation in Counseling and Development,38(2), 66–77.
Taku, K., Calhoun, L. G., Tedeschi, R. G., Gil-Rivas, V., Kilmer, R. P., & Cann, A. (2007). Examining post- traumatic growth among Japanese university students.Journal of Japanese Clinical Psychology,20(4), 353–367.
Health Psychology & Behavioural Medicine 539
Taku, K., Cann, A., Calhoun, L. G., & Tedeschi, R. G. (2008). The factor structure of the Posttraumatic Growth Inventory: A comparison of five models using confirmatory factor analysis. Journal of Traumatic Stress,21(2), 158–164.
Taku, K., Kilmer, R. P., Cann, A., Tedeschi, R. G., & Calhoun, L. G. (2012). Exploring posttraumatic growth in Japanese youth.Psychological Trauma: Theory, Research, Practice, and Policy,4(4), 411–419.
Tedeschi, R. G., & Calhoun, L. G. (1996). The Posttraumatic Growth Inventory: Measuring the positive legacy of trauma.Journal of Traumatic Stress,9(3), 455–471.
Teixeira, R. J., & Pereira, M. G. (2013). Growth and the cancer caregiving experience: Psychometric prop- erties of the Portuguese Posttraumatic Growth Inventory.Families, Systems & Health,31(4), 382–395.
Teodorescu, D. S., Siqveland, J., Heir, T., Hauff, E., Wentzel-Larsen, T., & Lien, L. (2012). Posttraumatic growth, depressive symptoms, posttraumatic stress symptoms, post-migration stressors and quality of life in multi-traumatized psychiatric outpatients with a refugee background in Norway. Health and Quality of Life Outcomes,10, 84.
Watkins, M. W. (2013). Omega. Retrieved April 9, 2013, from http://edpsychassociates.com/Software/
Omega.zip
Weiss, T., & Berger, R. (2006). Reliability and validity of a Spanish version of the Posttraumatic Growth Inventory.Research on Social Work Practice,16(2), 191–199.
Widows, M. R., Jacobsen, P. B., Booth-Jones, M., & Fields, K. K. (2005). Predictors of posttraumatic growth following bone marrow transplantation for cancer.Health Psychology,24(3), 266–273.
Wild, D., Grove, A., Martin, M., Eremenco, S., McElroy, S., Verjee-Lorenz, A., & Erikson, P. (2005).
Principles of good practice for the translation and cultural adaptation process for patient-reported out- comes (PRO) measures: Report of the ISPOR Task Force for translation and cultural adaptation.
Value in Health,8(2), 94–104.
Zinbarg, R. E., Revelle, W., Yovel, I., & Li, W. (2005). Cronbach’s alpha, Revelle’s beta, and McDonald’s omega h: Their relations with each other and two alternative conceptualizations of reliability.
Psychometrika,70, 123–133.
Zoellner, T., & Maercker, A. (2006). Posttraumatic growth in clinical psychology–A critical review and introduction of a two component model.Clinical Psychology Review,26(5), 626–653.
Zwahlen, D., Hagenbuch, N., Carley, M. I., Jenewein, J., & Buchi, S. (2010). Posttraumatic growth in cancer patients and partners–Effects of role, gender and the dyad on couples’posttraumatic growth experience.
Psycho-Oncology,19(1), 12–20.