The Jour nal of P hysiology
RAAS inhibitors directly reduce diabetes-induced renal fibrosis via growth factor inhibition
Sandor Koszegi1, Agnes Molnar1,2 , Lilla Lenart1, Judit Hodrea1, Dora Bianka Balogh1,2, Tamas Lakat1, Edgar Szkibinszkij1,3, Adam Hosszu1,2, Nadja Sparding4,5 , Federica Genovese4, Laszlo Wagner3, Adam Vannay6, Attila J Szabo2,6and Andrea Fekete1,2
1MTA-SE “Lend¨ulet” Diabetes Research Group, Hungarian Academy of Sciences and Semmelweis University, Budapest, Hungary
21st Department of Paediatrics, Semmelweis University, Budapest, Hungary
3Department of Transplantation and Surgery, Semmelweis University, Budapest, Hungary
4Nordic Bioscience, Biomarkers & Research, Herlev, Denmark
5Biomedical Sciences, Faculty of Health and Medical Science, University of Copenhagen, Copenhagen, Denmark
6MTA-SE Paediatrics and Nephrology Research Group, Hungarian Academy of Sciences and Semmelweis University, Budapest, Hungary
Edited by: Laura Bennet & Robert Fenton
Key points
r
Increased activation of the renin-angiotensin-aldosterone system (RAAS) and elevated growth factor production are of crucial importance in the development of renal fibrosis leading to diabetic kidney disease.r
The aim of this study was to provide evidence for the antifibrotic potential of RAAS inhibitor (RAASi) treatment and to explore the exact mechanism of this protective effect.r
We found that RAASi ameliorate diabetes-induced renal interstitial fibrosis and decrease profibrotic growth factor production.r
RAASi prevents fibrosis by acting directly on proximal tubular cells, and inhibits hyperglycaemia-induced growth factor production and thereby fibroblast activation.r
These results suggest a novel therapeutic indication and potential of RAASi in the treatment of renal fibrosis.Abstract In diabetic kidney disease (DKD) increased activation of renin-angiotensin-aldosterone system (RAAS) contributes to renal fibrosis. Although RAAS inhibitors (RAASi) are the gold standard therapy in DKD, the mechanism of their antifibrotic effect is not yet clarified. Here we tested the antifibrotic and renoprotective action of RAASi in a rat model of streptozotocin-induced DKD. In vitrostudies on proximal tubular cells and renal fibroblasts were also performed to further clarify the signal transduction pathways that are directly altered by hyperglycaemia.
After 5 weeks of diabetes, male Wistar rats were treated for two more weeks per os with the
S´andor K˝oszegigraduated with a degree in molecular biology at the University of Debrecen. In 2011 he started to work in the MTA-SE “Lend¨ulet” Diabetes Research Group investigating the molecular mechanism of diabetes induced chronic kidney disease and ischaemia-reperfusion induced acute renal failure. He is also interested in imaging techniques, such as optical and confocal microscopy and image processing. ´Agnes Moln´arjoined the MTA-SE “Lend¨ulet” Diabetes Research Group in 2013 as a student researcher investigating O-linkedN-acetylglucosamine modification in diabetic kidney disease. After receiving her medical degree at Semmelweis University in 2017, she enrolled in a PhD programme. Her research field is chronic diabetic complications, with special interests in renal and cardiac fibrosis. She aims to become a practicing pediatrician and to stay in academic research as well.
S. Koszegi and A. Molnar contributed equally to this work.
C2018 The Authors.The Journal of Physiologypublished by John Wiley & Sons Ltd on behalf of The Physiological Society DOI: 10.1113/JP277002
RAASi ramipril, losartan, spironolactone or eplerenone. Proximal tubular cells were cultured in normal or high glucose (HG) medium and treated with RAASi. Platelet-derived growth factor (PDGF) or connective tissue growth factor (CTGF/CCN2)-induced renal fibroblasts were also treated with various RAASi. In diabetic rats, reduced renal function and interstitial fibrosis were ameliorated and elevated renal profibrotic factors (TGFβ1, PDGF, CTGF/CCN2, MMP2, TIMP1) and alpha-smooth muscle actin (αSMA) levels were decreased by RAASi. HG increased growth factor production of HK-2 cells, which in turn induced activation andαSMA production of fibroblasts. RAASi decreased tubular PDGF and CTGF expression and reduced production of extracellular matrix (ECM) components in fibroblasts. In proximal tubular cells, hyperglycaemia-induced growth factor production increased renal fibroblast transformation, contributing to the development of fibrosis. RAASi, even in non-antihypertensive doses, decreased the production of profibrotic factors and directly prevented fibroblast activation. All these findings suggest a novel therapeutic role for RAASi in the treatment of renal fibrosis.
(Received 16 August 2018; accepted after revision 15 October 2018; first published online 16 October 2018)
Corresponding authorAndrea Fekete: 1st Department of Paediatrics, Semmelweis University, B ´okay J´anos u. 53–54.
Budapest H-1083, Hungary. Email: fekete.andrea@med.semmelweis-univ.hu
Introduction
Diabetes mellitus (DM) is a major health concern, impairing the quality of life and diminishing the life expectancy of millions of people (International Diabetes Federation, 2017). Diabetic kidney disease (DKD) affects more than 20% of all diabetic patients, and due to limited therapeutic options it remains the leading cause of chronic kidney disease (CKD) (Saranet al.2018). Current treatment strategies may hinder kidney injury, but are unable to stop the progression into CKD (Solis-Herrera et al. 2014). Therefore, a better understanding of the molecular mechanisms involved in the pathophysiology of DKD is needed in the research for novel therapeutic concepts.
The progression of DKD is caused by haemodynamic and metabolic changes leading to structural and functional alterations. Structural changes, starting with glomerular basement membrane thickening and mesangial matrix expansion, gradually progress into glomerulosclerosis and interstitial fibrosis, and result in glomerular hyper- filtration and microalbuminuria (Tervaert et al. 2010).
Chronic and uncontrolled hyperglycaemia increases the production of several profibrotic factors such as transforming growth factor β (TGFβ), platelet-derived growth factor (PDGF), and connective tissue growth factor/CCN family (cysteine-rich 61, connective tissue growth factor, nephroblastoma overexpressed) member 2 (CTGF/CCN2), and contributes to fibrotic connective tissue accumulation characterised by elevated fibronectin and collagen levels (Garud & Kulkarni, 2014). Fibroblasts are the main effector cells of fibrosis and their activation is indicated by alpha-smooth muscle actin (αSMA) production. When activated, they serve as primary collagen-producing cells and contribute to extracellular matrix (ECM) accumulation (Wynn, 2008). In this
state the balance of ECM dynamics is disturbed as the rate of production exceeds the rate of degradation and therefore ECM components such as type I and type III collagen, fibronectin and matrix metalloproteinases (MMPs) accumulate (Kolsetet al.2012).
The formation and degradation of ECM components lead to specific pro-collagen terminal fragments and protein neo-epitopes secreted into urine (Genoveseet al.
2014), which have recently been discovered as novel, early urinary biomarkers of renal fibrosis. Two of them are neo-epitopes of MMP-9-mediated degradation of type III collagen (C3M) and type IV collagen alpha 3 chain known as tumstatin (TUM) (Genoveseet al.2016; Nielsen et al.2018). Numerous recent studies have confirmed the association of urinary C3M (uC3M) with renal fibrosis in different rat models including 5/6 Nx, anti-Thy 1.1, adenine nephropathy and type 2 diabetic nephropathy models (Papasotiriouet al.2015; Doweret al.2017). In a proteinuria-driven rat model, uC3M levels were elevated and measurable even before being histologically detectable (Hijmanset al.2017). In type 1 diabetes these markers have not been tested yet and the effect of RAASi treatment on their excretion has not been investigated either.
Until recently glomeruli were considered to be the primary sites of DKD, but an increasing body of evidence shows that hyperglycaemia-induced tubulointerstitial lesions have a prominent causative role as well. Hyper- glycaemia increases tubular glucose load and leads to tubular hyperplasia and hypertrophy through early functional changes like primary proximal tubular hyper- reabsorption. Increased DNA synthesis induces the trans- ition to senescence where local pro-inflammatory cytokine release, growth factor production and ECM components form a basis of tubulointerstitial fibrosis (Vallon, 2011).
Available therapeutic strategies are inefficient in pre- venting the progression of kidney injury (Karihaloo,
2012), and therefore novel treatment options are definitely needed.
Several studies demonstrate that various RAASi effectively decrease renal functional and structural damage in DM (Mifsud et al. 2001; Osicka et al. 2001; Gellai et al.2016). Some of these highlight the exceptional role of aldosterone antagonists (Tairaet al.2008; Bankiet al.
2012), although the molecular pathways involved in their renoprotective effect are still not fully understood.
The aim of the present study was to understand the underlying mechanisms involved in DM-induced renal fibrosis and to investigate the potential antifibrotic effect of RAASi. Furthermore, the effects of RAASi on proximal tubular epithelial cells and on renal fibroblasts were studied to explore their direct renoprotective potential.
Methods Ethical approval
All animal procedures were approved by the Committee on the Care and Use of Laboratory Animals of the Council on Animal Care at Semmelweis University, Budapest, Hungary (PEI/001/380-4/2013) and conform to the principles and regulations ofThe Journal of Physiology.
The investigators state their confirmation of compliance with the ethical principles under which The Journal of Physiologyoperates and that our work complies with its animal ethics checklist.
Materials
All chemicals were purchased from Sigma-Aldrich (Darmstadt, Germany) unless stated otherwise, and all standard plastic laboratory equipment was purchased from Sarstedt (N¨umbrecht, Germany).
Animals, induction of diabetes and experimental groups
Six-week-old male Wistar rats (Rattus norvegicus, RGD Cat. No. 13508588, RRID:RGD 13508588) were purchased from “Toxi-Coop” Toxicological Research Centre (Dunakeszi, Hungary) and kept in plastic cages under 12-hour dark/light cycle at constant temperature (24± 0.2°C) withad libitumaccess to standard rodent chow and drinking water. Diabetes was induced with a singleI.P. injection of 65 mg (kg body wt)−1streptozotocin (STZ), dissolved in 0.1 M citrate buffer (pH 4.5). Blood glucose levels were measured three times from the tail vein after an overnight fast with a D-Cont IDEAL device (77 Elektronika, Budapest, Hungary). Animals were considered diabetic if peripheral blood glucose level was above 15 mmol L−1 72 h after the STZ injection and
remained elevated. Five weeks after the induction of diabetes rats were randomised into five groups (n=7–8 animals/group) and were treated daily by oral gavage for 2 weeks either with: (i) isotonic saline as vehicle (D); or (ii) ramipril (D+ramipril, 10μg (kg body wt)−1day−1);
losartan (D + losartan, 20 mg (kg body wt)−1 day−1);
spironolactone (D + spironolactone, 50 mg (kg body wt)−1 day−1) or eplerenone (D+eplerenone, 50 mg (kg body wt)−1day−1). Doses were adopted from our previous studies in line with literary data where effective blockade of angiotensin-converting enzyme (ACE), angiotensin II receptor 1 (AT1) or aldosterone activity was achieved without changes in systemic blood pressure (Taira et al.
2008; Failliet al.2009; Bankiet al.2012). Non-diabetic, age-matched animals (control; n = 8 animals/group) received equivalent volumes of citrate buffer without STZ once, and the same amount of saline by oral gavage daily, at the same time as the diabetic animals throughout the 2-week treatment period. At the end of the experimental protocol rats were anaesthetised by a mixture of 75 mg (kg body wt)−1 ketamine (Richter Gedeon, Budapest, Hungary) and 10 mg (kg body wt)−1 xylazine (Medicus Partner, Biatorbagy, Hungary) administeredI.P., after which breathing and cardiac function decreased and terminal blood was drawn from the abdominal aorta to kill the animals. Blood, urine and kidney samples were collected and stored for further investigations.
Arterial blood pressure
Systolic and diastolic blood pressures were measured on the tail vein and mean arterial pressure was calculated using a CODA tail cuff standard monitoring system (EMKA Technologies, Paris, France), which uses proprietary volume pressure recording, a clinically validated technology (Kurtzet al.2005).
Metabolic and renal parameters
Body and kidney weights were measured, and kidney-to- body weight ratio and creatinine clearance were calculated.
Serum metabolic (glucose, fructosamine) and renal (blood urea nitrogen, creatinine) parameters were determined with commercially available kits on a Hitachi 912 chemistry analyser (Roche Hitachi, Basel, Switzerland).
Renal histology and morphometric analysis
Kidneys were fixed in 4% buffered formalin, embedded in paraffin and 5μm thick sections were taken.
Glomerular hypertrophy was determined in periodic acid-Schiff (PAS)-stained sections as previously described (Degrell et al. 2009) by measuring 20 glomerular tuft areas at 400×magnification from each animal, excluding incomplete glomeruli along the sample edge. The number
of pixels containing purple mesangial matrix deposition was divided by the total number of pixels in the glomerulus to obtain the percentage area of mesangial matrix deposition.
Tubulointerstitial fibrosis was evaluated in Masson’s trichrome-stained sections and Picrosirius Red staining was performed for supplemental fibrosis. Ten areas at 200× (Masson’s) or 100× (Picrosirius) magnification from each kidney cross-section were randomly selected and specifically stained interstitial areas were measured.
The number of pixels containing stained fibrotic tissue was divided by the total number of pixels in the area to obtain the percentage of tubulointerstitial fibrosis and collagen deposition.
Areas were measured with Panoramic Viewer software version 1.15.2 (3DHISTECH, RRID: SCR 016296).
Analysis was performed in a double blinded fashion with computer-assisted morphometry using Adobe Photo- shop CS6 (Adobe Systems, RRID:SCR 014199) and Scion Image software version 1.49 (National Institutes of Health, RRID:SCR 008673).
Cell cultures and treatments
Human kidney 2 proximal tubular epithelial (HK-2) cells (LGC Standards, ATCC Cat. No. CRL-2190, RRID:CVCL 0302) were cultured in DMEM containing 5.5 mM glucose (Gibco, supplied by Life Technologies, Carlsbad, CA, USA) and normal rat kidney fibroblast (NRK-49F) cells (LGC Standards, ATCC Cat. No.
CRL-1570, RRID:CVCL 2144) were maintained in DMEM containing 25 mM glucose (Gibco), both supplemented with 10% FBS (Gibco), 1% penicillin/
streptomycin and 1% L-glutamine, and incubated at 5%
CO2and 37°C. Before the treatments, HK-2 and NRK-49F cells were plated in 6-well plates (5 × 10⁵ cells/well) for 24 h in serum-free medium. In the case of HK-2 cells, the medium was changed and cells were kept under normal (control; 5.5 mM) or high glucose (HG;
35 mM) conditions for 24 h. HG groups were treated with either 10μM ramipril (HG+ramipril), or 10μM losartan (HG + losartan), or 200 nM spironolactone (HG + spironolactone), or 10 μM eplerenone (HG + eplerenone). Control cells were treated with vehicle (DMSO) alone (n = 6 wells/group). Drug doses were adopted from the literature (Oroszlan et al. 2010;
Wei et al. 2013; Xiao et al. 2016) and their non-toxic properties were tested by viability assays (data not shown).
NRK-49F cells were treated with PDGF (10 ng mL−1) or CTGF/CCN2 (10 ng mL−1) and with various RAASi as described above. In pilot studies the most effective proliferative doses were determined from different PDGF and CTGF/CCN2 concentration series by proliferative assays (data not shown). Cells were subsequently
incubated at 5% CO2 and 37°C, detached with 0.25%
trypsin-EDTA (Gibco) and lysed with the same buffers that were used for kidney homogenates.
To differentiate between the effect of direct glucotoxicity and the osmotic effect of high glucose (HG), HK-2 cells were cultured in normal (5.5 mM) or HG (35 mM) media, as well as in isosmotic control mannitol (5.5 mM glucose+ 29.5 mM mannitol).
Biomarkers of ECM formation and degradation The biomarkers uC3M (measuring collagen type III fragment degraded by MMP-9), rPRO-C3 (measuring type III collagen formation) and TUM (measuring tumstatin, a collagen type IV fragment degraded by MMP-9) were measured in rat urine samples. FBN-C (measuring C-terminal of fibronectin turnover) and PRO-C4 (measuring type IV collagen formation) were measured in HK-2 and NRK-49F cell supernatant samples, using competitive enzyme-linked immunosorbent assays (ELISAs) developed by Nordic Bioscience (Herlev, Denmark). To normalize for urine output, levels were divided by urinary creatinine levels measured with the QuantiChromTM Creatinine kit (BioAssay Systems). The assays were carried out at Nordic Bioscience laboratories following previously described protocols (Leeminget al.
2013; Nielsenet al.2013, 2018; Bageret al.2016; Genovese et al. 2016). Briefly, astreptavidin-coated 96-well ELISA plates (Roche, Cat. No. 11940279) were coated with 100μL biotinylated peptide for 30 min at 20°C. Plates were washed five times in washing buffer followed by incubation with 20 μL standard peptide or sample together with HRP-conjugated monoclonal antibody and incubated for 20 h at 4°C (uC3M, rPRO-C3, FBN-C) or 1 h at 20°C (TUM, PRO-C4). Plates were washed five times followed by incubation with 100μL 3,3ʹ,5,5-tetramethylbenzidine (Kem-En-Tec, Cat. No. 4380H, Taastrup, Denmark) for 15 min at 20°C in the dark. To stop the reaction, 1%
sulfuric acid solution was added, and plates were analysed with the ELISA reader at 450 nM, with 650 nm as reference (VersaMax, Molecular Devices, CA, USA).
Fluorescent immunohistochemistry
Frozen kidney sections were embedded in Shandon cryomatrix (Thermo Fisher Scientific, Waltham, MA, USA) and cut into 10-μm slices with a cryostat.
NRK-49F cells were cultured in tissue culture chambers.
After repeated washes with PBS, cells were fixed in 4% formalin, washed again, and permeabilised with Triton X-100. Samples were incubated for 2 h with specific primary antibodies: anti-αSMA (Sigma-Aldrich, Cat. No. A2547, RRID:AB 476701) diluted 1:1000 or anti-PDGFR-β (Santa Cruz Biotechnology, Cat.
No. sc-432, RRID:AB 631068) diluted 1:100. After
repeated washes, slides were incubated with specific secondary antibodies: goat anti-mouse IgG Alexa fluor 488 (Thermo Fisher Scientific, Cat. No. A-11001, RRID:AB 2534069) diluted 1:100 or goat anti-rabbit Alexa fluor 568 (Thermo Fisher Scientific, Cat. No.
A-11036, RRID:AB 10563566) diluted 1:100. F-actin was immunostained by incubation with phalloidin-TRITC diluted 1:300 for 1 h at room temperature. Samples were counterstained with Hoechst 33342 (Cell Signaling Technology, Cat. No. 4082S, RRID:AB 10626776) diluted 1:1000 to visualise nuclei. Appropriate controls were pre- pared omitting the primary antibody to assure specificity and to avoid autofluorescence. After being dried, sections were fixed with Vectashield Mounting Medium (Vector Laboratories, Cat. No. H-1000, RRID:AB 2336789).
Coverslipped slides were analysed with a Zeiss LSM 510 Meta confocal laser scanning microscope (LSM Image Examiner, RRID:SCR 014344) with 63×or 100×
magnification objectives or, for phalloidin-stained slides, with an Olympus IX81 fluorescence microscope at 100× magnification.
Western blot analysis
Kidney cortex samples or cells were homogenised in lysis buffer (1 M Tris, 0.5 M EGTA, 1% Triton X-100, 0.25 M NaF, 0.5 M phenylmethylsulfonyl fluoride, 0.5 M sodium orthovanadate, 5 mg mL−1 leupeptin, and 1.7 mg mL−1 aprotinin, pH 7.4). Lysates were centrifuged at 13,000 rpm, at 4°C for 10 min. Protein concentration of the supernatants was measured with a detergent-compatible protein assay kit (Bio-Rad Hungary, Budapest, Hungary). Solubilised samples were electro- phoretically resolved: appropriate amounts (25 μg for tissue and 18 μg for cells) of protein were loaded onto 4–20% gradient Mini-PROTEAN TGX polyacrylamide precast gels (Bio-Rad Hungary) and transferred to nitrocellulose membranes. Membranes were blocked in 5% w/v non-fat dried milk in Tris-buffered saline (TBS) for 1 h at room temperature and incubated with primary antibody anti-αSMA (Sigma-Aldrich, Cat. No. A2547, RRID:AB 476701) diluted 1:2000 at 4°C overnight. After washing with 1% w/v non-fat dried milk in TBS-Tween, membranes were incubated with the appropriate HRP-conjugated secondary antibody goat anti-mouse IgG (Cell Signaling Technology, Cat. No. 7076, RRID:AB 330924) diluted 1:6000. Antibody-antigen complexes were detected using enhanced chemiluminescence (ECL by GE Healthcare Life Sciences, Budapest, Hungary) and immunoreactive bands were quantified densitometrically on Versadoc, Quantity One 1-D Analysis software (Bio-Rad Hungary, RRID:SCR 01428) as integrated optical density (IOD) after subtraction of background. The IOD was factored for Ponceau S staining to correct for any variations in total
protein loading. The protein abundance was represented as IOD/Ponceau S/Internal control.
Reverse transcription polymerase chain reaction (RT-PCR)
Total RNA was extracted using the RT050 Total RNA isolation Mini Kit (Geneaid Biotech, New Taipei City, Taiwan). The quality and quantity of isolated RNA was measured on a NanoDrop ND-1000 spectrophotometer (Baylor College of Medicine, Houston, TX, USA). Five hundred nanograms each ofTgfb1, Pdgfb,Ctgf,Mmp2, Timp1,Timp2mRNA from rat kidney samples and 500 ng each ofTGFB1,PDGFBandCTGFmRNA from human proximal tubular epithelial cells were reverse-transcribed using a First Strand cDNA Synthesis Kit for RT-PCR (Thermo Fisher Scientific). The expression of the mRNAs was determined in triplicate with 1 μL cDNA samples obtained by qPCR using 10 μL SYBR Green I Master enzyme mix (Roche Diagnostics, Mannheim, Germany) and 10 pmol μL−1 of each specific primer (Invitrogen, Budapest, Hungary), following sequences designed by Lasergene PrimerSelect software version 7.1.0 (DNASTAR, RRID:SCR 016295) based on nucleotide sequences from National Center for Biotechnology Information’s nucleotide database (primer sequences:
Table 1). Results were analysed by LightCycler 480 software version 1.5.0 (Roche Diagnostics, RRID:SCR 012155).
The mRNA expression of interest was normalised against mRNA expression of 18S ribosomal RNA (Rn18s or RN18S) from the same samples as internal control.
Statistical analysis
To test the hypothesis that RAAS inhibition plays a renoprotective antifibrotic role in the rat model of STZ-induced DKD, statistical analyses were performed using GraphPad Prism software version 6.01 (GraphPad Software, RRID:SCR 002798). To test if the values were from a Gaussian distribution, a Kolmogorov- Smirnov normality test was performed. Data were analysed by one-way ANOVA followed by Bonferroni’s multiple-comparison post hoc test for all parametrical comparisons, or in the case of non-parametric data, by Kruskal-Wallis ANOVA on ranks. Significance was seta priori atP < 0.05, corrected for multiple comparisons.
Data are presented using box and whisker plots with means and 95% confidence intervals.
Results
RAAS inhibitors improve metabolic and renal functional parameters in STZ-induced diabetic rats Elevated serum glucose, fructosamine levels and lower body weights confirmed the development of type 1
Table 1. PCR primer sequences used in this study Gene
name Regular name NCBI ID Primer pairs
Product lenght Ta Tgfb1 Rat TGFβ1 21803 Forward: 5ʹ-GCA CCG GAG AGC CCT GGA TAC C-3ʹ 222 bp 60°C
Reverse: 5ʹ-CCC GGG TTG TGT TGG TTG TAG AGG-3ʹ
Pdgfb Rat PDGFB 24628 Forward: 5ʹ-TCG ATC GCA CCA ATG CCA ACT TCC-3ʹ 236 bp 62°C Reverse: 5ʹ-CAC GGG CCG AGG GGT CAC TAC TGT-3ʹ
Ctgf Rat CTGF 64032 Forward: 5ʹ-TCC ACC CGG GTT ACC AAT GAC AAT AC-3ʹ 195 bp 58°C Reverse: 5ʹ-CTT AGC CCG GTA GGT CTT CAC ACT GG-3ʹ
Mmp2 Rat MMP2 81686 Forward: 5ʹ-TCC CCC AAA ACA GAC AAA GAG T-3ʹ 224 bp 56°C Reverse: 5ʹ-TTG CGG GGA AAG AAG TTG TAG T-3ʹ
Timp1 Rat TIMP1 116510 Forward: 5ʹ-GGC GCC CTT TGC ATC TCT GG-3ʹ 250 bp 58°C Reverse: 5ʹ-GGC GAA CCG GAA ACC TGT GG-3ʹ
Timp2 Rat TIMP2 29543 Forward: 5ʹ-GCC CTG GGA CAC GCT TAG CAT C-3ʹ 220 bp 59°C Reverse: 5ʹ-GTA CCA CGC GCA AGA ACC ATC ACT-3ʹ
Rn18s Rat 18S ribosomal RNA
100861533 Forward: 5ʹ-GCG GTC GGC GTC CCC CAA CTT CTT-3ʹ 105 bp 60°C Reverse: 5ʹ-GCG CGT GCA GCC CCG GAC ATC TA-3ʹ
TGFB1 Human TGFβ1 7040 Forward: 5ʹ-GCG TGC GGC AGC TGT ACA TTG ACT-3ʹ 174 bp 60°C Reverse: 5ʹ-CGA AGG CGC CCG GGT TAT GC-3ʹ
PDGFB Human PDGFB 5155 Forward: 5ʹ-AGA TGG GGC CGA GTT GGA CCT GAA-3ʹ 163 bp 62°C Reverse: 5ʹ-GCG CCG GGA GAT CTC GAA CAC CT-3ʹ
CTGF Human CTGF 1490 Forward: 5ʹ-GTC CAC CCG GGT TAC CAA TGA CAA-3ʹ 228 bp 58°C Reverse: 5ʹ-CAG GAT CGG CCG TCG GTA CAT ACT-3ʹ
RN18S Human 18S ribosomal RNA
HQ387008.1 Forward: 5ʹ-CGC GGA TCC GAA CAC TGC GTT TGC TGG CTT TGA TG-3ʹ
136 bp 60°C Ta, annealing temperature.
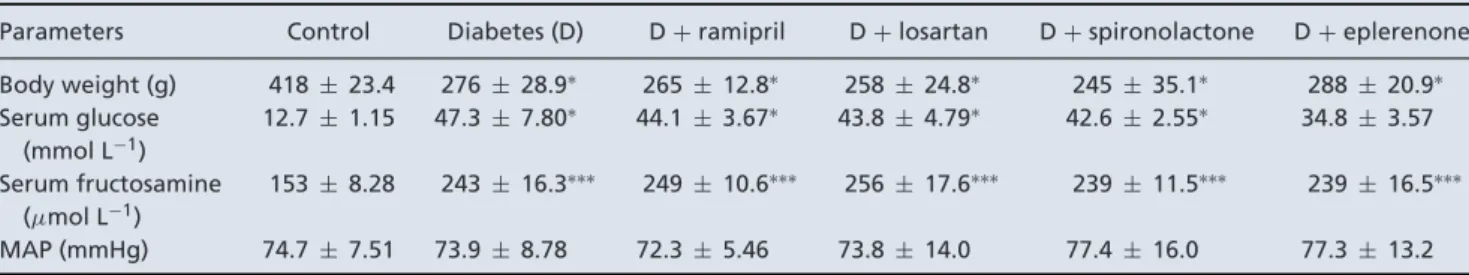
Table 2. Body weight, metabolic parameters and mean arterial pressure (MAP) of control, diabetic and renin-angiotensin-aldosterone system inhibitor-treated diabetic rats
Parameters Control Diabetes (D) D+ramipril D+losartan D+spironolactone D+eplerenone Body weight (g) 418± 23.4 276± 28.9∗ 265± 12.8∗ 258± 24.8∗ 245± 35.1∗ 288± 20.9∗ Serum glucose
(mmol L−1)
12.7 ± 1.15 47.3± 7.80∗ 44.1± 3.67∗ 43.8± 4.79∗ 42.6± 2.55∗ 34.8± 3.57 Serum fructosamine
(μmol L−1)
153± 8.28 243± 16.3∗∗∗ 249± 10.6∗∗∗ 256± 17.6∗∗∗ 239± 11.5∗∗∗ 239± 16.5∗∗∗
MAP (mmHg) 74.7 ± 7.51 73.9± 8.78 72.3± 5.46 73.8± 14.0 77.4± 16.0 77.3± 13.2 Values are presented as means ± 95% confidence limits; n = 7–8 rats/group; one-way ANOVA followed by Bonferroniʹs multiple-comparisonpost hoctest;∗P<0.05,∗∗∗P<0.001vs.control.
diabetes mellitus. RAASi did not alter any of the metabolic parameters. Mean arterial pressure remained unaltered in all groups confirming that the examined effects of RAASi are independent of their antihypertensive properties (Table 2). A decline in renal functional parameters and higher kidney-to-body weight ratios indicate the development of DKD. RAASi reduced relative kidney enlargement, improved creatinine clearance and decreased renal retention parameters (Fig. 1A). Urinary biomarkers of ECM remodelling showed increased collagen III formation (rPRO-C3) and degradation (uC3M) and collagen IV turnover (TUM) in diabetic animals.
Eplerenone treatment decreased the level of uC3M level (Fig. 1B). Besides functional decline, a key histological
features of DKD, massive glomerular hypertrophy and mesangial matrix expansion were observed in untreated diabetic rats. All of the RAASi minimised structural damage as reflected by smaller PAS positive glomerular areas (Fig. 1C).
RAAS inhibitors ameliorate tubulointerstitial fibrosis in diabetic kidneys
Renal tubulointerstitial fibrosis was assessed on Masson’s trichrome-stained sections. The quantity of fibrotic connective tissue increased in diabetic animals, while all of the RAASi decreased tubulointerstitial fibrosis (Fig. 2A). To assess accumulation of the collagen
Figure 1. Renal functional parameters, kidney histology and urinary fibrotic markers of control, diabetic and renin-angiotensin-aldosterone system inhibitor-treated diabetic rats
A,kidney-to-body weight ratio, creatinine clearance, serum creatinine, and blood urea nitrogen were measured in rats.B,urinary collagen type III degradation fragment (uC3M), tumstatin (TUM) and N-terminal pro-peptide of rodent type III collagen (rPRO-C3) levels measured from rat urine.C,representative periodic acid-Schiff (PAS)-stained histological sections and quantitative evaluation of glomerular hypertrophy and mesangial matrix expansion.
Arrows mark mesangial matrix deposition stained with purple. 400×magnification; scale bar=50μm. Values are presented as means±95% confidence intervals;n=7–8 rats/group; one-way ANOVA followed by Bonferroniʹs multiple-comparisonpost hoctest;∗P<0.05,∗∗P<0.01,∗∗∗P<0.001vs.control;#P=0.08,§P<0.05,
§§P<0.01,§§§P<0.001vs.D.
Figure 2. Fibrotic alterations in kidneys of control, diabetic and renin-angiotensin-aldosterone system inhibitor treated diabetic rats A,representative Massonʹs
trichrome-stained histological sections and quantitative evaluation of renal
tubulointerstitial fibrosis by
Masson-positive and glomerulus-freevs.
total areas in the kidney cortex. Arrows mark fibrotic tissue stained with blue.
200×magnification; scale bar=100μm.
B,representative Picrosirius Red-stained histological kidney sections and quantitative evaluation of collagen accumulation. Arrows mark red-stained collagen. 100×magnification; scale bar= 200μm. On each graph values are presented as means±95% confidence intervals;n=7–8 rats/group;
Kruskal-Wallis ANOVA on ranks;∗∗∗P<
0.001vs.control;§§§P<0.001vs.D.C, representative fluorescent
immunohistochemical staining of renal sections and Western blot analysis of alpha-smooth muscle actin (αSMA) protein levels in the kidneys, with representative examples above. Samples might be from different gels but were derived at the same time and processed in parallel. 630×magnification; green, αSMA; blue, nucleus; scale bar=20μm;
values are presented as means±95%
confidence intervals;n=7–8 rats/group;
one-way ANOVA followed by Bonferroniʹs multiple-comparisonpost hoctest;
∗∗∗P<0.001vs.control;§§§P<0.001 vs.D.
components of ECM, Picrosirius Red staining was performed, which showed increased amounts of collagen in diabetic kidneys. RAASi also significantly decreased renal collagen depositions (Fig. 2B). Another widely accepted important and specific marker of fibrosis is the increased level of αSMA, which indicates the activation and differentiation of fibroblasts (Skalliet al.
1987). We demonstrated that in diabetic animals, the level ofαSMA is significantly increased and the protein is mainly localised in the tubulointerstitial region.
RAASi decreased the accumulation of αSMA protein (Fig. 2C).
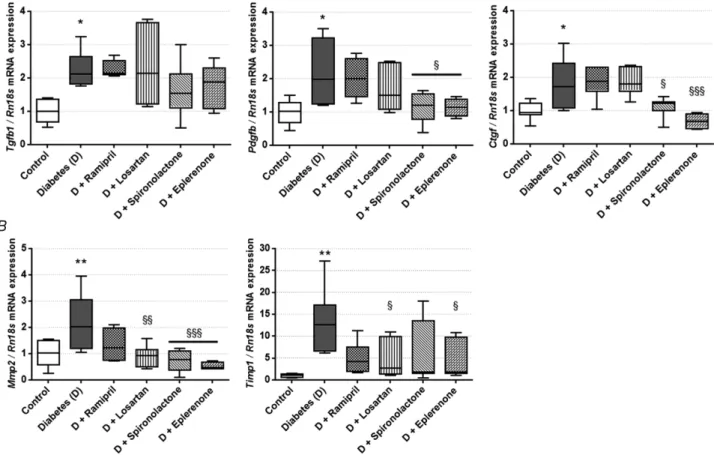
Aldosterone antagonists decrease PDGF and CTGF/CCN2 levels in diabetic kidneys
Since DKD-associated cytokines induce fibrotic differentiation (Boor & Floege, 2011), we measured Tgfb1, Pdgfb and Ctgf mRNA expression in the renal cortex. In the diabetic group, expression of all profibrotic factors was elevated. RAASi did not alterTgfb1expression,
while aldosterone antagonists decreased Pdgfb andCtgf expression (Fig. 3A).
Matrix metalloproteinases facilitate ECM turnover and serve as a marker of renal fibrosis (Du et al. 2012). In diabetic rats renal Mmp2expression was increased, and aldosterone antagonists showed the most robust effect in minimizing Mmp2 expression. Expression of the tissue inhibitor of matrix metalloproteinase 1 (Timp1) also increased in diabetes, following the increase in Mmp2.
This change was also alleviated by losartan and eplerenone treatment (Fig. 3B). The expression ofTimp2andMmp9 remained the same in all groups (data not shown).
RAAS inhibitors prevent PDGF and CTGF/CCN2 production in HK-2 proximal tubular epithelial cells In vitro experiments were performed to further clarify the profibrotic signal transduction pathways. HK-2 cells were cultured both in normal, HG or mannitol-treated isosmotic conditions to distinguish the per se effects of hyperosmolality and hyperglycaemia on proximal tubule
Figure 3. mRNA expression of profibrotic factors and fibrotic marker extracellular matrix enzymes in control, diabetic and renin-angiotensin-aldosterone system inhibitor-treated diabetic rats
A,transforming growth factorβ1 (Tgfb1), platelet-derived growth factor B (Pdgfb) and connective tissue growth factor (Ctgf) mRNA expression measured in kidney.B,matrix metalloproteinase 2 (Mmp2) and tissue inhibitor of matrix metalloproteinase 1 (Timp1) mRNA expression measured in kidney. Values are presented as means±95%
confidence intervals;n=7–8 rats/group; one-way ANOVA followed by Bonferroniʹs multiple-comparisonpost hoc test;∗P<0.05,∗∗P<0.01vs.control;§P<0.05,§§P<0.01,§§§P<0.001vs.D.
cells. Expression of TGFB1, PDGFB and CTGF was increased in HG-treated HK-2 cells.TGFB1andPDGFB expression did not change with mannitol treatment, but, in contrast, mannitol enhancedCTGFmRNA expression.
These results suggest that the elevation of TGFB1 and PDGFBcan be considered as a direct effect of glucotoxicity, whileCTGFproduction is the result of the complex effect of hyperglycaemia and hyperosmolarity (Fig. 4A).
RAASi significantly reduced elevated expression of both PDGFBandCTGFto the level of controls (Fig. 4B). Since RAASi did not influenceTGFB1expression either in the kidney or in HK-2 cells, we focused our further analyses onPDGFBandCTGF.
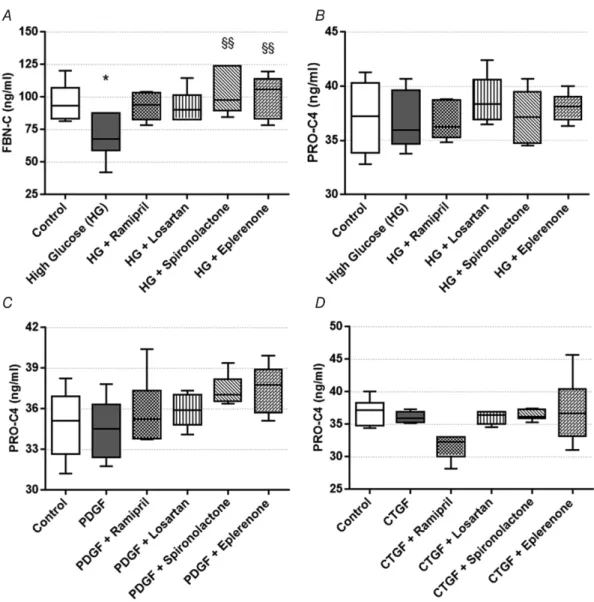
RAAS inhibitors restore normal fibronectin turnover in HK-2 proximal tubular epithelial cells
The amount of C-terminal of fibronectin (FBN-C) secreted into the supernatant is a biomarker of fibronectin turnover. High glucose treatment reduced the level of FBN-C (fibronectin turnover), which was restored to
the level of controls by treatment with spironolactone and eplerenone (Fig. 5A). Secreted FBN-C levels in NRK cells were below the lower limit of detection. The amount of internal epitope in the 7S domain of type IV collagen (PRO-C4) secreted into the cells’ supernatant serves as a collagen formation biomarker. No changes in type IV collagen formation in HK-2 cells (Fig. 5B) and NRK-49F cells (Fig. 5CandD) were detected in any of the goups.
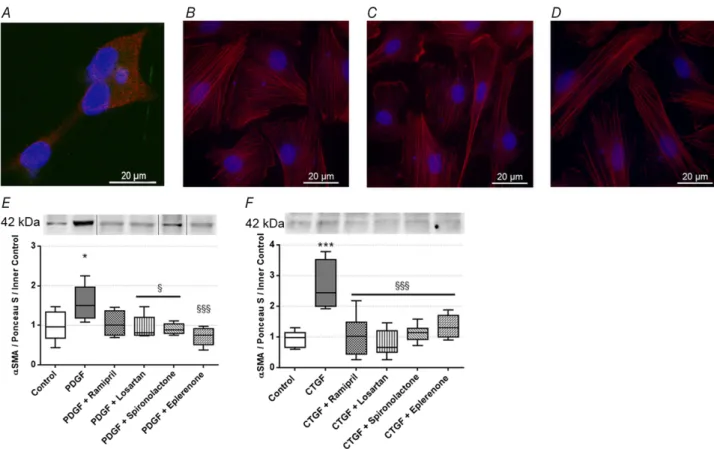
PDGF and CTGF/CCN2-inducedαSMA production of renal fibroblasts is prevented by RAAS inhibitor treatment
Since the profibrotic factors produced by proximal tubular epithelial cells act directly on the renal fibroblasts, the effect of PDGF and CTGF/CCN2 treatment on αSMA production of NRK-49F cells was also evaluated.
Using fluorescent immunohistochemistry, we firstly proved that NRK-49F cells express PDGF receptor β (PDGFR-β) (Fig. 6A), which is essential for the action
Figure 4. Profibrotic factor production in human kidney 2 (HK-2) cells on normal, high glucose (HG), mannitol and renin-angiotensin-aldosterone system inhibitor (RAASi) treatment
A, transforming growth factor β (TGFB1), platelet-derived growth factor B (PDGFB), and connective tissue growth factor (CTGF) mRNA expression in HK-2 proximal tubular epithelial cells on HG or osmotic control mannitol treatment. B, TGFB1, PDGFB, and CTGF mRNA expression in HK-2 cells on HG and RAASi treatment. Values are presented as means ± 95% confidence intervals; n = 6 wells/group; one-way ANOVA followed by Bonferroniʹs multiple-comparison post hoc test; ∗P < 0.05,
∗∗∗P<0.001vs.control;§P<0.05, NS, not significantvs.HG
of both PDGF and CTGF/CCN2. Morphological changes on NRK-49F cells caused by PDGF and CTGF treatments were visualised by immunostaining of F-actin with phalloidin-TRITC. Control cells had a slightly elongated shape and a diffuse actin network of thin actin filaments (Fig. 6B) PDGF and CTGF/CCN2 treatments induced actin cytoskeleton rearrangement in NRK-49F cells. The elongation of cells was caused by the reorganization of stress fibres along a longitudinal axis, with the formation of F-actin bundles. Both treatments caused formation of actin-clumps, especially at the edges of fibroblasts (Fig. 6C andD).
Secondly, we showed that PDGFB and CTGF/CCN2 treatments increased αSMA protein levels in renal fibroblasts, indicating fibroproliferative activation and differentiation of NRK-49F cells. All RAASi hindered these changes, by restoringαSMA to the level of controls (Fig. 6E andF).
Discussion
The frequency of DM is enormously increasing worldwide, thus more and more people are exposed to the risk of developing diabetic complications. DKD is one of the
Figure 5. Extracellular matrix formation and degradation biomarkers measured in human kidney 2 (HK-2) cells on high glucose (HG) and renin-angiotensin-aldosterone system inhibitor (RAASi) treatment and in normal rat kidney fibroblast (NRK-49F) cells treated with profibrotic factors and RAASi
A,C-terminal of fibronectin (FBN-C) turnover marker secretion by HK-2 proximal tubular epithelial cells on HG and RAASi treatment.B,type IV collagen formation biomarker (PRO-C4) secretion by HK-2 cells on HG and RAASi treatment.CandD, PRO-C4 secretion by NRK-49F cells treated with platelet-derived growth factor (PDGF;C) or connective tissue growth factor (CTGF;D). Values are presented as means±95% confidence intervals;n=6 wells/group; one-way ANOVA followed by Bonferroniʹs multiple-comparisonpost hoctest;∗P<0.05vs.control;
§§P<0.01vs.HG.
most detrimental consequences of DM regarding patients’
quality of life and survival (Trikkalinou et al. 2017).
Therefore, there is a great demand for new therapies to slow down the progression of DKD and deepen our understanding of the molecular mechanisms involved.
The primary goal of our study was to evaluate the mono- therapeutic effect of different RAASi as protection against DM-induced kidney fibrosis.
DKD is a complex disease, characterised by several pathophysiological changes including glomerular hyper- trophy with progressive mesangial expansion, and tubulointerstitial fibrosis. Besides hypertension, hyper- glycaemia is also a major contributing factor, and both effects activate local renal RAAS, subsequently increasing intraglomerular pressure, cellular growth, and fibroblast differentiation (Macia-Heraset al.2012).
RAASi are the standard treatments in the care for hypertensive patients with DM, especially when renal involvement is present (American Diabetes Association,
2018). Their ability to lower blood pressure has been well documented, but they also reduce kidney and glomerular hypertrophy, and renal inflammation without affecting blood pressure (Kobori et al. 2013). The antifibrotic potential of angiotensin II receptor 2 agonism (Morrissey
& Klahr, 1999), and AT1 antagonism (Grosset al.2004), as well as ACE inhibition (Rubel et al.2014), has been already explored in murine models of unilateral ureteral obstruction and progressive renal fibrosis. Furthermore, RAASi have already been shown to reduce renal fibrosis in DKD (Liao et al.2003; Han et al. 2006; Feldmanet al.
2008), but the complexity of the exact mechanisms is still not fully clarified. To test whether the antifibrotic properties of RAASi are associated with or restricted to their antihypertensive effect, we chose lower treatment dosages avoiding blood pressure changes. In the present study neither diabetes nor RAASi affected blood pressure, which confirms the non-depressor doses of drugs used in our protocol.
Figure 6. Effect of profibrotic factors and renin-angiotensin-aldosterone system inhibitors (RAASi) on normal rat kidney fibroblast (NRK-49F) cells
A,representative picture of platelet-derived growth factor receptorβ(PDGFR-β) stained NRK-49F cells. 1000× magnification; red, PDGFRβ; blue, nucleus; scale bar=20μm.B–D, representative pictures of phalloidin-TRITC immunostained NRK-49F cells (control,B) treated with platelet-derived growth factor (PDGF;C) or connective tissue growth factor (CTGF/CCN2;D). 1000×magnification; red, F-actin; blue, nucleus; scale bar=20μm.Eand F, alpha-smooth muscle actin (αSMA) protein levels in NRK-49F cells treated with PDGF (E) or CTGF/CCN2r (F) and RAASi. Representative gel image examples shown above the panels. Samples might be from different gels but were derived at the same time and processed in parallel. On each graph values are presented as means±95%
confidence intervals;n=6 wells/group; one-way ANOVA followed by Bonferroniʹs multiple-comparisonpost hoc test;∗P<0.05,∗∗∗P<0.001vs.control;§P<0.05,§§§P<0.001vs.PDGF or CTGF.
In line with our previous studies, we also observed severe structural and functional kidney damage in diabetic animals, which was improved by all RAASi (Bankiet al.
2012). According to the literature and our previous results, this renoprotection goes beyond decreasing blood pressure and can be related to other factors like lower oxidative stress (Fiordalisoet al.2006) or O-GlcNAc levels (Gellai et al.2016).
Overexpression of profibrotic factors such as TGFβ, CTGF/CCN2 and PDGF has been implicated in the development of DKD through the modulation of various signal transduction pathways and renal structural changes (Wanget al.2015). They contribute to the fibrotic process by enabling fibroblasts to differentiate and migrate, which eventually induces the expression of ECM components including collagen type III and MMP9 (Powell et al.
1999). In the present study, we demonstrated that mono- therapy with various RAASi successfully regulates the hyperglycaemia-induced fibrotic response and supresses the level of profibrotic factors bothin vivoandin vitro.
To the best of our knowledge, this is the first study to use ECM remodelling biomarkers to test the efficacy of treatment of fibrosis in diabetes. These measurements non-invasively provide relevant information on renal fibrotic processes and correlate with histological findings.
Here we observed that eplerenone could reduce the urinary levels of a biomarker of collagen type III turnover that was highly upregulated in diabetic rats.
Aldosterone antagonists restored the biomarker of fibronectin turnover secreted into the supernatant to control levels, which confirmed a decrease in fibronectin turnover in HG-treated HK-2 cells. These observations suggest a role for RAASi that involves interfering with the dysregulated remodelling of the interstitial ECM that characterizes fibrosis.
TGFβ1 is one of the three isoforms of TGFβ and it is the most commonly studied profibrotic growth factor.
Its relevance has been emphasised in both normal tissue repair (Kane et al. 1991) and in the development of several fibrotic processes. It promotes ECM deposition by inducing fibroblasts to differentiate and synthesise fibrotic components (Leask & Abraham, 2004). The expression of TGFB1was found to be elevated in human experimental diabetic kidney diseases (Yamamotoet al.1993).
In line with these studies we showed thatTgfb1/TGFB1 mRNA expression was increased in the kidney of diabetic rats, and also in HG-treated HK-2 cells. This increment can be considered an effect of glucotoxicity, rather than hyperglycaemia-induced hyperosmolarity, since the TGFB1level was not increased by the isosmotic control mannitol treatment.
The connection between TGFβand RAAS inhibition in STZ-diabetes has been discussed in only a few studies so far. These showed that some RAASi attenuate renalTGFβ1 expression in STZ-diabetic rats, although in these studies
valsartan (Huanget al.2011), and aliskiren (Feldmanet al.
2008) treatments were initiated from the beginning of the diabetes and the drugs were administered directly into the renal cortex or subcutaneously, but not orally. Other studies in which RAASi successfully affected TGFβ1 levels have been conducted on other kidney disease models such as the subtotal nephrectomy model (Piechaet al.2008), and used different type of RAASi (Liaoet al.2003). Inter- estingly, in our study,per osRAASi had no effect onTgfb1 expression either in the diabetic rat kidney, or in HK-2 cells. Therefore, it appears thatTgfb1reduction is not one of the antifibrotic mechanisms by which RAASi act in the advanced stage of DKD in STZ rats.
The expression of other profibrotic factors like PDGF and CTGF can be activated through TGFβ-dependent and -independent pathways (Yang et al.2009). Both factors can act through PDGFR-β(Makinoet al.2017), which is widely distributed throughout the cytoplasm of fibroblasts (Huang & Huang, 1988), as we also detected in our study.
PDGF consists of homo- and heterodimers and PDGF-BB is crucial for production and maintenance of renal structures and ECM (Ostendorf et al. 2012).
PDGF is also involved in structural alterations of DKD. Di Paolo et al. (1996) demonstrated that HG induced a persistent increase in PDGFB expression, thus stimulating fibroblast proliferation, collagen and ECM production. Ramipril, eplerenon, irbesartan and spironolactone decreased PDGFB in experimental hepatic (Li et al. 2005), myocardial (Nishioka et al. 2007) and atrial fibrosis (Yang et al. 2013) and in cyclosporine nephrotoxicity (Macunluogluet al.2008). To the best of our knowledge the effect of RAASi on PDGFB has not yet been investigated in DKD.
CTGF/CCN2 is a matricellular protein that promotes angiogenesis, inflammation, tissue repair and fibrosis (Lipson et al. 2012). Overexpression of CTGF is now widely accepted as a key marker of fibrotic activity. In diabetic kidneys the expression level ofCTGFin the kidney is increased (Wang et al.2001), and high glucose levels were also identified as anin vitrostimulus (Murphyet al.
1999). Losartan and spironolactone have been shown to decrease CTGF/CCN2 in human (Andersenet al. 2005) and experimental DKD (Hanet al.2006).
In agreement with earlier reports both in the diabetic kidneys (Floege et al. 2008), as well as in HG-cultured HK-2 cells (Mesarosova et al. 2017), we found higher PDGFB andCTGF expression in our rat model. RAASi decreased the production of both growth factors and also diminished their expression when administered to renal proximal tubular cells, suggesting that these drugs directly act on proximal tubules by inhibiting HG-induced upregulation of the profibroticPDGFBandCTGFgenes, but surprisingly not theTGFB1gene.
As we treated NRK fibroblasts with either PDGF or CTGF/CCN2, morphological changes showed actin
cytoskeleton rearrangement. Similar transformations have been described in human fibroblasts (Hedberget al.
1993), and smooth muscle cells (Kuzuyaet al.2004) due to PDGF treatment; and in podocytes (Fuchshoferet al.
2011) after CTGF/ CCN2 administration. Furthermore, in our experiments the production ofαSMA also increased, indicating myofibroblast differentiation. We showed for the first time that all the RAASi tested successfully decreased this fibrotic transformation, indicating that these cells might be one of the primary targets of RAASi.
MMP2 is an endopeptidase responsible for the degradation of the major components of ECM proteins, and thus it has an important role in senescence and fibrosis. The renal expression of Mmp2 was shown to increase as a compensatory mechanism in STZ-induced DKD (Takamiyaet al. 2013), as we also observed in the present study. In renal cortex of diabetic rats, higherMmp2 expression was decreased by RAASi, most successfully by aldosterone ant agonists. TIMP1 is an endogenous inhibitor of MMPs which influences ECM integrity and the tissue microenvironment. Its expression was also increased in the kidneys of diabetic rats, indicating that fibrosis increased because ECM degradation was restricted, and RAASi treatments prevented TIMP1 production.
In summary, we describe here a novel molecular mechanism by which RAASi are effective in the pre- vention of hyperglycaemia-induced fibrosis. We showed that RAASi directly target renal proximal tubular cells by reducing PDGFB and CTGF, but not TGFβ1 production, and also inhibitαSMA accumulation in kidney fibroblasts.
Ours is the first study to compare different RAASi and suggest that monotherapy with aldosterone antagonists might be as effective as, or even more effective than ACE inhibitors or angiotensin II receptor blockers in preventing the progression of renal fibrosis in DKD.
In conclusion, the present study demonstrates that RAASi drugs in monotherapy are effective at supporting kidney function and preventing renal fibrosis in STZ- induced DKD. We suggest that alteration of profibrotic factor production and fibroblast differentiation might serve as an additional target of RAASi and could facilitate their monotherapeutic application in the clinical management of renal fibrosis. A better understanding of these targets could facilitate the development of novel therapeutic strategies translated into clinical applications, but well-controlled human clinical trials are needed to confirm these suggestions and to evaluate of the risk/benefit ratio, especially of aldosterone antagonists.
References
American Diabetes Association (2018). 10. Microvascular Complications and Foot Care: Standards of Medical Care in Diabetes-2018.Diabetes Care41(Suppl. 1), S105–S118.
Andersen S, van Nieuwenhoven FA, Tarnow L, Rossing P, Rossing K, Wieten L, Goldschmeding R & Parving H-H (2005). Reduction of urinary connective tissue growth factor by Losartan in type 1 patients with diabetic nephropathy.
Kidney Int67, 2325–2329.
Bager CL, Gudmann N, Willumsen N, Leeming DJ, Karsdal MA, Bay-Jensen AC, Høgdall E, Balslev I & He Y (2016).
Quantification of fibronectin as a method to assess ex vivo extracellular matrix remodeling.Biochem Biophys Res Commun478, 586–591.
Banki NF, Ver A, Wagner LJ, Vannay A, Degrell P, Prokai A, Gellai R, Lenart L, Szakal DN, Kenesei E, Rosta K, Reusz G, Szabo AJ, Tulassay T, Baylis C & Fekete A (2012).
Aldosterone antagonists in monotherapy are protective against streptozotocin-induced diabetic nephropathy in rats.
PLoS One7e39938.
Boor P & Floege J (2011). Chronic kidney disease growth factors in renal fibrosis.Clin Exp Pharmacol Physiol38, 441–450.
Degrell P, Cseh J, Mohas M, Molnar GA, Pajor L, Chatham JC, Fulop N & Wittmann I (2009). Evidence of O-linked N-acetylglucosamine in diabetic nephropathy.Life Sci84, 389–393.
Di Paolo S, Gesualdo L, Ranieri E, Grandaliano G & Schena FP (1996). High glucose concentration induces the
overexpression of transforming growth factor-beta through the activation of a platelet-derived growth factor loop in human mesangial cells.Am J Pathol149, 2095–2106.
Dower K, Zhao S, Schlerman FJ, Savary L, Campanholle G, Johnson BG, Xi L, Nguyen V, Zhan Y, Lech MP, Wang J, Nie Q, Karsdal MA, Genovese F, Boucher G, Brown TP, Zhang B, Homer BL & Martinez RV (2017). High resolution molecular and histological analysis of renal disease
progression in ZSF1 fa/faCP rats, a model of type 2 diabetic nephropathy.PLoS One12, e0181861.
Du X, Shimizu A, Masuda Y, Kuwahara N, Arai T, Kataoka M, Uchiyama M, Kaneko T, Akimoto T, Iino Y & Fukuda Y (2012). Involvement of matrix metalloproteinase-2 in the development of renal interstitial fibrosis in mouse obstructive nephropathy.Lab Invest92, 1149.
Failli P, Alfarano C, Franchi-Micheli S, Mannucci E, Cerbai E, Mugelli A & Raimondi L (2009). Losartan counteracts the hyper-reactivity to angiotensin II and ROCK1
over-activation in aortas isolated from
streptozotocin-injected diabetic rats.Cardiovasc Diabetol8, 32.
Feldman DL, Jin L, Xuan H, Contrepas A, Zhou Y, Webb RL, Mueller DN, Feldt S, Cumin F, Maniara W, Persohn E, Schuetz H, Jan Danser AH & Nguyen G (2008). Effects of aliskiren on blood pressure, albuminuria, and (pro)renin receptor expression in diabetic TG(mRen-2)27 rats.
Hypertension52, 130–136.
Fiordaliso F, Cuccovillo I, Bianchi R, Bai A, Doni M, Salio M, De Angelis N, Ghezzi P, Latini R & Masson S (2006).
Cardiovascular oxidative stress is reduced by an ACE inhibitor in a rat model of streptozotocin-induced diabetes.
Life Sci79, 121–129.
Floege J, Eitner F & Alpers CE (2008). A new look at platelet-derived growth factor in renal disease.J Am Soc Nephrol19, 12–23.
Fuchshofer R, Ullmann S, Zeilbeck LF, Baumann M, Junglas B
& Tamm ER (2011). Connective tissue growth factor modulates podocyte actin cytoskeleton and extracellular matrix synthesis and is induced in podocytes upon injury.
Histochem Cell Biol136, 301.
Garud MS & Kulkarni YA (2014). Hyperglycemia to nephropathy via transforming growth factor beta.Current Diabetes Rev10, 182–189.
Gellai R, Hodrea J, Lenart L, Hosszu A, Koszegi S, Balogh D, Ver A, Banki NF, Fulop N, Molnar A, Wagner L, Vannay A, Szabo AJ & Fekete A (2016). Role of O-linked
N-acetylglucosamine modification in diabetic nephropathy.
Am J Physiol Renal Physiol311, F1172–F1181.
Genovese F, Boor P, Papasotiriou M, Leeming DJ, Karsdal MA
& Floege J (2016). Turnover of type III collagen reflects disease severity and is associated with progression and microinflammation in patients with IgA nephropathy.
Nephrol Dial Transplant31, 472–479.
Genovese F, Manresa AA, Leeming DJ, Karsdal MA & Boor P (2014). The extracellular matrix in the kidney: a source of novel non-invasive biomarkers of kidney fibrosis?
Fibrogenesis Tissue Repair7, 4.
Gross O, Schulze-Lohoff E, Koepke M-L, Beirowski B, Addicks K, Bloch W, Smyth N & Weber M (2004). Antifibrotic, nephroprotective potential of ACE inhibitor vs AT1 antagonist in a murine model of renal fibrosis.Nephrol Dial Transplant19, 1716–1723.
Han KH, Kang YS, Han SY, Jee YH, Lee MH, Han JY, Kim HK, Kim YS & Cha DR (2006). Spironolactone ameliorates renal injury and connective tissue growth factor expression in type II diabetic rats.Kidney Int70, 111–120.
Hedberg KM, Bengtsson T, Safiejko-Mroczka B, Bell PB &
Lindroth M (1993). PDGF and neomycin induce similar changes in the actin cytoskeleton in human fibroblasts.Cell Motil Cytoskeleton24, 139–149.
Hijmans RS, Rasmussen DG, Yazdani S, Navis G, van Goor H, Karsdal MA, Genovese F & van den Born J (2017). Urinary collagen degradation products as early markers of
progressive renal fibrosis.J Transl Med15, 63.
Huang J, Matavelli LC & Siragy HM (2011). Renal (pro)renin receptor contributes to development of diabetic kidney disease through TGFβ1-CTGF signaling cascade.Clin Exp Pharmacol Physiol38, 215–221.
Huang SS & Huang JS (1988). Rapid turnover of the platelet-derived growth factor receptor in sis-transformed cells and reversal by suramin. Implications for the mechanism of autocrine transformation.J Biol Chem263, 12608–12618.
International Diabetes Federation (2017).IDF Diabetes Atlas, 8th edn. International Diabetes Federation, Brussels, Belgium.
Kane CJM, Hebda PA, Mansbridge JN & Hanawalt PC (1991).
Direct evidence for spatial and temporal regulation of transforming growth factorβ1 expression during cutaneous wound healing.J Cell Physiol148, 157–173.
Karihaloo A (2012). Anti-fibrosis therapy and diabetic nephropathy.Curr Diab Rep12, 414–422.
Kobori H, Mori H, Masaki T & Nishiyama A (2013).
Angiotensin II blockade and renal protection.Curr Pharm Des19, 3033–3042.
Kolset SO, Reinholt FP & Jenssen T (2012). Diabetic
nephropathy and extracellular matrix.J Histochem Cytochem 60, 976–986.
Kurtz TW, Griffin KA, Bidani AK, Davisson RL & Hall JE (2005). Recommendations for blood pressure measurement in humans and experimental animals: Part 2: blood pressure measurement in experimental animals: a statement for professionals from the Subcommittee of Professional and Public Education of the American Heart Association Council on High Blood Pressure Research.Arterioscler Thromb Vasc Biol25, e22–33.
Kuzuya M, Cheng XW, Sasaki T, Tamaya-Mori N & Iguchi A (2004). Pitavastatin, a 3-hydroxy-3-methylglutaryl- coenzyme A reductase inhibitor, blocks vascular smooth muscle cell populated-collagen lattice contraction.
J Cardiovasc Pharmacol43, 808–814.
Leask A & Abraham D (2004). TGF-βsignaling and the fibrotic response.FASEB J18, 816–827.
Leeming DJ, Karsdal MA, Rasmussen LM, Scholze A & Tepel M (2013). Association of systemic collagen type IV formation with survival among patients undergoing hemodialysis.
PLoS One8, e71050.
Li X, Meng Y, Yang X-S, Mi L-F & Cai S-X (2005). ACEI attenuates the progression of CCl4-induced rat hepatic fibrogenesis by inhibiting TGF-β1, PDGF-BB, NF-κB and MMP-2,9.World J Gastroenterol11, 4807–4811.
Liao J, Kobayashi M, Kanamuru Y, Nakamura S, Makita Y, Funabiki K, Horikoshi S & Tomino Y (2003). Effects of candesartan, an angiotensin II type 1 receptor blocker, on diabetic nephropathy in KK/Ta mice.J Nephrol16, 841–849.
Lipson KE, Wong C, Teng Y & Spong S (2012). CTGF is a central mediator of tissue remodeling and fibrosis and its inhibition can reverse the process of fibrosis.Fibrogenesis Tissue Repair5, S24–S24.
Macia-Heras M, Del Castillo-Rodriguez N & Navarro Gonz´alez J (2012). The renin–angiotensin–aldosterone system in renal and cardiovascular disease and the effects of its
pharmacological blockade.J Diabetes Metab3, 2.
Macunluoglu B, Arikan H, Atakan A, Tuglular S, Ulfer G, Cakalagaoglu F, Ozener C & Akoglu E (2008). Effects of spironolactone in an experimental model of chronic cyclosporine nephrotoxicity.Transplant Proc40, 273–278.
Makino K, Makino T, Stawski L, Mantero JC, Lafyatis R, Simms R & Trojanowska M (2017). Blockade of PDGF receptors by crenolanib has therapeutic effect in patient fibroblasts and in preclinical models of systemic sclerosis.J Invest Dermatol 137, 1671–1681.
Mesarosova L, Ochodnicky P, Leemans JC, Florquin S, Krenek P & Klimas J (2017). High glucose induces
HGF-independent activation of Met receptor in human renal tubular epithelium.J Recept Signal Transduct Res37, 535–542.
Mifsud SA, Allen TJ, Bertram JF, Hulthen UL, Kelly DJ, Cooper ME, Wilkinson-Berka JL & Gilbert RE (2001). Podocyte foot process broadening in experimental diabetic nephropathy:
amelioration with renin-angiotensin blockade.Diabetologia 44, 878–882.
Morrissey JJ & Klahr S (1999). Effect of AT2 receptor blockade on the pathogenesis of renal fibrosis.Am J Physiol Renal Physiol276, F39–F45.