Optimized polar-azimuthal directions of different
infrared Superconducting Nanowire Single-Photon Detector designs illuminated by p-polarized light
Mária Csete,1, 2* Áron Sipos, Faraz Najafi,1 2 and Karl K. Berggren2
1Department of Optics and Quantum Electronics, University of Szeged, Dom ter 9, Szeged, H-6720, Hungary
2Research Laboratory of Electronics, Massachusetts Institute of Technology, 77 Massachusetts Avenue, Cambridge, MA 02139, USA
Abstract
The optimal illumination-directions were determined for p-polarized substrate side illumination of three optical systems applicable as superconducting-nanowire single-photon detectors (SNSPD): 1. periodic niobium-nitride (NbN) stripes with dimensions according to conventional SNSPDs standing in air, 2. the same NbN patterns below continuous ~ quarter- wavelength hydrogensilsesquioxane-filled nano-cavity, 3. an analogous NbN pattern in HSQ nano-cavity closed by a thin gold reflector. The numerical computations performed by FEM have shown that the optical response and near-field distribution vary with the polar-angle, ϕ, and these variations are analogous across all azimuthal-angles, γ , but are fundamentally different in the three device designs. The analogous extrema result in larger available absorptance in P-structure-configuration than in S-structure arrangement. A comparative study based on transfer-matrix-method calculations on analogous film-stacks revealed the origin of the extrema. The total internal reflection causes a global minimum on the absorptance of the NbN pattern standing in air, while a global maximum appears at the polar angle corresponding to NbN-related ATIR. The integration with HSQ nano-cavity results in a global absorptance maximum due to the phase shift introduced by the quarter-wavelength dielectric cover-layer at the polar angle corresponding to the global minimum in air. The largest absorptance was observed at perpendicular incidence on P-structures aligned below gold reflector covered HSQ nano-cavity due to the field concentration around the NbN segments. These computation results proved that the absorptance of NbN might be maximized via simultaneous optimization of the polar and azimuthal illumination angles in all of these SNSPD devices, but the optimal orientation is different in different device designs.
Keywords: SNSPD, dual-angle dependence, optimized efficiency, integrated nano-cavity, reflector
1. Introduction
The standard structure in superconducting-nanowire single-photon detectors (SNSPD) consists of 200 nm periodic boustrophedonic pattern of 4 nm thick NbN stripes with 50 % filling factor [1]. These devices are extensively used for infrared photon counting however their detection efficiency is strongly limited optically by losses accompanying reflection from and transmission through their simple geometrical structure.
The optimization of SNSPD’s requires the maximization of the NbN pattern absorptance. Two successful approaches were described in the previous literature in the realization of this purpose. The first approach is based on the development of the optical device design, which fundamentally limits the available absorptance in detectors. Different types of integrated patterns were designed to reach larger absorptance in SNSPDs [2, 3].
Detection efficiency of 50 % was experimentally observed, when the most simple integrated structure consisting of NbN below an optical cavity and a 120 nm thick gold Anti- Reflection-Coating (ARC) was illuminated from substrate side perpendicularly by 1550 nm light [2]. More complex integrated structures, like SNSPDs consisting of noble-metal nano- antenna-arrays were experimentally and theoretically studied too, but only in case of perpendicular incidence. These nano-antenna-array integrated devices make possible to reach 96 % absorptance in case of E-field oscillation direction perpendicular to the pattern [3].
The second approach is based on the optimization of the illumination conditions. The absorptance of thin lossy wires inherently depends on the relative orientation of the pattern with respect to the E-field oscillation direction [4]. The theoretical studies on front-side perpendicular illumination of NbN patterns embedded into dielectric media confirmed that larger absorptance is available in case of E-field oscillation parallel to the wires [4, 5].
Latest results in the literature proved that the illumination of SNSPD devices at the polar angle corresponding to Total Internal Reflection (TIR) is capable of resulting in 100 % absorptance, when the NbN pattern in S-structure arrangement is illuminated by s-polarized light [6]. It was also shown that the p-polarized illumination of the same pattern in P- structure-configuration causes zero absorptance at TIR. We refer to an arrangement as P- structure-configuration, when the plane of incidence is parallel to the NbN wire-grating [7].
The purpose of our present study was the systematic investigation of the simplest SNSPD designs, to determine the optimal conditions for p-polarized substrate side, off-axes illumination in conical-mounting. The inspection of the illumination direction dependent optical phenomena made possible to maximize the absorptance in different arrangements.
2. Theoretical methods
Three types of superconducting-nanowire single-photon detector (SNSPD) designs were theoretically studied: (1) 200 nm periodic pattern of 4 nm thick and 100 nm wide bare niobium-nitride (NbN) stripes standing in air, which are covered inherently by approximately 2 nm NbNOx layer (Figure 1a); (2) the same NbN patterns integrated with continuous 279 nm, i.e. ~ quarter-wavelength thick hydrogensilsesquioxane filled nano-optical cavity (Figure 1b);
(3) analogous cavity-integrated structures covered by a 60 nm thick gold film acting as a reflector (Figure 1c).
Fig. 1. Schematic drawing of the optical systems studied: (a) 200 nm periodic pattern of 4 nm and thick 100 nm wide NbN stripes inherently covered by 2 nm NbNOx layer standing in air; (b) the same structure as in (a) arrayed below HSQ-filled nano-cavity having 279 nm length; (c) the same structure as in (b) covered by a continuous 60 nm thick Au reflector. The illumination directions in conical mounting are specified by the ϕ polar and γ azimuthal angles, and λ = 1550 nm p-polarized light illuminates the pattern from sapphire substrate side. The two specific orientations studied in more details are: (d) the P-structure-configuration (γ=0°), and (e) the S-structure-arrangement (γ=90°).
The optical system (1) is similar to the pattern studied by Driessen et al. [6], however the layer thickness and the wavelength are different in our present study. The device structure (2) is analogous to that studied by Anant et al. [5], but the NbN stripes are illuminated from
the sapphire substrate side by p-polarized light in our present computations. The cavity-based structure (3) is analogous with the integrated pattern studied in our previous works [2, 7], but we focus on off-axes p-polarized light illumination of the NbN stripes with arbitrary E-field oscillation direction with respect to them in our present study.
2.1. Finite Element Method to determine the optical response and near-field distribution The three dimensional FEM method developed in our previous work based on the RF module of the COMSOL software package was applied [7]. These 3D FEM models were used to determine the effect of polar and azimuthal illumination angles on the optical response and to map the EM near-field distribution around the absorbing NbN-segments at specific orientations corresponding to the extrema on the NbN absorptance in optical systems (1-3).
P-polarized infrared light beam with λ=1550 nm wavelength, having a power of P=2x10⁻³W was used for the illumination of the NbN patterns from the sapphire substrate side. The illumination direction dependent absorptance was determined based on the Joule- heating in NbN segments, while the reflectance and transmittance were computed based on power-outflows from the optical systems.
In a coarse dual-angle-dependent study the ϕ polar angle, which is measured relative to the surface normal, and the azimuthal orientation, specified by the γ angle between the light incidence plane and the NbN stripes, were varied within the range ϕ =[0°, 85°] - γ =[0°, 90°]
with angular resolution of Δϕ = Δγ = 5° (Figure 2a, 4a and 6a). The special cases of p- polarized illumination of the integrated pattern in P-structure-configuration (γ =0°) and in S- structure-arrangement (γ =90°) were investigated with high resolution by varying the polar angle in Δϕ = 0.05° steps in [34°, 36°] interval. These results were combined with results of computations performed at lower Δϕ = 1° resolution across the entire ϕ =[0°, 85°] polar angle region (Figure 2b, 4b and 6b).
2.2. Transfer Matrix Method to determine the optical response
We performed TMM calculations on different multilayers aligned on sapphire substrate according to the vertical stacks that compose the (1-3) optical systems shown in Figure 1a-c.
These are as follows: (1) NbN-NbNOx bilayers + air; (2) NbN-NbNOx bilayers below 279 nm HSQ + 285 nm HSQ; (3) NbN-NbNOx bilayers below 279 nm HSQ nano-cavity covered by 60 nm Au + 285 nm HSQ covered by 60 nm Au. The absorptance, reflectance, and transmittance were determined by weighting the responses of each stack by their corresponding 50 % fill-factor [7]. The results were compared with the results of FEM computations in order to determine the origin of the extrema (Figure 2b, 4b and 6b).
3. Results and discussion
The dual-angle dependent optical response and the illumination conditions capable of resulting in optimized absorptance are fundamentally different in the three systems under study. The common characteristics are that the off-axes illumination results in significant variation of the optical responses with the polar angle, while only a slow monotonous variation is observable, when the azimuthal angle is tuned from 0° to 90° (Fig. 2a, 4a, 6a).
The extrema are analogous, but the values are different in case of P- and S-structures. The P- structure-configuration results in larger available absorptance in all of these systems. (Fig. 2b, 4b, 6b).
Caused by the relative orientation of the intensity modulation originating from off-axis illumination with respect to the NbN pattern, the near-field distribution remains symmetrical along the cross-sections of the NbN stripes in P-structure-configuration, while it is strongly asymmetrical in S-structure-arrangement. In the latter case those corners are more shiny, where the incident beam first hits the NbN segments (Fig. 3b, 5b, 7b).
The maximal values of the normalized E-field are smaller in P-structure-configuration under any illumination directions of the three optical systems, but the resistive heating is larger inside the absorbing NbN segments in this arrangement (Fig. 3c, 5c, 7c). This is known to be due to the larger field penetration, when the projection of E-field vector is parallel to the stripes [4]. The large normalized E-field at the boundaries and corners outside the NbN segments correlate with the less effective field penetration in S-structure arrangement.
3.1.1 Optical response of NbN pattern standing in air
The dual-angle dependent absorptance characteristic is similar at any azimuthal angle to the absorptance signal previously presented for p-polarized illumination for P-structures [6]. The differences in the values observed in P-structure-configuration of the NbN in optical system (1) are explained by the different NbN layer thickness and by the illumination with light having different wavelength. The P-structures result in approximately two-times larger absorptance than the S-structures in case of 1550 nm illumination of bare NbN patterns (Fig.
2a, b).
Figure 2b shows in more details the polar angle dependent optical responses determined by TMM and by FEM for P- and S-structures. The absorptance at perpendicular incidence is 32 % in case of P-structures, which is larger than the absorptance predicted by TMM, and also larger than the 17.3 % absorptance observed in S-structure arrangement [7]. A global minimum is observable on the absorptance curve at 34.7° corresponding to the
condition of TIR at the sapphire-air interface. This is in accordance with the zero absorptance presented in the previous literature [6].
There is a local maximum at 48° and 49° polar angles originating from NbN related ATIR, where the absorptance reaches 46.3% value in P- and 23.1 % in S-structure arrangements. This polar angle corresponds to the optimal orientation of the NbN pattern in P- structure-configuration in air. However illumination under this polar angle is experimentally difficult, as it would require light in-coupling into the system above polar angle corresponding to the TIR phenomenon.
The average of FEM absorptances equals with the TMM absorptance, and in P- structure configuration the FEM absorptance is significantly larger than the TMM absorptance through the entire polar-angle interval. This might be explained by the limits of TMM, which cannot account for the stronger absorption of the light occurring, when the projection of the E-field oscillation is parallel to the stripes [4].
The transmittance indicates a cut-off at TIR, while the reflectance exhibits a typical ATIR phenomenon. The reflectance is most strongly frustrated at the orientations optimal for NbN absorption.
Fig. 2. Optical response of the system consisting of NbN pattern standing in air: (a) dual-angle-dependent absorptance determined by calculations performed over the γ =[0−90°] and ϕ =[0−85°] intervals, with
°
= Δ
=
Δγ ϕ 5 resolution. (b) The comparison of the optical responses in P-structure-configuration (γ=0° full triangles) and in S-structure-arrangement (γ=90°, empty triangles) determined by FEM with optical responses determined by TMM (line). There is a global minimum at 34.7° and global maxima at 48° and 49° on the NbN absorptance. The origins of these extrema are detailed in the text. The results of FEM and TMM calculations in [34°, 36°] interval with Δϕ=0.05° resolution are incorporated into the graphs originating from computation performed with Δϕ=1° resolution in [0°, 85°] region.
3.1.2. Near-field on NbN pattern standing in air
Figure 3 indicates that the incident and the weak reflected E-fields are in phase at perpendicular incidence, which makes possible significant amount of the EM intensity to be absorbed inside the NbN stripes. Even if the corners are shiny in S-structure arrangement, the average value of the normalized E-field is larger in NbN in P-structure configuration.
Zero E-field is observable at TIR inside the NbN stripes in both arrangements, which is caused by the out-of-phase incident and reflected waves, creating a node inside the lossy thin NbN layer in case of p-polarized illumination [6].
The most intensive E-field penetrating into NbN is observable at the global maximum, due to the evanescent field concentration at the substrate-NbN interface. The more homogeneous field distribution surrounding the NbN segments promotes to reach larger absorptance.
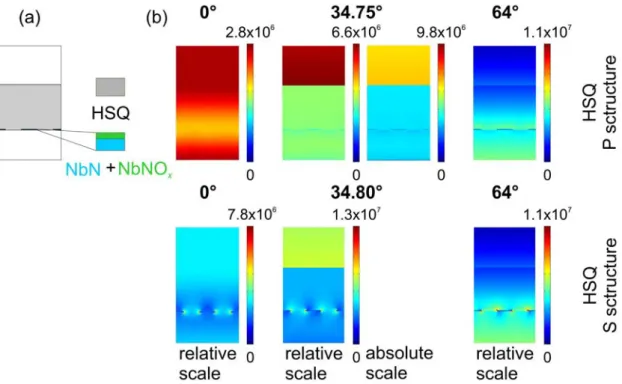
Fig. 3 (a) Schematic drawing showing two unit cells in a plane perpendicular to the 200 nm periodic NbN pattern, where the near-field cross-sections were investigated. (b) The E-field distribution in presence of NbN pattern standing in air: first row P-structure configuration, second row S-structure configuration. The cross- sections were taken at perpendicular incidence and at polar angles corresponding to global minimum (34.7° and 34.8°) and global maximum (48° and 49°) in NbN absorptance, and are presented on a scale to illustrate better small variations in the field. The pictures on the right side at 34.7° and 34.8° are plotted using the same scale in [V/m], as in Figs. 5-7. (c) The comparison of the resistive heating inside the NbN in P- and S-structure configuration along the line indicated on inset (a).
The comparison of the line cross-sections taken at the middle of the NbN stripes proves that the field deeply penetrates into the NbN stripes in P-structure configuration also at perpendicular incidence, but most effectively penetrates at the maxima. However there is a sudden change in the resistive heatings at the TIR, which indicates penetration with very small decay lengths at the NbN boundaries in both orientations. The appearance of this local maxima is in connection with the large E-field outside the NbN segments, but cannot cause absorptance enhancement, caused by the field-node inside the NbN segments (Figure 3c).
3.2.1. Optical response in NbN pattern below HSQ-filled nano-cavity
Even though p-polarized illumination is used, the dual-angle dependent absorptance does not indicate a minimum in the interval surrounding the polar angle corresponding to TIR at sapphire-air interface, on the contrary, it is more likely at all azimuthal angles to the absorptance, which was previously presented for s-polarized illumination of S-structures in reference [6] (Figure 4a).
Figure 3b presents the optical responses determined by TMM and by FEM for P-and S-structures. In case of perpendicular incidence the absorptance is 19.3 % in P-structures and 12.5% in S-structures, i.e. both are smaller than the absorptance in analogous arrangements without HSQ nano-cavity. Than the absorptance increases, and reaches a global maximum at 34.8° incidence angle, which is the polar angle corresponding to TIR at sapphire-air interface.
The enhanced 43.1 % absorptance in case of P-structure and 31.3 % in case of S-structure are larger than the absorptances at perpendicular incidence on either of bare or HSQ covered NbN pattern in the corresponding arrangements. This proves that off-axis illumination is advantageous in presence of quarter-wavelength HSQ nano-cavity. The comparison of the absorptance in optical systems (1) and (2) shows that it is possible to enhance the absorptance with respect to bare NbN without gold cover layer in P-structure configuration throughout [27°-36.5°] region, while in S-structure arrangement in [23.5°-36.5°] polar-angle interval.
The absorptance indicates a global minimum at 41° instead of the polar angle corresponding to TIR at sapphire-air interface, than a local absorptance maximum appears at 64° originating from NbN related ATIR. This local maximum is 34.1 % in P-structures, and 20.8 % in S-structures, and these values are slightly larger than the absorptance at perpendicular incidence on the bare or HSQ covered NbN patterns in the corresponding arrangements. This proves the advantage of tilting, but similarly to the pattern standing in air it is hard to realize this large tilting experimentally.
The reflectance curve indicates a Brewster-like minimum at 28°, and interestingly an inflection point appears at 34.8°. Above 41° the curve exhibits ATIR characteristics caused by the presence of lossy NbN stripes. The transmittance indicates a cut-off at 34.8° polar angle.
The average of the FEM signals equals with TMM absorptance, and the FEM absorptance in P-structure-configuration is slightly larger, while in S-structure-arrangement it is smaller than the TMM absorptance across all polar-angles. The difference is smaller than in case of bare NbN pattern, and negligible at the global maximum and at large polar angles. The TMM absorptance curve indicates analogous global maximum at 34.8°, but would predict smaller maximal value.
Fig. 4. Optical response of the system consisting of NbN pattern in quarter-wavelength HSQ nano-cavity: (a) dual-angle-dependent absorptance determined by calculations performed over the γ =[0−90°] and
intervals, with ]
85 0 [ − °
ϕ= Δγ =Δϕ =5° resolution. (b) The comparison of the optical responses determined by FEM in P-structure-configuration (γ=0°, full triangles) and in S-structure-arrangement (γ=90°, empty triangles) with optical responses determined by TMM (line). There is a global maximum at 34.75° and at 34.8°
in P- and S-structures and a local maximum at 64° on the NbN absorptance in both arrangemenets. The origins of these maxima are detailed in the text. The results of FEM and TMM calculations in [34°, 36°] interval with
resolution are incorporated into the graphs originating from computation performed with
°
=
Δϕ 0.05 Δϕ =1°
resolution in [0°, 85°] region.
3.2.2. Near-field distribution on NbN pattern below HSQ-filled nano-cavity
Figure 5 provides the near-field explanation for the polar angle dependent optical response in HSQ covered NbN patterns. The NbN stripes are in the area of slight E-field declines below the nano-cavity at perpendicular incidence in both arrangements. This explains, why the absorptance is smaller at perpendicular incidence than in case of NbN pattern standing in air.
Due to the phase shift introduced by the cavity the incoming and reflected fields are in phase at the NbN stripes arrayed at the bottom of the cavity in close proximity of the polar angle corresponding to TIR at sapphire-air interface. As a result a significant part of the EM- field might be absorbed in the lossy film, similarly to the case of s-polarized illumination [6].
This explains the appearance of the global maximum on the NbN absorptance curves.
Fig. 5. (a) Schematic drawing showing two unit cells in a plane perpendicular to the 200 nm periodic NbN pattern, where the near-field cross-sections were investigated. (b) The E-field distribution on NbN pattern below quarter-wavelength HSQ nano-cavity: first row P-structure configuration, second row S-structure arrangement.
The cross-sections were taken at parependicular incidence and at polar angles corresponding to global (34.75°
and 34.8°) and local maxima (64°) in NbN absorptance, and are presented on a scale to illustrate better small variations in the field. The pictures on the right side at 34.75° and 34.8° are plotted using the same scale in [V/m], as in Figs. 3-7. (c) The comparison of the resistive heating inside the NbN in P- and S-structure configuration along the line indicated on inset (a).
At the orientation corresponding to the NbN related ATIR the E-field enhancement is smaller at the bottom of the cavity, than that was observed around NbN pattern standing in air at the sapphire interface. This indicates that the presence of the nano-cavity does not promote further field concentration at this polar angle. The explanation is the change of the apparent cavity length during tilting, which was not compensated in this case. The most significant difference between the two arrangements is the more strongly asymmetric illumination of the stripes in S-structures, which manifest itself in intensive field at the corners as a cost of field depletion along the stripes.
The comparison of the line cross-sections taken at the middle of the NbN stripes proves that the resistive heating inside the NbN stripes indicates significantly different distribution in P-structure-configuration and in S-structure arrangement. Although the characteristic of the resistive heating distribution does not vary with the polar angle, and the largest values are observable at the at 34.75° and 34.8° polar angles according to the global maxima on the absorptance (Figure 5c).
3.3.1. Optical response in NbN pattern below Au reflector covered HSQ-filled nano-cavity The difference between the dual-angle dependent optical responses in presence of Au reflector with respect to those observed on NbN pattern standing in air is that the absorptance is enhanced at perpendicular incidence and throughout small polar angles, rather than at very large tilting. This indicates that the application of reflectors makes possible to reach higher absorptance values in those arrangements, which are experimentally more easily implementable (Fig. 6a).
Fig. 6. Optical response of the system consisting of NbN pattern in Au reflector covered quarter-wavelength HSQ nano-cavity: (a) dual-angle-dependent absorptance determined by calculations performed over the
and intervals, with ]
90 0 [ − °
γ = ϕ=[0−85°] Δγ =Δϕ=5° resolution. (b) The comparison of the optical responses determined by FEM in P-structure-configuration (γ=0°, full triangles) and in S-structure-arrangement (γ=90°, empty triangles) with optical responses determined by TMM (line). There is a local minimum at 35.05°
and a local maximum at 70° on the NbN absorptance. The origins of these extrema are detailed in the text. The results of FEM and TMM calculations in [34°, 36°] interval with Δϕ=0.05° resolution are incorporated into the graphs originating from computation performed with Δϕ=1° resolution in [0°, 85°] region.
Figure 6b indicates in more details the effect of the polar angle tuning in presence of Au reflector. The comparison of the NbN absorptance curves in Figs. 2b-4b-6b proves that the reflector results in the largest absorptance of 67.6 % in case of P-structure-configuration. This
value is approximately 1.5 times larger, than the 46.5% absorptance observed in case of S- structures at perpendicular incidence [7].
The absorptance is larger in presence of reflector, then in case of NbN pattern standing in air trough 43° and 47° incidence angles, while it crosses the absorptance curve of NbN below HSQ nano-cavity at 50° and 51° polar angles in case of P- and S-structures. There is a local minimum close to the TIR at sapphire-air interface where the absorptance is reduced to 53.9 % and 38.7% values. The 35.05° polar angle corresponding to these minima reveals to an ATIR phenomenon. A global minimum appears at 57°, which is followed by a local maximum at 70° in P- and S-structures too, but with 25 % and 15.1 % absorptance originating from NbN-loss related ATIR.
The Au absorptance indicates a local maximum at 35.15° and a global maximum at 55° and 53° in case of P- and S-structures, confirming that the minima in NbN absorptance are in the polar angle intervals, where the TIR is frustrated caused by losses in gold too. These orientations result in surface plasmon mode excitation, since the projection of the light wave vector matches the wave vector of plasmons propagating at the air-gold and at the HSQ-gold boundary at these polar angles [7].
The transmittance is suppressed in the entire polar angle interval, only a slight transmittance is observable at 35.05° on the FEM curves. These little artifacts are caused by the near-field signal subtraction in close proximity of gold reflector supporting SPPs.
The average of the FEM signal does not equal with the TMM, as the S-structure absorptance approximates it through the entire polar angle interval, while the the P-structure absorptance is much larger throughout the global minimum. After this extremum there is only a slight difference between the signals predicted by FEM and TMM.
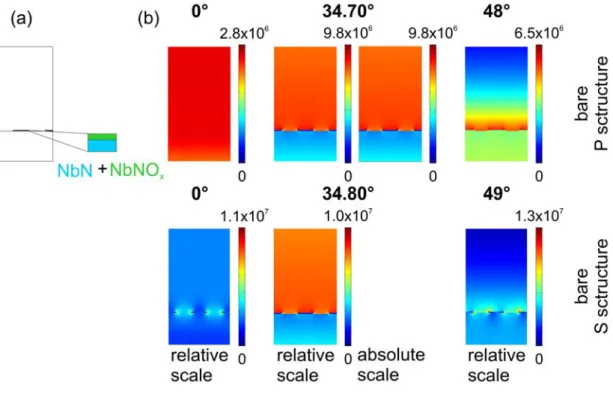
3.3.2. Near-field phenomena on NbN pattern below Au reflector covered HSQ nano-cavity Figure 7 indicates that there is an E-field antinode at the bottom of the cavity due to the reflector at perpendicular incidence, which explains the very large available absorptance. The perpendicular incidence is the optimal illumination of this system in both arrangements.
A surface plasmon mode related field enhancement can be seen above the cavity at the local NbN absorptance minimum, indicating that this highly intensive field is far and separated from the NbN stripes. The Au absorptance occurs as a cost of NbN absoptance at this orientation.
There is an E-field enhancement inside the entire cavity at the local maxima, but the local field intensity is the smallest below the reflector from the three systems studied at the orientations corresponding to NbN absorptance. The reasons are that a part of the EM-field
intensity is absorbed in the gold reflector, and the cavity length is not re-optimized for these large tiltings.
Fig. 7. (a) Schematic drawing showing two unit cells in a plane perpendicular to the 200 nm periodic NbN pattern, where the near-field cross-sections were investigated. (b) The E-field distribution on NbN pattern in Au reflector covered quarter-wavelength HSQ nano-cavity: first row P-structure configuration, second row S- structure-arrangement. The cross-sections were taken at perpendicular incidence and at polar angles corresponding to local minimum and maximum in NbN absorptance, and presented on a scale to illustrate better small variations in the field. The pictures on the right side at 35.05° are plotted using the same scale in [V/m], as in Figs. 3-5. (c) The comparison of the resistive heating inside the NbN in P- and S-structure configuration along the line indicated on inset (a).
The line cross-sections taken at the middle of the NbN stripes indicates that the resistive heating inside the NbN stripes indicates similar polar angle independent distribution characteristic for P-structure-configuration and in S-structure arrangement. The largest values are observable at perpendicular incidence according to the global maxima on the absorptance (Figure 7c).
5. Conclusion
The most important result of these calculations is that optimization of the illumination angle of the absorbing patterns can help to optimize the NbN absorptance, indicating that all of the three studied optical systems are promising in specific SNSPD applications. Based on FEM results it was possible to select the optimal relative orientation of the NbN stripes with respect to the incidence plane of the p-polarized light, which is the P-structure configuration resulting in E-field oscillation parallel to the stripes. It was shown that optical phenomena
accompanying TIR are at play in all of these systems. The optimal polar angles resulting in maximal absorptance were determined too, these are the polar angle resulting in NbN related ATIR in case of bare NbN pattern, the polar angle corresponding to TIR at sapphire-air interface in case of NbN stripes below HSQ nano-cavity, and perpendicular incidence in optical system consisting of a gold reflector covered HSQ nano-cavity. We provided examples for absorptance maximization by turning the p-polarized light illumination related phase shift at TIR via quarter-wavelength nano-optical cavity in optical system 2, and ensuring the overlapping of the E-field antinodes with absorbing NbN segments via reflectors in optical system 3.
Acknowledgement
This work has been supported by the U.S. Dept. of Energy Frontier Research Centers program and by the Hungarian OTKA foundation from the National Innovation Office (NIH), under grants No OTKA-NKTH CNK 78459 and OTKA-NKTH K 75149. Maria Csete would like to thank the Balassi Institute for the Hungarian Eötvös post-doctoral fellowship. The authors would like to thank for the helpful discussions with E. Driessen and M. de Dood and Comsol engineers in Burlington.
The publication/presentation is supported by the European Union and co-funded by the European Social Fund.
Project title: “Broadening the knowledge base and supporting the long term professional sustainability of the Research University Centre of Excellence at the University of Szeged by ensuring the rising generation of excellent scientists.”
Project number: TÁMOP-4.2.2/B-10/1-2010-0012
Professor Karl K. Berggren contributed to the initial concept of the paper by suggesting the comparison of different optical systems, Áron Sipos and Faraz Najafi prepared the models for numerical simulation, while Mária Csete analyzed the results and prepared the manuscript.
References
[1] Gol'tsman, G. N., Okunev, O., Chulkova, G., Lipatov, A., Semenov, A., Smirnov, K., Voronov, B. M., Dzardanov, A., Williams, C., and Sobolewski, R., „Picosecond superconducting single-photon optical detector,” Appl. Phys. Lett. 79(6) 705-708 (2001).
[2] Rosfjord, K. M., Yang, J. K. W., Dauler, E. A., Kerman, A. J., Anant, V., Voronov, B. M., Gol'tsman, G. N., and Berggren, K. K., ”Nanowire Single-Photon detector with an integrated optical cavity and anti-reflection coating,” Optics Express 14(2) 527-534 (2006).
[3] Hu, X., Dauler, E. A., Molnar, R. J., Berggren, K. K., „Superconducting nanowire single- photon detectors integrated with optical nano-antennae,” Optics Express 19(1) 17-31 (2011).
[4] Driessen, E. F. C., Braakman, F. R., Reiger, E. M., Dorenbos, S. N., Zviller, V., A. de Dood, M. J., „Impedance model for the polarization-dependent optical absorption of superconducting single-photon detectors,” The European Journal Applied Physics 47 1071/1- 6 (2009).
[5] Anant, V., Kermann, A. J., DAuler, E. A., Yang, J. K. W., Rosfjord, K. M., Berggren, K.
K., „Optical properties of superconducting nanowire single-photon detectors,” Optics Express 16(14) 10750-10761 (2008).
[6] Driessen, E. F. C. and de Dood, M. J. A., ”The perfect absorber,” Appl. Phys. Lett. 94 171109/1-3 (2009).
[7] Csete, M., Sipos, Á., Najafi, F., Hu, X., Berggren, K. K., “Numerical method to optimize the polar-azimuthal orientation of infrared superconducting nanowire single photon detectors,” accepted in Applied Optics.

![Fig. 2. Optical response of the system consisting of NbN pattern standing in air: (a) dual-angle-dependent absorptance determined by calculations performed over the γ = [ 0 − 90 ° ] and ϕ = [ 0 − 85 ° ] intervals, with](https://thumb-eu.123doks.com/thumbv2/9dokorg/1166907.84990/6.892.113.757.626.886/optical-consisting-dependent-absorptance-determined-calculations-performed-intervals.webp)
![Fig. 4. Optical response of the system consisting of NbN pattern in quarter-wavelength HSQ nano-cavity: (a) dual-angle-dependent absorptance determined by calculations performed over the γ = [ 0 − 90 ° ] and](https://thumb-eu.123doks.com/thumbv2/9dokorg/1166907.84990/9.892.107.758.405.676/optical-consisting-wavelength-dependent-absorptance-determined-calculations-performed.webp)