is published by the American Chemical Society. 1155 Sixteenth Street N.W., Washington, DC 20036
Dioxane Induced Structural Changes of Biomembrane Models
Zsófia Borbála Rózsa, Lukács József Németh, Balazs Jojart, Károly Nehéz, Béla Viskolcz, and Milán Sz#ri
J. Phys. Chem. B, Just Accepted Manuscript • DOI: 10.1021/acs.jpcb.9b04313 • Publication Date (Web): 27 Aug 2019 Downloaded from pubs.acs.org on August 27, 2019
Just Accepted
“Just Accepted” manuscripts have been peer-reviewed and accepted for publication. They are posted online prior to technical editing, formatting for publication and author proofing. The American Chemical Society provides “Just Accepted” as a service to the research community to expedite the dissemination of scientific material as soon as possible after acceptance. “Just Accepted” manuscripts appear in full in PDF format accompanied by an HTML abstract. “Just Accepted” manuscripts have been fully peer reviewed, but should not be considered the official version of record. They are citable by the Digital Object Identifier (DOI®). “Just Accepted” is an optional service offered to authors. Therefore, the “Just Accepted” Web site may not include all articles that will be published in the journal. After a manuscript is technically edited and formatted, it will be removed from the “Just Accepted” Web site and published as an ASAP article. Note that technical editing may introduce minor changes to the manuscript text and/or graphics which could affect content, and all legal disclaimers and ethical guidelines that apply to the journal pertain. ACS cannot be held responsible for errors or consequences arising from the use of information contained in these “Just Accepted” manuscripts.
Molecular Dynamics and Metadynamics Insights of 1,4- Dioxane Induced Structural Changes of Biomembrane Models
Zsófia Borbála Rózsa
a, Lukács József Németh
b, Balázs Jójárt
b, Károly Nehéz
c, Béla Viskolcz
a, Milán Szőri
a*a
Institute of Chemistry, University of Miskolc, Egyetemváros A/2, H-3515 Miskolc, Hungary
b
Department of Food Engineering, Faculty of Engineering, University of Szeged, Mars tér 7. 6724, Szeged, Hungary
c
Department of Information Engineering, University of Miskolc, Miskolc- Egyetemváros Informatics Building, H-3515 Miskolc, Hungary
*e-mail: milan.szori@uni-miskolc.hu
2 3 4 5 6 7 8 9 10 11 12 13 14 15 16 17 18 19 20 21 22 23 24 25 26 27 28 29 30 31 32 33 34 35 36 37 38 39 40 41 42 43 44 45 46 47 48 49 50 51 52 53 54 55 56 57 58 59 60
Abstract
1,4-dioxane is a cytotoxic B2 type human carcinogen, a serious water pollutant produced solely by industrial activity. The effect of 1,4-dioxane on phospholipid membrane models composed by DPPC and its branched isomer (IPPC) was investigated using MD simulations. Clear and polluted membranes were compared by membrane parameters such as APL, VPL, compressibility modulus, membrane thickness and orderliness of lipid tails. While neat systems significantly differ from each other, the presence of the pollutant has the same effect on both types of lipid membranes: high density of dioxane appears at the vicinity of ester groups which pushes away lipid headgroups from each other, leading to an overall change in lipid structure: APL and VPL grows, while the orderliness of lipid tails, membrane thickness and compressibility modulus decreases. Orientational preferences of water and dioxane molecules were also investigated and different membrane regions have been specified according to the stance of water molecules. Free energy profile for 1,4-dioxane penetration mechanism into DPPC membranes was carried out using metadynamics for two different concentrations of the pollutant (c1=7.51 g/dm3, c2=75.10 g/dm3), which showed that the higher the concentration is, the lower the free energy of penetration gets. Only a small free energy barrier was found in the headgroup region and accumulation of dioxane is thermodynamically unfavored in the middle of the bilayer. The penetration mechanism has been described in detail based on the orientational preference of 1,4-dioxane molecules and the free energy profiles.
2 3 4 5 6 7 8 9 10 11 12 13 14 15 16 17 18 19 20 21 22 23 24 25 26 27 28 29 30 31 32 33 34 35 36 37 38 39 40 41 42 43 44 45 46 47 48 49 50 51 52 53 54 55 56 57 58 59 60
Introduction
The passive membrane permeation of small molecules plays important role in their disposition and toxicity 1. Passive diffusion is the main limitation of penetration of small molecules and thus the barrier for their infiltration into living cells (human, animal and bacteria). A key property of the passive transport of an investigated substance is its partitioning between water and membrane phases which is affected by the kinetics and thermodynamics of the specific permeation process 2,3,4.
In most mammalian and bacterial cells phospholipids compose the base of the lipid bilayer with different types of head groups. In eukaryotic cells phosphatidylcholine (PC) is the most commonly found headgroup type for phospholipids (~50%), but others, like phosphatidylserine phosphatidylethanolamine, sphingomyelins and cholesterol can also be found as membrane components 5. In the case of prokaryotic cells it is estimated that only 10% of bacteria produces phosphatidylcholines, while phosphatidylglycerols and phosphatidylethanolamines are the most common lipid types 6. Thus both experimental and theoretical models usually utilize simple phospholipid bilayers to understand solute permeation processes 2.
In terms of lipid chains several different types can be observed in cells, which can be characterized by their length, degree of unsaturation and branching. Branching fatty acids are widespread mostly among bacterial cell membranes. The most common ones contain one methyl group at the iso or anteiso position of the fatty acid 7,8. In general both poly- and monomethyl- branching is associated with increasing the area per lipid, while decreasing the bilayer thickness and lowering chain ordering, thus enhancing the fluidity of the plasma membrane 8,9. It has great importance in case of archaea and bacteria living in extreme conditions 8. Iso- and midchain methyl- branching is associated with increasing the tolerance of the cell membrane to toxic compounds 10. In the case of polymethyl-branching fatty acids - like phytanyl and phitanoyl - containing membranes it has been suggested, that they enhance the structural stability of cell membranes thus making it less permeable to water molecules, ions and small solutes compared to cell membranes composed of only straight chained lipids 11, but through computational studies it has been proven that branching has no significant effect on the partition coefficients of neutral solutes 12. These molecules have also been associated with the disturbance of the membrane interior's cavity distribution 12 which leads to a reduced amount of water molecules diffusing inside the membrane, while their mobility is also reduced.
Membrane/water interfaces are critical to many cellular functions. Water influences stability, fluidity and phase behavior of phospholipid membranes, and also has a crucial role in the electric properties of the bilayer 13,14. Both experiments and molecular simulations have shown that water molecules lose their bulk-like nature near membrane surfaces 15,16,17,18. Translational mobility and rotational entropy of individual water molecules decrease when their interactions with the lipid
2 3 4 5 6 7 8 9 10 11 12 13 14 15 16 17 18 19 20 21 22 23 24 25 26 27 28 29 30 31 32 33 34 35 36 37 38 39 40 41 42 43 44 45 46 47 48 49 50 51 52 53 54 55 56 57 58 59 60
headgroups become stronger 19 resulting in different interfacial water regions according to the membrane composition 13,20. The total membrane dipole potential is a manifestation of the non- random orientation of the electric dipoles of headgroups, carbonyl groups and water 14,15. The hydrating water molecules form an ordered, typically 1-2.5 nm thick stable layer (maximum 5 layers of structured water) at the membrane interface 13, where adjacent water molecules are oriented by the headgroups as the dipoles of individual water molecules are aligned against the bilayer dipole 14. The ester groups on the internal side of the headgroups can also establish hydrogen bonds closest to the bilayer center, which helps to create the dense, ordered state at the region of the acyl chains of the phospholipids, thus creating a barrier of penetration 14. These layers are stable enough to present multiple energy barriers to approaching nanoscale objects 16,21. Preferred molecular orientations can capture most of the structural features of these interfacial layers and they can be used for defining interfacial sublayers. The orientation of molecules relative to a membrane/water interface can be analyzed in terms of the orientation statistics of various vectors bound to the target molecule 22,23,24.
Due to the complex nature and structure of biomembranes, its sublayers can be split into regions with different characteristics. There are several ways to split up the bilayer based on the investigated phenomena 25,26 from which we hereby adapted the four region model proposed by Marrink and Berendsen 27:
Region I: The outer region of lipid bilayers, where the orientation of water molecules is already perturbed due to the headgroups and thus their diffusion constants, molecular orientations and solubilities differ from the aqueous bulk. Its border can be defined where lipid and water densities become comparable.
Region II: Highly structured region with a high mobile charge density of the head groups which can be a limiting factor for the penetration of polar and charged molecules. According to the original definition this region lasts until water density drops below 1%.
Region III: A region with high lipid chain density. It is considered as the main barrier for the permeation process of small molecules, as hydrophilic penetrants are not soluble in this region and water density is below 1% 28.
Region IV: The middle of the bilayer where terminal methyl groups are found in the presence of a high fraction of free volume, therefore it is also called a low acyl chains density region.
Molecular Dynamics (MD) is a powerful tool to describe and understand the time evolution of a computational model of a complex chemical (biochemical) system. In the case of classical MD simulations the interatomic interactions are described by force fields – which are mathematical expressions describing the dependence of the systems potential energy on the atomic positions –, and atomic motions with the Newtonian equations of motion 29. MD enables a thorough view of structure and dynamics of the simulated system and can provide relevant details which would be either
2 3 4 5 6 7 8 9 10 11 12 13 14 15 16 17 18 19 20 21 22 23 24 25 26 27 28 29 30 31 32 33 34 35 36 37 38 39 40 41 42 43 44 45 46 47 48 49 50 51 52 53 54 55 56 57 58 59 60
inaccessible or expensive and time consuming via experiments 30. In the case of biological membranes several studies have been carried out recently with the help of MD to understand - for example - the structure and phase transition of membrane models of different lipid compositions 31,32; the self- assembly of bilayers 33,34; the effect of ions 35; interactions with proteins 36,37; the permeation of small molecules 3,38,39,40,41.
While the structural changes of such processes can be understood via the analysis of general membrane parameters 42,43, the energetic properties of the interactions remain hidden. The partitioning and preferred position of an interacting molecule – like in the case of membrane penetration – can be determined by a free energy profile along the bilayer normal where the change in the free energy provides a clear view whether a process is thermodynamically favorable or not.
Thus free energy calculations are an efficient tool to estimate kinetic and dynamic characteristics of chemical and biological processes, like rate constants, permeability coefficients or ionic conductance
44,45. To obtain the free energy profile of such process classical MD simulations are not well suited, as high free energy barriers restrict the detailed sampling of the entire configuration space as the system is likely to be found trapped in local free energy minima. Thus enhanced sampling algorithms were developed which bias the system towards high energy regions which would be inaccessible otherwise 38,46 such as umbrella sampling 47, adaptive biasing 48, thermodynamic integration 49, metadynamics 50,51 and its improved version, well-tempered metadynamics 52.
1,4-dioxane (C4H8O2, MDIOX=88.11 g/mol) is a pleasant odour synthetic industrial chemical with no known natural sources. Before the Montreal Convention it has been used as a stabilizing agent for chlorinated solvents, primarily during the production of 1,1,1-trichloroethane (TCA).
Nowadays, it is a widely used industrial solvent during the production of organic compounds, disinfectants, cooling liquids and hygienic products. It also appears as a side product of several industrial processes, like PET manufacturing 53,54. 1,4-dioxane pollution has been detected all over the world in different areas, from surface water, groundwater to landfills, mostly coming from industrial wastewater, industrial waste and illegal dumping 54,55,56.
At the same time 1,4-dioxane has several health effects. Inside the body it is instantly adsorbed through the lungs and the gastrointestinal tract, and distributes quickly and uniformly between the lungs, liver, kidney, spleen, colon and skeletal muscle tissues. Animal studies proved 54 that it causes kidney and liver cancer, thus it is considered as a B2 type ‘Probable human carcinogen’ 57. 1,4- dioxane appears to be a typical cytotoxic carcinogen, but it requires a high level of exposure for its metabolism to happen 58. As the substance has nonlinear toxicokinetics it can accumulate in the body, mostly in the liver. In rats it has been shown that its half-life increases with the dose of 1,4-dioxane from 1h to 14h 59. 1,4-dioxane eliminates the body after its metabolism into 2-(2- hydroxyethoxy)acetic acid (HEAA) via urination, of which the amount depends on the consumed
2 3 4 5 6 7 8 9 10 11 12 13 14 15 16 17 18 19 20 21 22 23 24 25 26 27 28 29 30 31 32 33 34 35 36 37 38 39 40 41 42 43 44 45 46 47 48 49 50 51 52 53 54 55 56 57 58 59 60
dose 60.
The physico-chemical properties of 1,4-dioxane make it a dangerous and persistent groundwater pollutant, as it is almost completely miscible with water 61, its density is roughly the same as water (1.0329 g/mL) 62 and its low octanol-water partition coefficient (logKOW=-0.27) 63, 64 indicating that it is also compatible with lipophilic matrices.
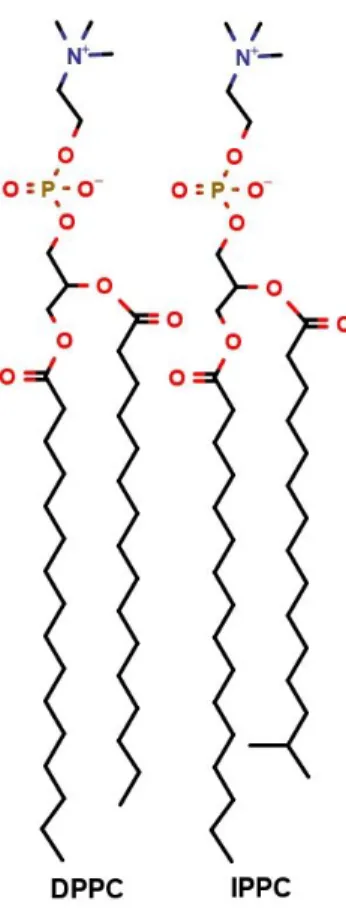
Despite the amphiphilic nature of 1,4-dioxane and its serious health risk, to the best of our knowledge, neither its passive membrane permeation nor its effect on the membrane structure was not investigated yet. Therefore, the aim of our study was to get detailed information about structural changes in biomembranes caused by 1,4-dioxane using DPPC (dipalmitoyl-phosphatidylcholine) and IPPC (isodipalmitoyl-phosphatidylcholine, 1-14-methylpentadecanoyl-2-palmitoyl- phosphatidylcholine, 14-MpPPC, Figure 1) model membrane systems. DPPC membranes are one of the most extensively investigated model bilayer systems 65, 28 and IPPC only differs in a branching methyl group at the C14 position of one of the hexadecanoates 9. Changes induced by 1,4-dioxane are analyzed through the inflicted alterations in general membrane parameters, density profiles, area per lipid (APL), volume per lipid (VPL), isothermal compressibility (KA), deuterium order parameter (SCD) and membrane thickness (DHH). To thoroughly describe the penetration mechanism orientations of water and the pollutant molecules in the membrane/water interfacial regions were described using vectors bound to the molecules. Furthermore, we also determined the concentration dependence of the height of the free energy barrier of 1,4-dioxane penetration in order to estimate how easily it can cross biomembranes to exert its carcinogenic effects.
2 3 4 5 6 7 8 9 10 11 12 13 14 15 16 17 18 19 20 21 22 23 24 25 26 27 28 29 30 31 32 33 34 35 36 37 38 39 40 41 42 43 44 45 46 47 48 49 50 51 52 53 54 55 56 57 58 59 60
Figure 1 2D structure of DPPC and IPPC molecules 2
3 4 5 6 7 8 9 10 11 12 13 14 15 16 17 18 19 20 21 22 23 24 25 26 27 28 29 30 31 32 33 34 35 36 37 38 39 40 41 42 43 44 45 46 47 48 49 50 51 52 53 54 55 56 57 58 59 60
Methods
System Preparation
Total four different systems were used to understand the effects of 1,4-dioxane: DPPC and IPPC model membranes, and DPPC and IPPC membranes (Figure 1) in the presence of the pollutant molecule. Throughout this work pure systems will be referred to as 'clear', and 1,4-dioxane containing systems as 'polluted' systems. Initial membrane configurations have been generated using automated online membrane builder, CHARMM-GUI 66,67. The simulated systems consisted of 128 (nlipid = 128, 64-64 lipid molecules each membrane leaflet, which size have been proven to be sufficiently large to reproduce membrane structural parameters 3,38,41,68,69) either DPPC or IPPC molecules, with 50 water molecules per headgroup (nwater=6400 in total), which is well above the value of the water molecules needed for total hydration of bilayer 70. In the case of polluted systems an additional 100 1,4-dioxane molecules have been inserted into the simulation box in random positions. Such high concentration (75.102 g/dm3) had been chosen to exaggerate studied effects to distinguish it from statistical noise as suggested by Oh and Klein 71. Lipid molecules were modelled by CHARMM36 72, water molecules by CHARMM TIP3P 73 and CGenFF 74 force field parameters were applied for 1,4-dioxane molecules in a cubic simulation box using periodic boundary conditions. All dynamics calculations were carried out using GROMACS 5.1.2 75, while VMD 76 was used for molecular visualization.
Parameters of MD simulations
Production runs have been set up with an equilibration protocol where the number of optimization steps has been maximized at 5000. This was followed by a 25 ps long simulation using NVT ensemble where at first the P atoms were restrained to their positions with a 1000 kJ/(mol·nm2) force constant along axis z to prevent decomposition of the bilayer 72. The next equilibration step was 800 ps long in an Npsemi-isotropicT ensemble. The temperature (T = 330 K, above the phase transition temperature, which is 313.35-313.45K experimentally 77,78,79) and pressure (p = 1 atm) was set using Berendsen temperature and pressure control 80, where the value of coupling constants were chosen as τT = 1.0 ps and τp = 5.0 ps. Non-bonded interactions have been calculated using 1.2 nm cut-off value
72, while the long distance electrostatic interactions have been accounted using smooth Particle Mesh Ewald summation method 81. During calculations the heavy-atom-hydrogen distances have been fixed by the means of P-LINCS algorithm 82 with the exception of water molecules which have been kept rigid by using SETTLE 83. The equations of motion were integrated in 2 fs time steps and structures have been saved to a trajectory file every 10 ps. Further simulations have been carried out in Npsemi- isotropicT ensemble using Nosé-Hoover temperature 84,85 and Parrinello-Rahman pressure 86 control for 125 ns. Temperature and pressure values were the same as during previous Npsemi-isotropicT equilibration to maintain a biologically relevant liquid-crystalline (Lα) phase. Out of these simulations
2 3 4 5 6 7 8 9 10 11 12 13 14 15 16 17 18 19 20 21 22 23 24 25 26 27 28 29 30 31 32 33 34 35 36 37 38 39 40 41 42 43 44 45 46 47 48 49 50 51 52 53 54 55 56 57 58 59 60
the first 25 ns were considered as part of the equilibration protocol, as the box sizes were still drastically changing in the case of 1,4-dioxane polluted systems, thus it was left out from the analysis, and the remaining 100 ns was considered as the production run. For each system 5 parallel production runs were conducted, resulting in 500 ns of total simulation for clear and polluted systems.
Analysis of structural membrane parameters
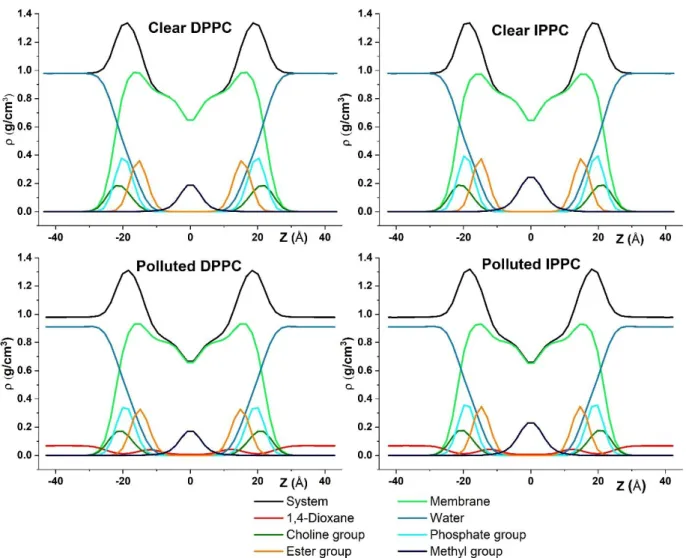
The analysis of membrane parameters was carried out using the equations listed in Table 1.
Membrane thickness was calculated as the distance between the two peaks of the electron density profiles of the systems 87.
Table 1 Definition of the used membrane parameters.
Membrane
parameter Definition Formula Abbreviation
APL Area per lipid 88 2 ×𝐿𝑥×𝐿𝑦
𝑛𝑙𝑖𝑝𝑖𝑑
L: average x and y dimensions of the
simulation box
VPL Volume per lipid 88 𝑉𝑏𝑜𝑥― 𝑛𝑤𝑎𝑡𝑒𝑟𝑉𝑤𝑎𝑡𝑒𝑟― 𝑛𝑑𝑖𝑜𝑥𝑎𝑛𝑒𝑉𝑑𝑖𝑜𝑥𝑎𝑛𝑒 𝑛𝑙𝑖𝑝𝑖𝑑
Vbox: average volume of the simulation box Vwater: the volume of a TIP3P water molecule
(0.03053 nm3) 87 Vdioxane: derived from the density of neat 1,4 dioxane (1.03 g/cm3 54
- 0.146 nm3) KA
Isothermal compressibility modulus,
a dynamic parameter to measure stress resistance
of the membrane 89
2𝑘𝐵𝑇⟨𝐴𝑃𝐿⟩
𝑛𝑙𝑖𝑝𝑖𝑑𝜎𝐴𝑃𝐿2
kb: Boltzmann’s constant T: temperature σAPL2: the variance of
APL
SCD
Deuterium order parameter, which measures the orientation
of C-H bonds with respect to the bilayer
normal 87
1
2⟨3cos2𝛩 ― 1⟩
Θ: the angle between bilayer normal (Z) and
the vector between Ci-Hi
Definition of vectors bound to water and 1,4-dioxane molecules
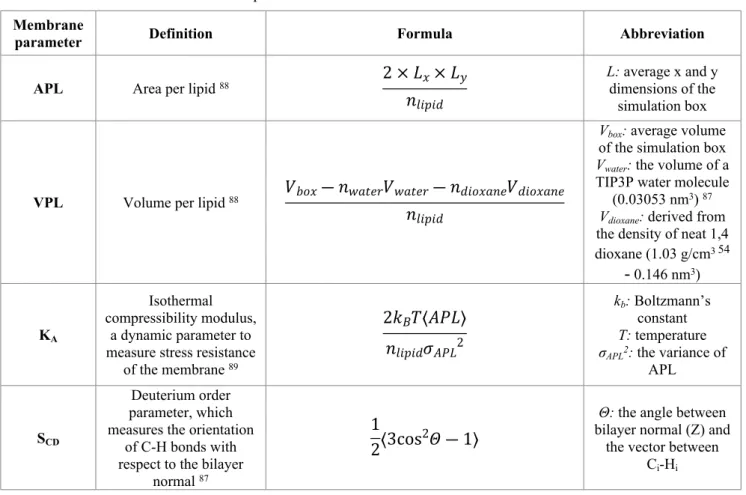
To be able to describe the orientational preference of water and 1,4-dioxane molecules in the membrane/water interface vectors were defined bound to each investigated species. Three local vectors have been defined to describe the orientation of water molecules (upper panel of Figure 2):
the dipole vector (z), the normal vector (x) and the vector joining the two hydrogen atoms (H-H vector, y) in order to obtain their relative orientation to the membrane surface normal (Z). Their orientation is characterized by their angles denoted α, β and γ respectively, formed with the interface normal. In
2 3 4 5 6 7 8 9 10 11 12 13 14 15 16 17 18 19 20 21 22 23 24 25 26 27 28 29 30 31 32 33 34 35 36 37 38 39 40 41 42 43 44 45 46 47 48 49 50 51 52 53 54 55 56 57 58 59 60
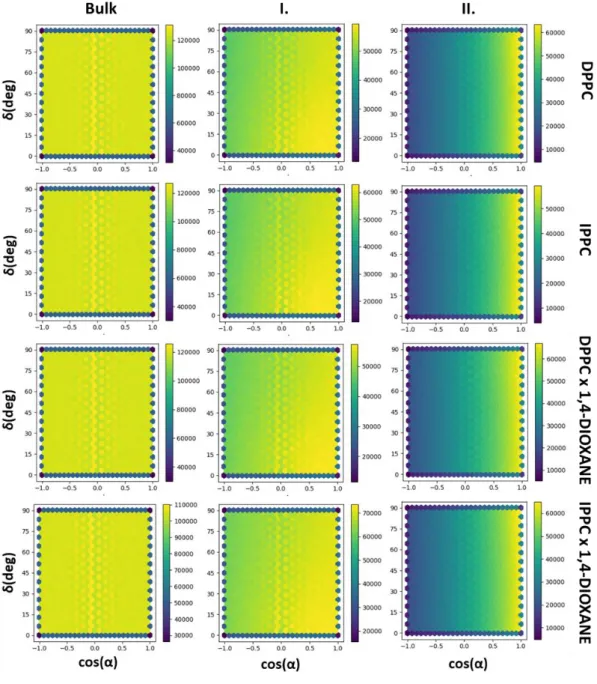
the case of 1,4-dioxane two vectors and the corresponding angles (α, β in the bottom panel of Figure 2) have been chosen, the vector joining the two oxygen atoms (O-O vector, z), and the normal of this vector (x). It should be noted that due to the symmetry of the molecules the molecular normal, and H-H vectors can be directed in two opposite directions, and there is no physical way to distinguish them. Therefore, their corresponding angles (β and γ) can only be scattered between 0° and 90°, and thus their cosines between 0 and 1, while α angles defined by the dipole moment vector of water or O-O vector of dioxane (as a direction is defined by selecting the O-O vector) can fall into the entire angular range of 0° to 180°, and cosine range of -1 and 1. To make interpretation easy for their ensemble averages, uniformly distributed orientation belongs to value 0, which is the case for the expected value ( ), of 〈 〉 cos(α), while cos(β) and cos(γ) must be shifted downwards by 0.5. To characterize the variations of the average alignment of water and dioxane molecules along the interface normal axis, Z has been divided into 1 Å slices, where Φα(Z), Φβ(Z) and Φγ(Z) – orientational function – profiles have been calculated, defined as:
Φα(𝑍) =ρ(𝑍)〈cos(α)〉(𝑍) Eq. 1 Φβ(𝑍) =ρ(𝑍)〈cos(β) ―0.5〉(𝑍) Eq. 2 Φγ(𝑍) =ρ(𝑍)〈cos(γ) ―0.5〉(𝑍) Eq. 3
where ρ(Z) is the number density of the molecule (water or dioxane) in the corresponding slice of the simulation box. It is important to note that while any two of these angles can describe the orientation of a single molecule relative to the interface, these angles are not independent of each other. To create bivariate angle distribution maps of the water and 1,4-dioxane molecules two independent angles have been chosen as angular polar coordinates of the interface normal vector (Figure 2): α and δ, which are the angle of the molecular dipole vector enclosing with the bilayer normal, and the angle formed by the molecular normal vector and the projection of the interface normal (Z) to the plane perpendicular to the molecular dipole vector (xy plane, shown in blue in Figure 2), respectively. For local Cartesian coordinates were fixed to each investigated molecule, where x-axis corresponds to the molecular normal, y to the H-H and z to the molecular dipole vector (Figure 2). It should be noted, that angle δ can always be chosen in a way to fall in the range of 0°≤ δ ≤ 90° because the normal can point towards two opposite directions.
2 3 4 5 6 7 8 9 10 11 12 13 14 15 16 17 18 19 20 21 22 23 24 25 26 27 28 29 30 31 32 33 34 35 36 37 38 39 40 41 42 43 44 45 46 47 48 49 50 51 52 53 54 55 56 57 58 59 60
Figure 2 Definition of the local vectors (x,y,z) bound to water and 1,4-dioxane molecules. The orientation of the molecules relative to the membrane normal (Z) are defined by α, β, γ, δ.
Free energy calculations
In metadynamics 50,52, a history-dependent bias potential (P(s,t)) is calculated along a collective variable (s), which itself is a function of the positions of the particles throughout the simulation time (t). The bias potential appears during the simulations as a repulsive Gaussian, centered on the explored points of a collective variable space (CV(s)), leading the system towards previously unexplored configurations. These Gaussians have a preassigned width (σ) and height (ω) and are deposited at every time step (t’) as the simulation proceeds, where the collective variable has a value of s(t’). Then the bias potential can be calculated the following way:
𝑃(𝑠,𝑡) =𝜔0
∑
𝑡′<𝑡
e
(𝑠 ― 𝑠(𝑡′))2
2𝜎2 Eq. 4
By adding these Gaussians the system is discouraged of the exploration of already visited states of CV(s), and their sum provides an immediate estimate of the free-energy surface (F(s)) 50.
While metadynamics has been used successfully in a large variety of membrane penetration studies of different small molecules 90,91,92,93,94 it still has problems arising from that the free energy not converges to an exact value but fluctuates around the correct result as similar sized Gaussians are deposited along the CV 52,38. Thus well-tempered metadynamics (WT-MD) 52 was proposed, where the height of the hills decreases as passing by previously mapped regions of the free energy profile which enables the convergence of the profile to an exact value 95,46. The rescaling of the height of the Gaussians (ωt’) goes the following:
𝜔𝑡′=𝜔0𝑒―
𝑃(𝑠,𝑡′)
𝑘𝐵𝛥𝑇, Eq. 5
where ΔT is an input parameter in units of temperature and kB is the Boltzmann constant. Than if we
2 3 4 5 6 7 8 9 10 11 12 13 14 15 16 17 18 19 20 21 22 23 24 25 26 27 28 29 30 31 32 33 34 35 36 37 38 39 40 41 42 43 44 45 46 47 48 49 50 51 52 53 54 55 56 57 58 59 60
replace ω0 to ωt’ in Eq 4, the bias potential on a long time limit converges to:
𝑃(𝑠,𝑡→∞) =―𝑇+𝛥𝑇
𝛥𝑇 𝐹(𝑠) +𝐶, Eq. 6
where C is an arbitrary constant and 𝑇+𝛥𝑇𝛥𝑇 is the bias factor in which T is the simulation temperature.
To characterize the energetic nature of the penetration mechanism of 1,4-dioxane, metadynamics simulation protocols have been carried out using PLUMED 2.3.0 96,97 combined with GROMACS 5.1.4 75. Here, Gaussians were deposited at every 2500 ps, with a height of 0.1 kJ/mol and width of 0.5 Å. Walls for the pulling were set 37 Å from the center of the membrane bilayer. The 1000 ns simulation time was analyzed while other parameters of the metadynamics were identical to the production runs. The free energy profile of the penetration can depend on the concentration of the dioxane, therefore an additional 500 ns long metadynamics simulation had also been carried out for a system having an order of magnitude less dioxane in the simulation box (10 dioxane molecules).
As mentioned before, metadynamics simulations can suffer from convergence issues, thus an additional 600 ns well-tempered metadynamics simulation has been run for the higher pollutant concentration, to have a guess whether the penetration process has a method dependence. During the WT-MD calculations Gaussians were deposited at every 3000 ps, with a height of 2.2 kJ/mol and width of 0.1 Å, while the bias potential was set to be 6.0. Other parameters of the WT-MD were identical to metadynamics calculations.
Results and Discussion Density profiles
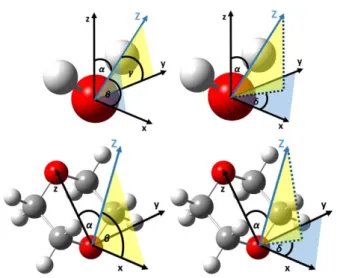
The symmetrized and centered mass density profiles along the membrane normal are shown in Figure 3 for the four studied systems. Besides the total mass density, the spatial contributions of water molecules and 1,4-dioxane as well as that of choline, phosphate, ester and methyl groups of DPPC/IPPC are presented. The obtained electron density profiles of clear DPPC bilayer agrees reasonably well with experimental data 70 and the comparison can be found in the SFigure 1 of Supplementary Information. The clear DPPC and IPPC density profiles differ only in the density for the terminal methyl groups in the middle of the bilayer (at Z ≈ 0 Å) due to the branching of the isopalmitic-acid in IPPC membrane. Presence of 1,4-dioxane as a pollutant affects both membranes similarly. The mass density profile of the pollutant indicates a local maximum at the inner side of the ester groups (at |Z| ≈ 12 Å, which is the border of Region III and IV). Here, dioxane density (ρDIOX, ester = 0.042 g/cm3) is more than half of its aqueous phase density (ρDIOX, bulk = 0.068 g/cm3), while it is significantly smaller for the remaining part of the membrane. In the inner regions of the membrane a small accumulation can be observed around 5 Å distance of the penetrating 1,4-dioxane molecules radial distribution function which can be found in the SFigure 2 of Supplementary Information.
2 3 4 5 6 7 8 9 10 11 12 13 14 15 16 17 18 19 20 21 22 23 24 25 26 27 28 29 30 31 32 33 34 35 36 37 38 39 40 41 42 43 44 45 46 47 48 49 50 51 52 53 54 55 56 57 58 59 60
Furthermore, as an effect of dioxane pollution a slight growth in water density can also be observed at | Z | ≈ 17 Å which means more water molecules can access the high density of acyl chains region (Region III) of the membranes.
Figure 3 Mass density profiles of the membrane systems along the membrane normal (Z). The overall mass densities are decomposed into subsections to highlight the inner structure of the biomembranes. Black – complete system, green – DPPC/IPPC, blue – water, dark green – cholines, cyan – phosphates, orange – esters, dark green – terminal methyl groups, red – 1,4-dioxane.
Area per Lipid
Calculation of area per lipid (APL) is one of the most generally applied test for membrane simulations 98 since APL is accessible experimentally via NMR 99, neutron diffraction 100 or X-ray 101 measurements. It is worth mentioning that literature APL values are scattered in a large range depending on its indirect measurement and state of the membrane phase 98. Based on molecular simulations, the average APL can also be derived from different methods. Conventionally, it is calculated from the lateral dimensions of the simulation box divided by the number of lipids in a membrane leaflet (Table 1), but in this case the APL distribution remains unknown. Besides the
2 3 4 5 6 7 8 9 10 11 12 13 14 15 16 17 18 19 20 21 22 23 24 25 26 27 28 29 30 31 32 33 34 35 36 37 38 39 40 41 42 43 44 45 46 47 48 49 50 51 52 53 54 55 56 57 58 59 60
conventional APL calculation, the average APL can also be obtained via a Voronoi tessellation (VT) based technique for simple and multicomponent lipid bilayers 102,103 as well as complex protein- membrane 104,105 systems. The great advantage of VT technique is that it also provides not only APL distribution beyond the average but also local structural information of the bilayer surface 105. For instance, local disturbances caused by the direct permeation of small molecules can be identified by VT-based APL distribution 106,107,102. To find such local disturbances, the NpT trajectories had been analyzed by a VT-based in-house Python script (powered by Python 2.7 108 and MDAnalysis 0.18.1
109), in which the phosphorous atom was projected to the macroscopic XY surface of the membrane
110, while the periodic boundary conditions were also taken into account. The area belonging to each phospholipid molecule has been calculated as the area of a Voronoi polygon by using Delaunay triangulation 111. The VT-based APL calculation has been carried out for all 5 runs of the individual systems to obtain statistically relevant results. The comparison of the different types of average APL calculations and the distributions of the VT-based calculations are shown in Figure 4 and Figure 5, respectively.
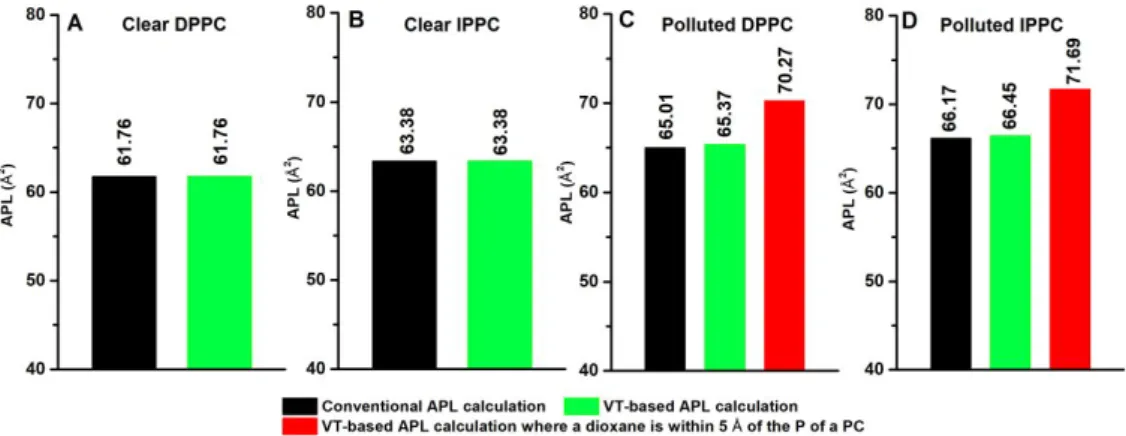
Figure 4 Average area per lipid (APL) calculated by conventional and Voronoi tessellation-based approaches for DPPC and IPPC membranes without (the first two diagrams) and with the presence of 1,4-dioxane (the last two diagrams).
Average APL obtained from all phosphorus atoms using conventional (black) and Voronoi tessellation approach (green).
APL is also calculated from all phosphorus atoms which have 1,4-dioxane molecules within its 5 Å radius (red).
2 3 4 5 6 7 8 9 10 11 12 13 14 15 16 17 18 19 20 21 22 23 24 25 26 27 28 29 30 31 32 33 34 35 36 37 38 39 40 41 42 43 44 45 46 47 48 49 50 51 52 53 54 55 56 57 58 59 60
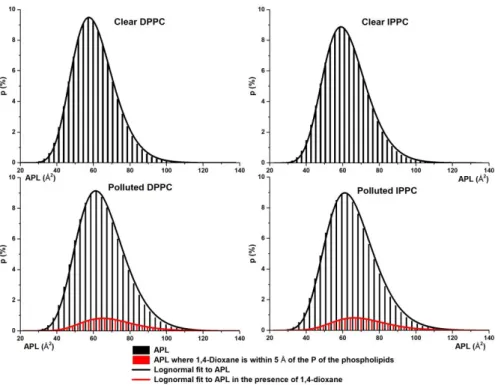
Figure 5 Probability distributions of area per lipid (APL) obtained by Voronoi tessellation approach. The total APL distribution isshown in black while the local APL distribution of phosphorus atoms which have 1,4-dioxane molecules within its 5 Å radius are in red. Lognormal distribution fits are also indicated in the diagrams.
In the case of the clear systems, the average APL values obtained from conventional and VT- based approaches match perfectly (see the first two panels of Figure 4) and their relative deviation from experiment is only 2% in the case of DPPC (APLcalc = 61.76 ± 1.44 Å2 , APLexp = 62.9 ± 1.3 Å2
112), basically within its uncertainty. However, no experimental data was found for IPPC membranes for which the APL value is larger by 1.6 Å2 than that of DPPC membrane due to the branching lipid tail of isopalmitic-acid.
In the presence of dioxane, the average APL values increased by more than 3 Å2 for both DPPC and IPPC membranes. To understand the local disturbances caused by 1,4-dioxane molecules, phosphorous atoms which are within 5 Å of dioxane molecules are selected from the VT-based APL calculation (see red columns in Figure 4 and Figure 5), where the probability distributions of the total and local APL values are calculated and shown in Figure 5. The average of such local APL values found to be significantly larger than that of the conventional APL (more than 8% growth), namely 70.27 Å2 for DPPC and 71.69 Å2 for IPPC membrane which means that the lipid heads are pushed away due to the vicinity of dioxane. It is worth mentioning that the total APL distributions of clear systems are in the range of 30 and 110 Å2 while in the case of polluted systems 30 and 120 Å2 and have an upper tail (shown in black in Figure 5) which can be well described using lognormal distribution. However, assumption of normal distribution and arithmetic mean as expected value results within 2 Å2 of the expected values of APL obtained from the proper lognormal fit (Figure 5) making a reasonable trade-off of APL widely used in the literature 102,113,30.
2 3 4 5 6 7 8 9 10 11 12 13 14 15 16 17 18 19 20 21 22 23 24 25 26 27 28 29 30 31 32 33 34 35 36 37 38 39 40 41 42 43 44 45 46 47 48 49 50 51 52 53 54 55 56 57 58 59 60
Further analyzing the probability distribution functions of Figure 5, the APL value with the highest probability (APL mode) is 57.48 Å2 and 58.60 Å2 for the clear DPPC and IPPC systems, respectively, while they shifted towards larger APL values in the case of polluted system (62.31 Å2 for DPPC and 63.24 Å2 for IPPC).
Volume per lipid, membrane thickness, isothermal compressibility modulus and deuterium order parameter
Volume per lipid (VPL), membrane thickness (DHH), isothermal compressibility (KA) and deuterium order parameter (SCD) have also been calculated based on the equations collected in Table 1. Calculated membrane parameters are shown in Figure 6 for the simulated membrane systems to further understand the effect of 1,4-dioxane pollution. To the best of our knowledge, experimental data is available only for DPPC composed membranes where the calculated results are in excellent agreement with literature values. For example, the relative deviation of VPL and DHH values are less than 2% and 3%, respectively. (VPLcalc = 1214 ± 0,23 Å3 , VPLexp = 1232 Å3 114, DHH,calc = 37.2 ± 4.5 Å, DHH,exp = 38.3 Å 114).
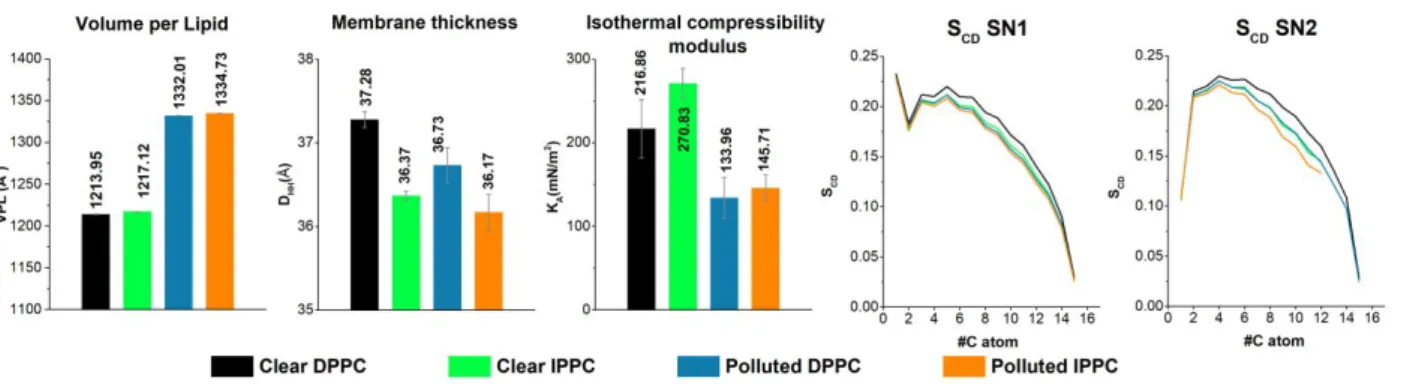
Figure 6 Volume per lipid (VPL in Å3), Membrane thickness (DHH in Å), Isothermal Compressibility (KA in mN/m2) and Deuterium Order Parameter (SCD) of the investigated PC membrane - 1,4-dioxane systems. Clear DPPC and IPPC membrane parameters are indicated with black and green respectively, while polluted DPPC-s are IPPC membranes are indicated with blue and orange, respectively.
Furthermore, a good agreement can be found also for calculated SCD values (for details see SFigure 3 in Supplementary Information), as their average relative deviations from experimental data measured in liquid-crystalline phase 115 are around 7%. The largest relative deviation was obtained in the case of compressibility modulus (KA,calc = 216.9 ± 34.8 mN/m2, KA,exp = 231 ± 20 mN/m2114), which is close to 10%, but uncertainties of KA in experiment and in calculation are still in overlap, therefore our computed results are in acceptable range.
As seen from Figure 6, the computed APL, VPL and compressibility modulus are significantly higher in the case of IPPC membranes than those for DPPC, while the membrane thickness of IPPC membrane is significantly lower, along with the orderliness of the lipid tails
2 3 4 5 6 7 8 9 10 11 12 13 14 15 16 17 18 19 20 21 22 23 24 25 26 27 28 29 30 31 32 33 34 35 36 37 38 39 40 41 42 43 44 45 46 47 48 49 50 51 52 53 54 55 56 57 58 59 60
measured by SCD. Since the branched lipids need larger space in the middle of the bilayer leading to larger disorder, resulting in the reduction of the relative length of such fatty acids. As the relative length of such lipids shortens, their spatial space requirement grows, increasing the APL and VPL of the IPPC composed membranes. The hereby obtained results also agree well with the previous simulations of IPPC and DPPC 9 (IPPC was noted as 14-MpPPC there).
The presence of the pollutant affects both membranes in a similar way, although the degree of the change is different. 1,4-dioxane pollution led to a significant rise in both APL and VPL while the thickness of the membrane, the compressibility modulus and the orderliness of the lipid chains decreased. As clear DPPC was found to be in liquid-crystalline phase and the SCD values of clear IPPC membranes is slightly lower than DPPC, we can assume that it can also be found in Lα phase.
As an effect of the pollution the lipid tails can be found in an even more disordered structure, thus we can be certain that the pollution does not induce phase transition. As mentioned before in the case of mass density profiles, 1,4-dioxane penetrates inside the membrane as deep as the ester groups (Region III) and the pollutant pushes away the membrane headgroups and lipid tails from each other leading to the swelling of the membrane which was already mentioned in the case of APL diagrams (Figure 4 and Figure 5). This swelling leads to a larger available space for the lipid tails, thus turning into a more disordered state with shorter relative length, affecting the membrane thickness. As IPPCs were found in an initially more disordered state, its change in the orderliness of the lipid chains and membrane thickness is less remarkable compared to the change for DPPC.
The most drastic change was found in the case of compressibility modulus. While the clear IPPC membrane has significantly higher KA compared to the clear DPPC membrane (KA,DPPC clear = 216.9 ± 34.9 mN/m, KA,IPPC clear = 270.8 ± 18.14 mN/m), these values dropped for both membranes to similar value (KA,DPPC polluted = 174.8 ± 19.1 mN/m, KA,IPPC polluted = 179.7 ± 17.0 mN/m) due to the 1,4-dioxane pollution. This is an interesting finding in the light of the definition of KA, since compressibility modulus is a quantity for the response of the membrane area to tension, which may come from environmental stress, like perturbations, or the addition of molecules to one of the membrane leaflets 116. Therefore, in this case, smaller KA values mean smaller resistance towards environmental stress. This is in contradiction with the previous literature about branching fatty acids, that iso-branching would increase the tolerance of the cell membranes to toxic compounds 10 and it shows no sign of enhancing the structural stability of the membrane-like phytanyl and phitanoyl 11.
Water orientational profiles and the determination of the interfacial regions
Previous studies proved that based on the orientational order of the water molecules, four different regions can be separated in the membrane interface 23,22,24. By means of orientational functions, charge densities and water density profiles, we have defined the bulk phase and these four
2 3 4 5 6 7 8 9 10 11 12 13 14 15 16 17 18 19 20 21 22 23 24 25 26 27 28 29 30 31 32 33 34 35 36 37 38 39 40 41 42 43 44 45 46 47 48 49 50 51 52 53 54 55 56 57 58 59 60
different regions in the interfacial area, which are in line with the Marrink and Berendsen model 27. Data will only be discussed regarding the negative side of the membrane normal Z. As the interface normal is fixed to point from the negative side to the positive, and α can be in the range of 0 and 180°, opposite orientations can be observed on the two sides of the membrane in the case of dipole orientation distribution. If the molecules do not have preferential alignment, then Φα(Z), Φβ(Z) and Φγ(Z) are fluctuating around 0. If Φβ(Z) is lower than 0, it indicates a more perpendicular, and if Φβ(Z) larger than 0, it indicates a more parallel alignment of the normal vector with the membrane surface.
For Φγ(Z) the opposite is true, thus if Φγ(Z) is lower than 0, it indicates that the H-H vector can be found in a more parallel alignment with the membrane surface, and if its larger than 0 it is in a more perpendicular alignment with the membrane surface.
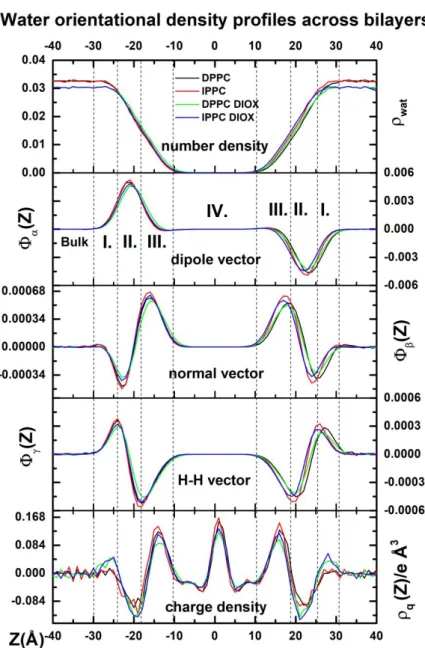
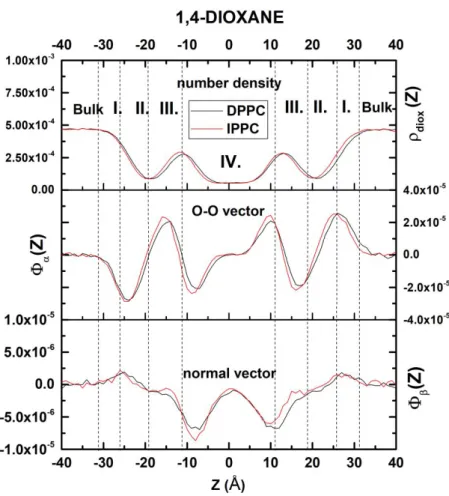
Figure 7 Profiles of number density and orientational functions of water and total charge density profile across the membrane/water interfaces. The Z=0 corresponds to the center of the membrane. The dashed vertical lines indicate the borders between the regions of the interface. The results for clear DPPC and IPPC membranes are shown as black and red solid lines, respectively. The results for the DPPC and IPPC membrane in the presence of 1,4-dioxane are depicted by green and blue solid lines.
The number density, the orientational function of the dipole, normal and H-H vector as well
2 3 4 5 6 7 8 9 10 11 12 13 14 15 16 17 18 19 20 21 22 23 24 25 26 27 28 29 30 31 32 33 34 35 36 37 38 39 40 41 42 43 44 45 46 47 48 49 50 51 52 53 54 55 56 57 58 59 60
as the charge density profile of water molecules are shown in Figure 7. In the bulk phase, all these orientational functions are practically zero which in this case means there is no preferred direction for water molecules. Since the phosphatidylcholine headgroups contain negatively charged phosphate and positively charged tetramethylammonium groups, they determine mainly the orientation of the dipole moments of water molecules as they preferentially turn towards the negatively charged groups.
Dipole, normal and H-H vectors are all sensitive to the presence of charged headgroups, therefore their orientational functions can be used for determining the border of the bulk phase (Figure 7) thus defining the outer border of Region I. Since the orientational function of H-H vector, Φγ(Z), is the most responsive to the structural changes, the borders of the Region II are defined by its stationary points, which coincidence with the inflexion points of the orientational function of the dipole vector Φα(Z). Finally, the border between Region III and IV can be given by the coordinate where Φα(Z) becomes zero again.
In the first interfacial region (noted as Region I), water density started to decrease slowly as seen in the top panel of Figure 7. Φβ(Z) almost reached a minimum here, while Φα(Z) showed quick growth, and Φγ(Z) reached a maximum, which was chosen as a border of this region. These changes manifested as the plane of water molecules are more likely to be found in a perpendicular orientation relative to the bilayer. The increasement of Φα(Z) indicates that the dipole moments of water molecules start to point towards the phosphate groups. For the polluted systems, Region I is more positively charged while the clear system showed no charge accumulation here.
In the second region, Φα(Z) reached a maximum, the orientational function of the normal vector linearly increased while Φγ(Z) decreased as getting closer to the middle of the membrane. This region is negatively charged for each system while this effect is more pronounced for the polluted systems resulting a more polarized outer layer for these membranes. Here, the dipole moment vectors enclose around ~0° with the surface normal, which means that the dipoles are pointing towards the membrane surface.
In the third region, water density vanished slowly and the decrease of Φα(Z), as well as the increase of Φγ(Z) to zero, indicate that water molecules are slowly losing their orientational preference.
Before the vanish of the orientational preference occurring at the inner part of Region III, the presence of the peak of Φβ(Z) indicates that water molecules are taking a more planar alignment due to the presence of the ester groups.
In the central region (Region IV) no preferred orientations for water molecules can be seen based on the orientational profiles most probably due to the low statistical sampling of water molecules.
1,4-dioxane orientational profiles along the membrane normal
2 3 4 5 6 7 8 9 10 11 12 13 14 15 16 17 18 19 20 21 22 23 24 25 26 27 28 29 30 31 32 33 34 35 36 37 38 39 40 41 42 43 44 45 46 47 48 49 50 51 52 53 54 55 56 57 58 59 60