Indoor Navigation for People with Visual Impairment
PhD Thesis
Submitted for the Degree of Doctor of Philosophy in Computer Science
Mostafa Abdallah Abbas Atwa Elgendy
Supervisor:
Cecilia Sik-Lanyi Associate Professor
Department of Electrical Engineering and Information Systems Doctoral School of Information Science and Technology
University of Pannonia Veszpr´em, Hungary
2021
DOI:10.18136/PE.2021.799
I
INDOOR NAVIGATION FOR PEOPLE WITH VISUAL IMPAIRMENT
Thesis for obtaining a PhD degree in the Doctoral School of Information Science and Technology of the University of Pannonia.
in the branch of Information Science Written by: Mostafa Abdallah Abbas Atwa Elgendy
Supervisor (s): Cecilia Sik-Lanyi
Propose acceptance (yes / no) ……….….……..
(supervisor/s)
As reviewer, I propose acceptance of the thesis:
Name of reviewer: ………..……….. ( yes / no)
.………...
Reviewer Name of reviewer: ………..……….. ( yes / no)
.………...
Reviewer The PhD. candidate has achieved …….…. % at the public discussion.
Veszprem/Keszthely, ………
…...
Chairman of the Committee The grade of the PhD diploma ……….…….…. (…….. %)
Veszprem/Keszthely, ………
...
Chairman of the UCDH
I
Acknowledgment
First and foremost, I would like to express my thanks to God for guiding and aiding me to bring this work out to light. My deep thanks and highest gratitude go to my supervisor, Dr. Cecilia Sik- Lanyi for her patience, motivation, enthusiasm, and immense knowledge. I cannot possibly express anymore of my gratitude to her, not only on the guidance she gave during my study as a PhD student but valuable life experiences as well.
I would like to thank the Director of the Doctoral School Prof. Katalin Hangos for her help and support during the doctoral school report presentation. Thanks to the staff of University of Pannonia, especially Ujvari Orsolya, Lenyi Silvia, Dulai Tibor and Gorbe Peter. They assisted me in every possible way and went through all the office works for me to have a good experience in Hungary.
I acknowledge and thank the Dean and Deputy Dean of the Faculty of Information Technology, Prof. Hartung Ferenc, and Dr. Werner Agnes, for the financial support under the project EFOP- 3.6.1-16-2016-00015.
My deep thanks to the Egyptian Ministry of Higher Education and Scientific Research and to the Hungarian Ministry of Higher Education for their cooperation with Egypt to have my study in Hungary.
Last but not the least; I would like to thank my family, my parents, whose love, and guidance are with me in whatever I pursue. They are the ultimate role models. Most importantly, I wish to thank my loving and supportive wife Bosy, and my lovely daughter Salma who provide unending inspiration.
Mostafa Elgendy, 2021
II
Abstract
People with visual impairment face various problems in doing daily activities in comparison to people without visual impairment. Much research has been done to find smart solutions using mobile devices to help them perform tasks like navigation and shopping. One of the most challenging tasks for researchers is to create a solution that offers a good quality of life for people with visual impairment. It is also essential to develop solutions that encourage them to participate in social life. The essential steps of a typical navigation system are identifying the current location, finding the shortest path to the destination, and navigating safely to the destination using navigation feedback. In this thesis, an overview is given about the various technologies that have been developed in recent years to assist people with visual impairment navigating indoors. It introduces the latest direction in this area, which will help developers to incorporate such solutions into their research. A comparison has been made between different technologies used in developing solutions to select the best one from the available solutions. A system has been proposed to help people with visual impairment navigating indoor using markers. The system is able to detect and avoid obstacles during navigation when needed. The navigation system has been improved to detect markers from a longer distance using CNN model. The system has been improved using a deep learning model which is called Tiny-YOLOv3. Several modified versions of the original model have been implemented and compared to improve the detection accuracy.
A dataset has been created by collecting marker images from recorded videos and augmenting them using some techniques such as rotation transformation, brightness, and blur processing.
After training and validating this model, the performance was tested on a testing dataset and real videos.
III
Összefoglaló
A látássérült emberek különböző problémákkal néznek szembe a napi életvitelük során, szemben azon emberekkel, akiknek nincs látássérültségük. Számos kutatás létezik olyan okos megoldásokra, amelyek mobil eszközök segítségével segítenek nekik olyan feladatok végrehajtásában, mint a navigáció és a vásárlás. A kutatók számára az egyik legnagyobb kihívást jelentő feladat olyan megoldás létrehozása, amely jó életminőséget kínál a látássérült emberek számára. Elengedhetetlen olyan megoldások kidolgozása is, amelyek ösztönzik őket a társadalmi életben való részvételre. A tipikus navigációs rendszer lényeges lépései az aktuális hely azonosítása, a célhoz vezető legrövidebb út megtalálása és a navigáció visszajelzései útján történő biztonságos navigálás. Ebben a tézisben áttekintést nyújtok az elmúlt években a látássérült emberek beltéri navigálásának segítésére kidolgozott különféle technológiákról.
Bemutatom a legújabb irányt ezen a kutatási területen, amely segíti a fejlesztőket abban, hogy az ilyen megoldásokat beépítsék kutatásaikba. Összehasonlításra kerülnek a megoldások kidolgozásához használt különféle technológiák, hogy a rendelkezésre álló megoldások közül a legjobbat válasszák ki. Javasolok a látássérült emberek számára egy beltéri markerek segítségével történő navigációs renndszert. Szükség esetén a rendszer képes felismerni és elkerülni az akadályokat a navigáció során. A CNN modell segítségével tovább fejlesztettem a navigációs rendszert, hogy nagyobb távolságból lehessen érzékelni a jelzőket. A rendszert Tiny- YOLOv3 mély tanulási modell segítségével fejlesztettem. Az eredeti modell több módosított változatát implementáltam és összehasonlítottam az észlelési pontosság javítása érdekében. Így egy adatkészlet jött létre a rögzített videókból származó marker képek összegyűjtésével és egyes technikákkal, például rotációs transzformációval, a fényerő és elmosódások feldolgozásával. E modell tanítása és validálása után a teljesítményt tesztelő adatkészleten és valódi videókon teszteltem.
IV
Résumé
Les individus ayant une déficience visuelle sont confrontées à divers difficultés dans leurs activités quotidiennes par rapport aux personnes sans déficience visuelle. De nombreuses recherches ont été menées pour trouver des solutions intelligentes utilisant des appareils mobiles pour les aider à accomplir des tâches telles que les déplacements quotidiens et les achats. L'une des tâches les plus difficiles pour les chercheurs est de créer une solution qui offre une bonne qualité de vie aux personnes malvoyantes. Il est également primordial de développer des solutions qui les encouragent à participer à la vie sociale. Les étapes primordiales d'un système de navigation typique consistent à identifier l'emplacement actuel, à trouver le chemin le plus court vers la destination et à naviguer en toute sécurité jusqu'à la destination à l'aide des commentaires de navigation. Dans cette thèse, un aperçu est donné sur les différentes technologies qui ont été développées ces dernières années pour assister les personnes malvoyantes à naviguer à l'intérieur. Il présente les dernières orientations dans ce domaine, qui soutiendront les développeurs à intégrer de telles solutions dans leurs recherches. Une comparaison a été faite entre les différentes technologies utilisées dans le développement de solutions pour choisir la meilleure parmi les solutions disponibles. Un système a été proposé pour aider les personnes malvoyantes à naviguer à l'intérieur à l'aide de marqueurs. Le système est capable de détecter et d'éviter les obstacles pendant la navigation en cas de besoin. Le système de navigation a été amélioré pour détecter les marqueurs à plus longue distance en utilisant le modèle CNN. Le système a été amélioré à l'aide d'un modèle d'apprentissage en profondeur appelé Tiny-YOLOv3. Plusieurs versions modifiées du modèle original ont été adaptées et comparées pour améliorer la précision de détection. Un ensemble de données a été créé en collectant des images de marqueurs à partir de vidéos enregistrées et en les augmentant à l'aide de techniques telles que la transformation de la rotation, la luminosité et le traitement du flou.
Après avoir formé et validé ce modèle, les performances ont été testées sur un ensemble de données de test et de véritables vidéos.
V
List of abbreviations
ACM Association for Computing Machinery
AGPS Assisted GPS
AI Artificial Intelligence ANN Artificial Neural Networks
AP Access Points
AR Augmented Reality
AT Assistive Technology
CNN Convolutional Neural Networks
CV Computer Vision
DG Deformable Grid
DL Deep Learning
FEU Feature Extraction Unit
FN False Negative
FP False Positive
GPS Global Positioning System
ICF International Classification of Functioning, Disability and Health IEEE Institute of Electrical and Electronics Engineers
IMU Inertial Measurement Unit INS Inertial Navigation System IOU Intersection Over Union
IR Infrared
mAP mean Average Precision MAT Mobile Assistive Technology
ML Machine Learning
MLP Multilayer Perceptron NEI Navigation Efficiency Index NFC Near Field Communication
P Precision
PVI People with Visual Impairment
QR Quick Response
R‐CNN Region‐based CNNs
R Recall
RELU Rectified Linear Unit
RFID Radio Frequency Identification RNN Recurrent Neural Networks
VI SVM Support Vector Machines SSD Single Shot Detector
TN True Negative
TP True Positive
VI Visual impairment
YOLO You Only Look Once
VII
List of figures
Figure 1-1. Population growth all over the world from 1950 to 2050. ... 1
Figure 1-2. People with visual impairment numbers over years. ... 2
Figure 1-3. Research methodology of this thesis... 5
Figure 2-1. ICF architecture. ... 8
Figure 2-2. The human vision system. ... 9
Figure 2-3. The components of the computer vision system. ... 10
Figure 2-4. The computer vision pipeline. ... 11
Figure 2-5. Input image is fed to a feature-extraction algorithm to create the feature vector. ... 11
Figure 2-6. Using ML model to predict the probability of the motorcycle object. ... 12
Figure 2-7. Standard structure of a machine learning pipeline. ... 13
Figure 2-8. Unsupervised learning: clustering... 14
Figure 2-9. Format of a machine learning dataset. ... 14
Figure 2-10. Supervised learning (a) binary classification, (b) regression. ... 15
Figure 2-11. Training, validation, and test data partitions for model selection. ... 15
Figure 2-12. Cross validation to approach the model selection problem. ... 16
Figure 2-13. The difference between DL and ML ... 16
Figure 2-14. Artificial neurons were inspired by biological neurons. ... 17
Figure 2-15. Structure of a perceptron. ... 17
Figure 2-16. Multi-Layer Perceptron. ... 18
Figure 2-17 (Left) Fully connected neural network, (Right) Locally connected network. ... 19
Figure 2-18. CNN image classification pipeline. ... 20
Figure 2-19. Average versus max pooling. ... 21
Figure 3-1. The flowchart of choosing methodology based on PRISMA flowchart. ... 23
Figure 3-2. Mobile Assistive Technology ... 24
Figure 3-3. The scenario of the shopping solutions for PVI. ... 24
Figure 3-4. Smart homes solutions for PVI. ... 25
Figure 3-5. A navigation scenario for PVI. ... 26
Figure 3-6. MAT solutions for the parts of the shopping process for PVI. ... 30
Figure 3-7. Examples of square markers. ... 35
Figure 4-1. Main components of the comparison application. ... 45
Figure 4-2. Components of the proposed system. ... 46
Figure 4-3. The plan of the fourth floor’s corridor. ... 47
Figure 4-4. A graph of the fourth floor’s corridor at the same faculty. ... 47
Figure 4-5. System architecture that PVI should follow to reach the destination point. ... 48
Figure 4-6. The shortest path to destination example. ... 49
VIII
Figure 4-7. Screenshots of the prototype. ... 51
Figure 4-8. Screenshots of the prototype: (a) a blindfolded person; (b) PVI. ... 52
Figure 4-9. Screenshots of the testing environment. ... 54
Figure 4-10. Mean navigation efficiency index (NEI) versus paths (S). ... 54
Figure 4-11. Flowchart of the detection process. ... 55
Figure 4-12. The architecture of YOLOv3 model. ... 56
Figure 4-13. The architecture of Tiny-YOLOv3 model. ... 57
Figure 4-14. Results after object detection and recognition. ... 59
Figure 5-1. Main components of the application using CNN. ... 61
Figure 5-2. The process of detecting markers. ... 62
Figure 5-3. Flowchart of detecting markers and giving feedback to PVI... 62
Figure 5-4. A few samples of makers with illumination change and motion blur. ... 63
Figure 5-5. The basic layers of CNN ... 64
Figure 5-6. The convolution of a filter over a 2D image ... 64
Figure 5-7. The flattening operation. ... 65
Figure 5-8. The proposed CNN architecture used in training of markers. ... 66
Figure 5-9. The proposed simplified CNN architecture. ... 67
Figure 5-10. Comparative accuracy graphs after applying the model on two datasets. ... 68
Figure 5-11. Comparative loss graphs after applying the model on two datasets. ... 69
Figure 5-12. Comparative accuracy graphs for the three models. ... 70
Figure 5-13. Comparative loss graphs for the three models. ... 71
Figure 6-1. The architecture of the first modified version of Tiny-YOLOv3. ... 75
Figure 6-2. The second modified version of the original Tiny-YOLOv3. ... 76
Figure 6-3. The network structure of the modified version 3. ... 77
Figure 6-4. Marker images obtained under challenging conditions. ... 78
Figure 6-5. Training loss and validation loss versus epoch for the four models. ... 80
Figure 6-6. Graphs for (a) precision, (b) recall and (c) F1 score in normal conditions. ... 81
Figure 6-7. Graphs for (a) precision, (b) recall and (c) F1 score in challenging situation. ... 83
Figure 6-8. Comparative graphs for different Tiny-YOLOv3 versions using mAP. ... 84
Figure 6-9. Box diagram representing the distribution of execution time of the four models. .. 85
Figure 6-10. Screenshots of detected markers from different distances. ... 86
IX
List of tables
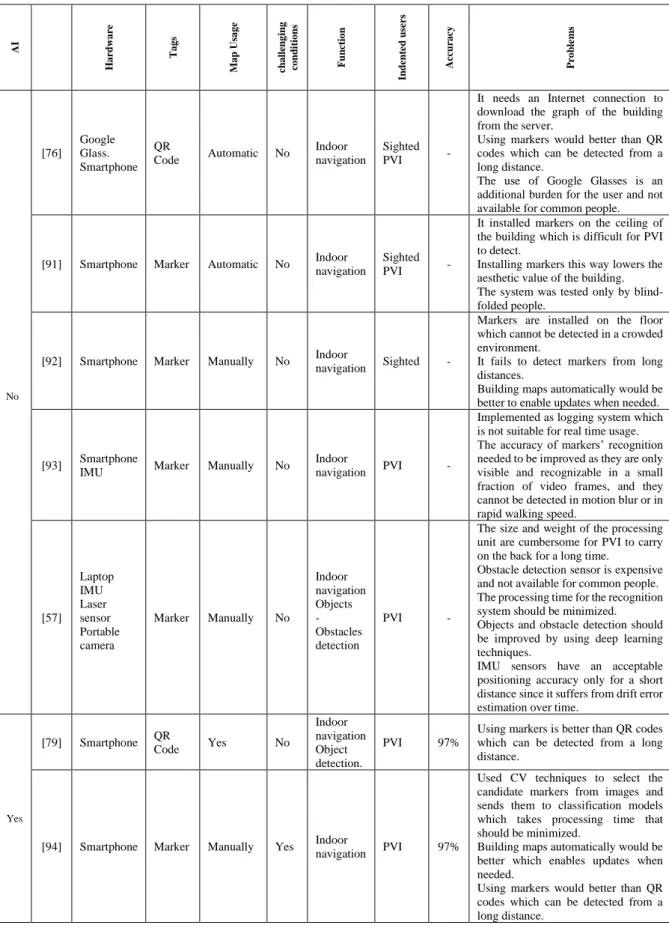
Table 3-1. Analysis of the related work. ... 37
Table 3-2. A comparison of our system with the others in the related work. ... 41
Table 4-1 Comparison of identification technologies for PVI. ... 44
Table 4-2. Evolution of Aruco markers and QR codes in different conditions. ... 45
Table 4-3. List of the input commands and the navigation feedbacks given by the prototype. . 50
Table 4-4. Samples from indoor objects collected from dataset. ... 55
Table 4-5. The initialization params of the YOLOv3 and Tiny-YOLOv3 models. ... 58
Table 4-6. Performance analysis of the YOLOv3 and Tiny-YOLOv3 models. ... 58
Table 4-7. The average detection time of the two models in milliseconds. ... 58
Table 6-1. Precision (P), recall (R) and F1 score at IOU = 0.5 of different models. ... 83
Table 6-2. P-value for different t-tests of different modified versions and the original one. ... 85
Table 6-3. P-value for different t-tests of different modified versions. ... 86
X
Table of contents
ACKNOWLEDGMENT ... I ABSTRACT ... II ÖSSZEFOGLALÓ ... III RÉSUMÉ ...IV LIST OF ABBREVIATIONS ... V LIST OF FIGURES ... VII LIST OF TABLES ...IX TABLE OF CONTENTS ... X
1 INTRODUCTION ... 1
1.1 Motivation and Scope ... 1
1.2 Objectives ... 3
1.3 Research Methodology ... 4
1.4 Contributions and Publications ... 5
1.5 Thesis Organization ... 5
2 BACKGROUND ... 7
2.1 Assistive Technology ... 7
2.2 Computer Vision ... 9
2.2.1 Computer vision pipeline ... 10
2.3 Machine Learning ... 12
2.3.1 Data Pre-processing ... 13
2.3.2 Learning Algorithms ... 13
2.3.3 Model Selection and Assessment ... 15
2.4 Deep Learning ... 16
2.5 Execution Environments... 21
2.6 Summary ... 22
3 LITERATURE REVIEW ... 23
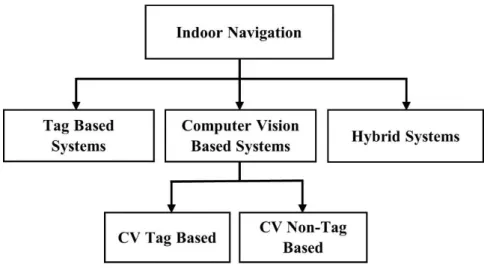
3.1 Taxonomy ... 23
3.2 Outdoor Navigation ... 26
3.3 Obstacle Detection ... 27
3.4 Indoor Navigation ... 29
3.4.1 Tag Based Systems ... 30
3.4.2 Computer Vision Based Systems ... 32
3.4.3 Hybrid Systems... 36
3.5 Conclusions ... 42
4 NAVIGATION SYSTEM FOR PVI ... 43
4.1 Comparing different Technologies ... 43
4.1.1 Comparing QR code with Aruco markers ... 44
4.2 Navigation System Architecture ... 46
4.2.1 Building a Map ... 46
4.2.2 Navigation ... 48
4.2.3 Test cases ... 52
4.3 Objects Detection System Architecture ... 54
4.3.1 Dataset ... 55
4.3.2 Deep Learning Model ... 55
4.3.3 Experiments ... 57
4.4 Conclusions ... 59
5 DETECTING MARKERS FROM LONGER DISTANCES ... 61
5.1 System Architecture ... 61
XI
5.1.1 Dataset ... 63
5.1.2 Proposed CNN Model ... 63
5.1.3 Simplified CNN Model ... 66
5.2 Evaluation ... 67
5.3 Conclusions ... 72
6 DETECTING MARKERS IN CHALLENGING CONDITIONS USING YOLOV3 73 6.1 Detecting markers using deep learning models ... 73
6.1.1 Original Tiny-YOLOv3 model ... 73
6.1.2 Modified Tiny-YOLOv3 models ... 74
6.2 Experiments ... 78
6.2.1 Dataset ... 78
6.2.2 Evaluating Models ... 79
6.3 Conclusion ... 88
7 CONCLUSION ... 89
7.1 New Scientific Results... 90
7.1.1 Thesis I: Build an indoor navigation system to help PVI navigate and avoid objects during navigation using deep learning. ... 90
7.1.2 Thesis II: Identify Markers from longer distances using CNN model... 91
7.1.3 Thesis III: Build a novel marker detection system for PVI using the improved Tiny-YOLOv3 model. ... 91
7.2 Future plans ... 92
7.3 Publications ... 92
7.3.1 Publications related to this Thesis. ... 92
7.3.2 Publications not related to this Thesis ... 93 BIBLIOGRAPHY ... I
1
1 Introduction
People with Visual Impairment (PVI) have weaknesses in the function of their visual system.
The environment lack of support causes them to depend on their relatives and prevent them from seeing and doing daily activities, such as navigation or shopping. This chapter contains the motivation and challenges behind this thesis. It highlights the challenges they face during navigating indoors and how to solve them using indoor navigation system. Then, the contributions of this thesis and the research methodology to accomplish them are introduced.
Finally, the research activities and the outline of this work are presented.
1.1 Motivation and Scope
Visual Impairment (VI) is one of the world’s most important health problems which reduces seeing or perceiving ability. VI results from various diseases and degenerative conditions which are hard for correction through wearing glasses or using conventional means. VI has been classified into near or distance vision impairment and results from many reasons, such as uncorrected refractive errors, age-related eye problems, glaucoma, cataracts, diabetic retinopathy, trachoma, corneal opacity, or unaddressed presbyopia [1]. The current global population is 7.6 billion. It is expected to be 9.2 billion in 2050 as shown in Figure 1-1.
Figure 1-1. Population growth all over the world from 1950 to 2050.
Based on the World Health Organization (WHO) report, more than 200 million people worldwide are visually impaired. As shown in Figure 1-2, this number will increase in the following years.
Among them, 39 million were blind, and 246 million had low vision [2] [3]. About 81% of the people who are blind or have moderate vision impairment are aged about 50 years and above. VI is one of the most sensory disabilities, which causes a deprivation of entire multi-sense perception
2
for an individual. About 80% of people who suffer from VI or blindness belong to middle- and low-income countries, where they cannot afford costly assistive devices.
Figure 1-2. People with visual impairment numbers over years.
Modern buildings, such as airports, hospitals, and shopping malls become complex. The complex structural layout of these buildings makes it difficult to navigate easily. Not only for PVI but, also for people with normal vision who get lost easily. So, people with normal vision use landmarks and geographical layouts to find their way and navigate easily. However, PVI have limitations in their visual system so, it difficult to navigate in these places. The lack of support services in the surrounding environment makes them overly dependent on their families and prevents them from seeing and doing daily activities, such as navigation or shopping. For example, PVI have difficulties in reading product labels during shopping; they thus miss important information about the content of their food and sometimes make bad choices. During shopping, PVI face navigation troubles, which encourage them to consume takeout food. Another problem is how to walk in an environment with many barriers such as walking in unknown places or crossing a street. Last, but not least, PVI face social barriers such as the attitudes of other people and society [4][5]. Therefore, providing them with an advanced and helpful navigational tool will be necessary for the following three perspectives: First, it will reduce some of the sufferings they face, improve their mobility, and protect them from injury. Second, it will help them to live without any help from others. Third, it will encourage them to travel outside of their environments and interact socially, benefiting society by fully utilizing the talents and abilities [6].
Lately, portable devices such as smartphones, smart glasses, smartwatches, and notebooks, have become popular. These devices have various capabilities that are useful when developing new complex applications [7]. These devices can access information from any place and, at any time.
So, PVI can use them in their daily activities. In this way, mobile devices are used with Assistive Technology (AT) to offer multiple solutions which are called Mobile Assistive Technology (MAT) [8]. As a result, researchers have developed several methods using Wi-Fi, Radio Frequency Identification (RFID), and Near Field Communication (NFC). These systems are useful however, they are unsuitable for daily use as they are complex to use. Furthermore, the
3
size or weight of these systems are hard to wear for a long time. Besides, several systems require preinstalling infrastructure, which is expensive and hard to implement in particular locations with strict requirements such as, hospital [9]. Because of these limitations, it is desirable to build an indoor navigation system with low cost and minimum preinstalled infrastructure requirement.
So, this research has concentrated on Computer Vision (CV) solutions using the smartphone camera.
A typical CV navigation system for indoor navigation uses unique installed tags such as Augmented Reality (AR) markers to help in navigating indoors and recognizing objects. It consists of tags installed in place, a database to store tag information, a camera to capture real- time pictures, a processing unit to execute the used techniques, and feedback to help PVI with navigation commands. The system works as follows: A database is used to store the building map, which consists of interest points and the connection between them. When the application starts, it opens the camera to get a live stream of images and converts them to grayscale ones.
Then, it sends the converted images to the processing unit to detect and identify the marker based on the used techniques. If any marker is detected, the system calculates the distance to that marker and gives a voice feedback to help PVI in reaching it. This detected marker is used as an initial point, and the destination point is given as an input using voice commands. The shortest path is calculated between these two points, and PVI start navigating to reach their destination. Detecting and identifying markers are the most crucial parts. However, the system may fail to identify markers in many real-life situations such as motion blur or distortion, lighting conditions, or the marker is too far from the camera. In recent years, Deep Learning (DL) have been used in the field of CV to improve object detection. The deep convolutional neural network increases the network level, which makes the network have stronger detection capabilities. Currently, there are several deep Convolutional Neural Networks (CNN)s however, some of them are not suitable for applications executing in real‐time due to the expensive running process. The purpose of my thesis is to develop such a system for PVI. To Summarize, multiple research questions derive from the motivations presented above:
1. Q1: What are the main categories of MAT solutions for PVI, and What are the strengths and weaknesses of the latest MAT systems for PVI?
2. Q2: How to select the best technology for the navigation system, and how to build a navigation system to help PVI navigating indoors? How to help PVI to identify objects and avoid them easily during navigation?
3. Q3: How to improve the navigation system to detect markers from longer distances using DL techniques?
4. Q4: How to improve the navigation system to detect markers easily in challenging conditions using DL techniques?
1.2 Objectives
As it was stated above, the overall aim of this thesis is to build a navigation system to help PVI navigate indoors. It also discusses how the proposed solutions can help PVI in the navigation process and summarizes the challenges and drawbacks of the proposed solutions. To achieve this purpose, the following progressive objectives are defined:
4
•
Objective 1: To understand, organize and systematize the existing knowledge about DL and MAT. To find the strengths and weaknesses of the latest MAT systems for PVI, and how to develop an indoor navigation system for PVI. This objective corresponds to the first research question.•
Objective 2: To compare different technologies and select the best one from these available solutions. Build a system to help PVI navigating indoors using the selected technology. Improve the navigation system to avoid objects during navigation. This objective corresponds to the second research question.•
Objective 3: To improve the navigation system to detect markers from a longer distance using CNN model. This objective corresponds to the third research question.•
Objective 4: To improve the navigation system to detect markers from challenging conditions using YOLOv3 CNN model. This objective corresponds to the fourth research question.1.3 Research Methodology
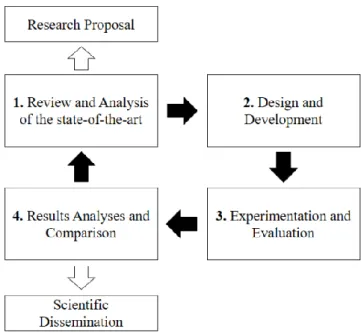
The research field of this thesis is evolving fast due to technological advances and the continuous generation of new knowledge in MAT and DL. Therefore, an iterative research methodology that allows us to review the state-of-the-art regularly was followed. The main idea of this cyclical process is that the knowledge acquired in its initial phases helps us to design increasingly original contributions capable of improving the understanding and knowledge in the areas wherein this thesis is focused. This cyclical process has multiple iterations done during the three years of this Ph.D. thesis. Figure 1-3 shows the different phases of this research methodology as briefly described:
1. Review and Analysis of the state-of-the-art: this stage is focused on investigating the state-of-the-art related to the field MAT under consideration to identify gaps and challenges in current literature. To achieve this aim, the relevant bibliography is used, reviewing both publications from the scientific community published in journals and proceedings of worldwide conferences. The knowledge acquired in this phase led to formulate the research proposal in the first year of this Ph.D.
2. Design and Development: in this phase, different proposals to approach the identified challenges are designed and developed. To this end, previously acquired or updated knowledge (new literature review) was used to ensure that the solution was always up to date with the current state-of-the-art.
3. Experimentation and Evaluation: the goal of this phase is to test the proposals resulting from the previous step to a process of experimentation. To carry out this procedure, it is crucial to provide some criteria and evaluation methods with which the results will be compared in the subsequent phase. All these criteria and methods must be built using the knowledge acquired in the first stage of the methodology.
4. Results Analyses and Comparison: after carrying out experimentation, results must be analysed and contrasted with those obtained in the state-of-the-art. At this point, it is needed to check if the results obtained are enough to address the challenges identified in the first phase. In such a case, another methodological cycle begins to approach the following challenge identified or to keep working with the challenge under consideration
5
if it was not still solved. In this stage, conclusions must be drawn from analyses of results, and knowledge obtained must be materialized in scientific dissemination, either through journals or conferences.
Figure 1-3. Research methodology of this thesis.
1.4 Contributions and Publications
The work presented in this dissertation focuses on building a navigation system for PVI. The main contributions of this thesis and their associated scientific production are presented below:
• A taxonomy that provides a view of the different MAT solutions that helps PVI in different problems. This contribution is approached in Chapter 3.
• Comparing different technologies and select Aruco markers as the best ones from the available solutions. Build a navigation system to help PVI navigating indoors using Aruco markers. Improve the navigation system to avoid objects during navigation. This contribution is approached in Chapter 4.
• Improve the navigation system to detect markers from longer distances using CNN model.
This contribution is approached in Chapter 5.
• Improve the navigation system to detect markers from challenging conditions using YOLOv3 CNN model. This contribution is approached in Chapter 6.
1.5 Thesis Organization
The structure of the remainder of this thesis dissertation is outlined below.
• Chapter 2 shows background about MAT and DL.
6
• Chapter 3 reviews related work about using DL and MAT to build navigation systems for PVI. This chapter is therefore aligned with Specific Objective 1.
• Chapter 4 presents the comparison criteria between different technologies, and which one is the best for the proposed system. It shows the architecture of the navigation system. Introduces the problem of avoiding objects and how to solve it using DL This chapter is therefore aligned with Specific Objective 2
• Chapter 5 provides a thorough analysis of the drawbacks of the proposed navigation system and how to solve the problem of detecting markers from a longer distance. The work presented in this Chapter is therefore directly related to Specific Objective 3.
• Chapters 6 introduces You Only Look Once (YOLO) models and how to use them to detect markers in challenging conditions. This solves some of the drawbacks of the methods identified in Chapter 4. This Chapter is aligned with Specific Objective 4.
• Chapters 7. revisits the main goal and specific objectives posed in this Ph.D. thesis and summarizes the main contributions of this research.
7
2 Background
There are a lot of technologies and research done in helping PVI. This thesis focuses on using AT and DL to help PVI navigating indoors. This chapter presents a brief background and theory of some of the concepts used throughout this thesis such as AT, CV, Machine Learning (ML), and DL. First, AT is introduced, the necessity for using it for building efficient systems.
Afterward, the basis of CV and the main task which can be done by it are detailed. Next, what interpretability means within the ML field and why it is necessary are explained. Finally, a brief description of DL is provided.
2.1 Assistive Technology
Impairment is defined as any loss or abnormality in an anatomical structure or a physiological or psychological function. Disability is any restriction or lack of ability to perform an activity in the manner or within the range considered normal for a human being [10]. This way, VI is defined as the limitation of actions and functions of the visual system. These lacks lead to loss of visual acuity or visual field, photophobia, diplopia, visual distortion of images, visual perceptual difficulties, or any combination of the above features. Vision function has four categories: normal vision, moderate VI, severe VI and blindness. So, the last three can be combined and called VI.
Vision loss is the sensor disability causes a deprivation of entire multi-sense perception for an individual. Currently, more than 285 million PVI worldwide and this number will increase in the coming decades. PVI face a lot of difficulties during their daily activities. The lack of services support in the environment makes them always need help from their relatives. It also prevents them from being economically active and socially included [11].
International Classification of Functioning, Disability and Health (ICF) provides a framework for organizing and documenting functioning and disability. Using this model provides a common language for discussing the type of disability and how to overcome it by interaction with people and the environment around them. ICF describes situations regarding human functioning and its restrictions and serves as a framework to organize this information. It structures the information in a meaningful, interrelated and easily accessible way. The ICF offers a multidimensional aspect to describe health and disability as a dynamic interaction between a person’s health condition, environmental factors and personal factors [12]. ICF organizes information in two parts, as shown in Figure 2-1. The first part deals with functioning and disability, while the second part covers contextual factors. The first part is divided into body, activity, and participation components, while the second part is divided into environmental factors and personal factors.
The body component has two classifications, one is related to the functions of the body systems, while the other is for the body structures. Activity component is the execution of a task or action by an individual. Finally, the participation component is related to incorporate people with a disability in a life situation. Environmental factors are the second part which has an impact on all functioning and disability components. They are organized in sequence from the individual’s most immediate environment to the general environment, while personal factors are also components of contextual factors [13].
To apply ICF framework for PVI, each component in this framework should be applied on them.
Let’s talk first about body functions and structure: PVI have limitation of actions and functions of the visual system which prevent them from seeing and communicating with environment in a
8
normal way. Moreover, they have some activity limitations and participation restrictions which lead to problems with overweight and isolation from the world around them. For example, PVI face a lot of difficulties in reading product labels, as a result they fail to obtain information about the nutritional content of food. This makes it difficult to choose a good food. Furthermore, the independent navigation difficulty in a grocery may limit the frequency of shopping, making it less viable to buy healthier food and encourage them to consume more prepared food. This way, they always need help while shopping which might make them feel uncomfortable. Activity limitations in walking, environmental barriers, and the lack of accessible exercise equipment can hamper a person’s ability to be physically active. To talk about environmental factors, PVI may experience environmental barriers as attitudes of individuals and the society communication services, systems, and policies. PVI face some challenges which put them in a dangerous situation, so they always need help from other people. As a result, they create and live in their own world and feel that they are isolated from the world around them [14].
Figure 2-1. ICF architecture.
AT helps PVI to support body functions and prevent any activity limitations or participation restrictions. So, they enhance their quality of life and allow them to be included in society and act as typically developed people. There are various definitions of AT. Common in all of them is that "Assistive technology consists of devices and other solutions that assist people with deficits in physical, mental, or emotional functioning as alternative ways of performing actions, tasks, and activities". Appropriately, a growing number of PVI are using smartphones in their daily activities. The advent of mobile phones, in particular smartphones, has piloted a new era of connectivity where users can access information any time and, in any place. This way, smartphones are used with assistive technology to provide several solutions, which is called MAT. MAT helps PVI do a lot of tasks like navigation, shopping and controlling everything at home. It has the potential to enhance the quality of life for PVI via improved autonomy and safety. Furthermore, it encourages and pushes them to travel outside their environment and to interact socially [15].
9
2.2 Computer Vision
The core concept of any Artificial Intelligence (AI) system is to perceive the environment and act based on these perceptions. CV is a subfield of AI concerned with the visual perception part.
It is the science of perceiving and understanding the world through images and videos. It constructs a physical world model to take appropriate action. For humans, vision is just one aspect of perception, and there are other perceptions like sound, smell, and other senses.
Depending on the application you are building, select the sensing device that best captures the world. So, Visual perception is the act of observing patterns and objects through visual or visual input. For autonomous vehicles as an example, visual perception means understanding the surrounding objects such as pedestrians or traffic signs and understanding what they mean. So, CV is the way of building systems that can understand the environment through visual input. At the highest level, vision systems are almost the same for humans, animals, and most living organisms. They consist of a sensor that captures an image and a brain that processes and interprets an image. Then, it outputs a prediction based on the data extracted from the input image, as shown in Figure 2-2.
Figure 2-2. The human vision system.
Researchers have done interesting jobs in imitating visual ability with machines. To do it, there is a need to have the same two main components. The first one is a sensing device to mimic the function of human eyes. The second component is an algorithm to mimic the brain function in interpreting and classifying image content, as shown in Figure 2.3. An important design aspect is selecting the best sensing device to capture the surrounding environment, such as a camera, X- ray, or CT scan. These devices provide the environment's full scene to fulfill the task. For example, the main goal of CV in an autonomous vehicle is to understand the surrounding environment and move safely on time. So, they added a combination of cameras and sensors that can detect pedestrians, cyclists, vehicles, roadwork, and other objects. CV systems consist of a sensor and an interpreter. For sensors, cameras are most often considered the equivalent of the eyes for a computer vision system. There are other sensors, such as distance sensors, laser scanners, and radars. However, different combinations of these sensors are selected depending on the application. The interpreter, such as CV algorithms is the brain of the vision system. It takes the output image from the sensing device and learns features and patterns to identify objects. So, it is important to build an artificial brain [16][17].
10
Figure 2-3. The components of the computer vision system.
CV is used for a set of tasks to achieve highly sophisticated applications:
• Image classification: to determine the category of a given image based on a set of predefined categories. Let’s take a simple binary example: if you want to categorize the input images according to whether they contain a cat or a dog [18].
• Localization: is used to find the exact location of a single object in an image. For example, if you want to know the place of the dog in the input image. The standard way to perform localization is to define a bounding box enclosing the object in the input image [19].
• Object detection: to find and then classify several objects in an image. It is a combination of localization and classification repeated for all objects in the input image. An application of object detection is detecting people or obstacles [20].
• Object identification: is different from object detection, although similar techniques are used to achieve them both. Given an input image, object identification is used to find whether a specific object appears or not. If the object is found, it specifies the exact location of it. An example may be searching for images that contain the logo of a specific company [21].
• Instance segmentation: is the next step after object detection. It creates a mask for each detected object that is as accurate as possible [22].
• Object tracking: is to track the moving object over time by utilizing consecutive video frames as the input. It is useful in human tracking systems that try to understand customers behavior. Object tracking is done by applying object detection to each image in a video sequence. Then, it compares the instances of each object to determine how they moved [23].
2.2.1 Computer vision pipeline
A typical vision system uses a sequence of distinct steps to process and analyse image data which are referred to as a computer vision pipeline. Many vision applications follow the flow of acquiring images and data, processing that data, performing some analysis and recognition steps, and then finally making a prediction based on the extracted information, as shown in Figure 2-4.
To apply the pipeline to an image classifier example. Suppose there is an image of a motorcycle, and there is a model to predict the probability of the object from the following classes:
motorcycle, car, and dog. Let us see how the image flows through the classification pipeline:
1. Image input: A computer receives visual input from an imaging device like a camera. This input is captured as an image or a sequence of images forming a video. CV applications deal with images or video data. An image is represented as a function of two variables x and y,
11
which define a two-dimensional area. The pixel is the raw building block of an image. Every image consists of a set of pixels with values representing the intensity of light in a given place in the image. To represent a specific pixel, F is the function and x, y is the location of the pixel in x- and y-coordinates. For example, the pixel located at x = 12, and y = 13 is white; this is represented by the following function: F (12, 13) = 255.
Figure 2-4. The computer vision pipeline.
2. Image pre-processing: The acquired data is usually messy and comes from different sources. To feed it to the ML model, it needs to be standardized and cleaned up. Based on the problem and the dataset, some image processing is required before feeding them to the ML model. Each image is sent through some pre-processing steps whose purpose is to standardize the images. Common pre-processing steps include resizing an image, blurring, rotating, changing its shape, or transforming the input image from one colour to another, such as from colour to grayscale.
3. Feature extraction: Features help us define objects. A feature is a measurable piece of data in your image that is unique to that specific object. It may be a distinct colour or a shape such as a line, edge, or image segment. A strong feature can distinguish objects from one another.
For example, the wheel is a strong feature that clearly distinguishes between motorcycles and dogs. However, it is not strong enough to distinguish between a bicycle or a motorcycle.
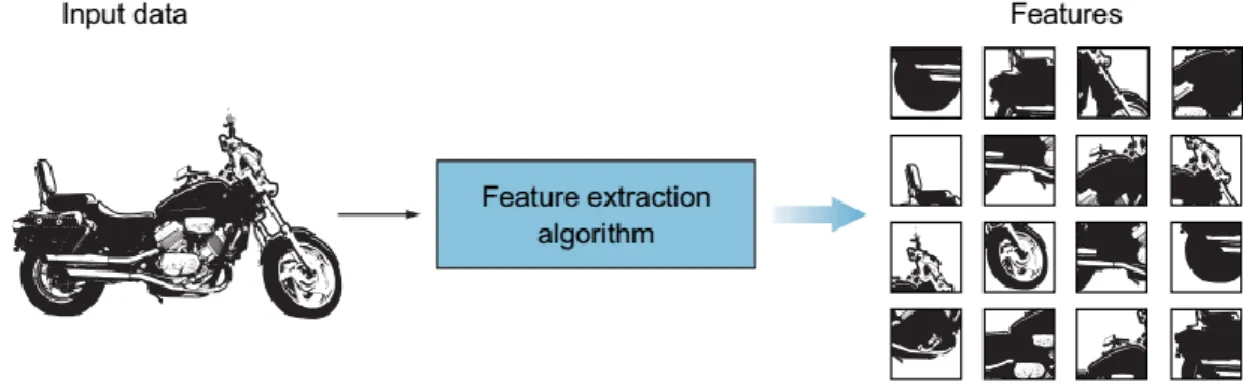
In CV projects, the image is transformed into a feature vector and is used by the learning algorithm to learn the characteristics of the object. As shown in Figure 2-5, the raw input image of a motorcycle is feed into a feature extraction algorithm which produces a vector that contains a list of features. This feature vector is a 1D array that makes a robust representation of the object. The output of this process is a feature vector to identify the object.
Figure 2-5. Input image is fed to a feature-extraction algorithm to create the feature vector.
12
4. Learning algorithm: The features are fed into a classification model. This step looks at the feature vector from the previous step and predicts the class of the image. The classification task is done using traditional ML algorithms like SVMs, or deep neural network algorithms like CNNs. While traditional ML algorithms might get decent results for some problems, CNNs truly shine in processing and classifying images in the most complex problems. To do it, you look at the list of features in the feature vector one by one and try to determine what is in the image: a- First you see a wheel feature; could this be a car, a motorcycle, or a dog?
It is not a dog, because dogs do not have wheels (at least, normal dogs, not robots). Then this could be an image of a car or a motorcycle. b- You move on to the next feature, the headlights.
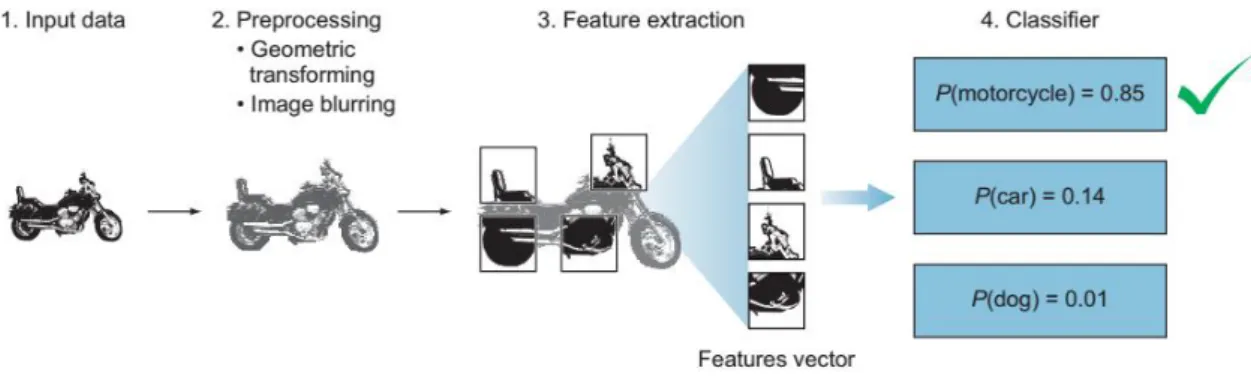
There is a higher probability that this is a motorcycle than a car. c- The next feature is rear mudguards—again, there is a higher probability that it is a motorcycle. d- The object has only two wheels; this is closer to a motorcycle. e- the model keeps going through all the features, like the body shape and pedal until the best guess of the object in the image. The output of this process is the probability of each class. As shown in Figure 2-6, the model can predict the right class with the highest probability. However, there is still a little confusion about distinguishing between cars and motorcycles. To improve accuracy, more training images can be added, more processing to remove noise, extract better features, change the classifier algorithm, or allow more training time.
Figure 2-6. Using ML model to predict the probability of the motorcycle object.
2.3 Machine Learning
ML is the field focusing on algorithms which have the ability of modifying and adapting their behaviour employing an iterative learning process without the need of being explicitly programmed. Applications like e-mail spam and malware filtering, face recognition are built upon ML. Within the ML field, detection techniques can be classified into supervised and unsupervised learning. Techniques regarding these categories differ in the type of data they use, which may be labelled or not. The fact that the data is labelled means that each observation of the dataset has an associated label that identifies it as normal or anomalous. In contrast, if no label is available, it is not possible to know the nature of a given observation. Also, all these applications do not include only ML algorithms but also data pre-processing techniques, as it has proven key to gleaning quality data before applying ML methods [24]. The connection between data pre-processing techniques and an ML algorithm generates a pipeline whose main structure is presented in Figure 2-7.
13
Figure 2-7. Standard structure of a machine learning pipeline.
2.3.1 Data Pre-processing
Input data must be provided in the format that suits ML algorithms. Unfortunately, real-world databases are highly influenced by the presence of noise, missing values, inconsistent data, among others. Therefore, low-quality input data can considerably affect the performance of ML methods. In this section, a general overview of data pre-processing techniques is described that improve the quality of data before fed it into ML algorithms [25]. Data preparation is usually a mandatory step in supervised learning problems. It converts prior raw and, sometimes useless, data into new data that fits the input of ML methods. If data is not prepared correctly, ML methods will not operate and will report errors during their runtimes or will generate results that do not make sense within the context wherein the data comes. Below representative approaches within the data preparation are presented.
•
Data Cleaning: This approach includes operations related to inconsistent data corrections and reduction of redundant data. The primary purpose is the detection of discrepancies and dirty data, which means identifying fragments of the original data that do not make sense in the context under study [26].•
Data Transformation and Data Integration: In the data transformation process, data is converted to enable that the supervised learning process can be more efficient. Examples of possible paths to follow are feature generation, feature aggregation or data normalization, among others. For the vase of data integration, this pre-processing approach involves the merging of data that comes from multiple data sources. This process requires caution to avoid redundancies and inconsistencies in the resulting dataset [27].•
Data Normalization: Input data can have multiple variables with different measurement scales. Such diversity of measurement units can affect the data analysis. Therefore, all the variables should be expressed in the same measurement units and should use a standard scale or range. This process gives all variables equal or similar weight and is particularly useful in statistical learning methods [28].•
Missing Data Imputation and Noise Identification: Here the objective is to fill in the variables of the input data that contain missing values following a particular strategy. In most cases, adding an estimation of the missing data is quite better than leaving blank.Complementary to this approach includes smoothing processes whose purpose is to detect random errors or variances in the input data [29].
2.3.2 Learning Algorithms
Once data pre-processing is completed, the next step is selecting an ML algorithm to extract knowledge previously unseen in input data. ML algorithms can be subdivided into multiple areas, among which the best known are supervised learning and unsupervised learning. Unsupervised learning looks for patterns in data with no pre-existing labels. The approach of unsupervised
14
learning usually focuses on clustering groups of data points. Given a set of data points, clustering organizes X data points into specific groups such as is shown in Figure 2-8. Data points that are in the same group should have similar properties, while data points in different groups should have highly different features. It is important to note that these potential groups are not previously defined in the input data and is the purpose of unsupervised learning algorithms to discover them.
Representative applications of unsupervised learning are marketing segmentation and anomaly detection [30].
Figure 2-8. Unsupervised learning: clustering.
Supervised learning typically uses labelled data, that is, during the training process of a model, the target values are clearly defined in Y. It basically consists of algorithms that learn a function ( f : X → Y ) by training with a finite number of input-output pairs, being X the input domain and Y the output codomain. Supervised learning problems can be processed by learning from a training dataset composed of instances that take the form (x, y). In this format, x € X is a vector of values in the space of input variables (features) and y € Y is a value in the target variable such as shown in Figure 2-9. Once trained, the obtained model can be used to predict the target variable on unseen instances [30].
Figure 2-9. Format of a machine learning dataset.
Supervised learning problems can be usually divided into two categories: classification and regression. In both cases, the basis is an input dataset X, and their difference is the type of target variable, Y, to be predicted. On the classification case, Y is divided into discrete categories, while in regression, the purpose is predicting continuous values. Standard classification problems can be either binary or multi-class problems. In the former case, an instance can only be associated with one of two values: positive or negative that is equivalent to 0 or 1, such as seen in Figure 2- 10 (a). Examples of this binary classification are email messages that can be categorized into spam or non-spam. Regarding multi-class problems, they involve cases wherein there are more
15
than two classes under consideration. That is, any given instance will belong to one of the multiple possible categories. For example, a flower image can be categorized within a wide range of plant species. Diversely, a regression problem consists of finding a function which can predict, for a given example, a real value among a continuous range. The latter is usually an interval in the set of real numbers R. For example, the price of a house may be calculated using multiple characteristics such as the number of bedrooms as observed in Figure 2-10 (b) [31].
(a) (b)
Figure 2-10. Supervised learning (a) binary classification, (b)regression.
2.3.3 Model Selection and Assessment
Model selection is the task of selecting a statistical model from a set of candidate models given input data. In ML, model selection is the process of choosing one final ML model from a set of candidate models. This task implies estimating the performance of the different models to choose the best one to address the problem at hand. The best approach to model selection requires enough data that sometimes could not be the case due to the complexity of the problem under study. In a data-rich situation, the best way to proceed is to split the input dataset into three parts randomly:
a training set, a validation set, and a test set is introduced in Figure 2-11. The training set is used to fit the set of available models; the validation set is then used to estimate prediction error for model selection; and finally, the test set is used to assess the generalization error of the final chosen model. Then the best model is selected based on the validation error, and the test set should be brought out only at the end of the process when the best model has been selected. A typical data split maybe 50 % training, and 25% validation and 25% test. However, the approach mentioned above could be impractical on ML supervised problems wherein there are no sufficient data. In these cases, the most common approach is using re-sampling strategies to carry out the model selection using Cross-validation [32].
Figure 2-11. Training, validation, and test data partitions for model selection.
Cross-validation is the re-sampling strategy most used in situations where there are not enough data. In this approach presented in Figure 2-12, the training set is split into k smaller subsets and the next steps are followed for each of the k folds: an ML method is trained using k-1 of the folds
16
as training data. The resulting trained model is validated on the remaining part of the data. The final performance metric is the average of the metric reported by every k fold. This approach can be computationally expensive, but it does not waste too much data, which is a significant advantage in some supervised learning problems [33].
Figure 2-12. Cross validation to approach the model selection problem.
Finally, although the approaches presented above about model assessment and selection in ML bring guidelines to choose the most promising method over a set of candidates, this process is usually tedious and computationally expensive. This is generally done by ML experts who make use of their knowledge or by nonexpert users who tackle the problem using a trial and error approach that causes the success of ML comes at a high-cost [34].
2.4 Deep Learning
DL is a subfield of ML that is based on Artificial Neural Networks (ANN)s. The difference between DL and ML is shown in 2-13. Traditional ML algorithms require manual feature extraction. A deep neural network automatically extracts features by passing the input image through its layers.
Figure 2-13. The difference between DL and ML
17
ANNs were designed to simulate the human brain by providing computers with the capabilities of humans to learn. A perceptron consists of a single neuron the same as a biological neuron, as shown in Figure 2-14. A biological neuron receives electrical signals from its dendrites, modulates them in various amounts, and then fires an output signal through its synapses. The output is fired only when the total strength of the input signals exceeds a certain threshold. The output is then fed to another neuron, and so forth. To simulate it, the artificial neuron performs two consecutive functions. First, it calculates the weighted sum of the inputs. Then, it applies a step function to the result to determine whether to fire the output or not. Note that, not all input features are equally important and to represent that, each input node is assigned a weight value to reflect its importance.
Figure 2-14. Artificial neurons were inspired by biological neurons.
As shown in Figure 2-15, a perceptron takes 1 to n variables as input and it then performs a weighted sum. Each input variable has an associated weight that measures how relevant each variable is. In this way, some variables will have more influence than others in the final decision.
Finally, a linear activation function is applied over the resulting weighted sum to get a binary output [35].
Figure 2-15. Structure of a perceptron.
18
Multilayer Perceptron (MLP) is a supervised feed-forward neural network that is composed of stacked layers of the perceptron. Thus, it simulates a human brain where multiple layers of neurons are connected to each other. The MLP is composed of at least three layers: input, hidden, and output as shown in Figure 2-16. In this network, the data flows through the network from the first to the last layer. Here, the neurons represent a computational node, whereas the edges represent the corresponding weights. In the MLP, the input layer refers to the layer responsible for feeding input data into the network. This layer contains as many neurons as input variables are. Hidden layers are considered those all layers located between the input and the output layer, and there can be one to n layers. Opposite to the original perceptron, neurons within these layers apply non-linear activation functions because an output (y) that varies non-linearly with its explanatory variables is required. Finally, the output layer is responsible for giving the result (y).
For classification tasks, this layer typically contains as many neurons as target classes [36].
Figure 2-16. Multi-Layer Perceptron.
At the training phase, the input data is feed-forwarded into the network until obtaining the final prediction. At this stage, all the neurons of each layer process the corresponding received data, which may come from the input data or from other neurons within the previous layer. As this is a supervised method, the output values are compared against the ground truth to compute the error between them. Next, the error is propagated from the last to the first layers of the network using the backpropagation method. Hence, all the weights are adjusted consequently to approximate the target function. As mentioned, the number of hidden layers can be increased as much as required, where a more abstract representation of the input data can be obtained as this number increases, thus allowing to solve more complex problems. Since the number of hidden layers determines the depth of ANNs, DL can also be defined as MLP with a larger number of hidden layers. However, there is not a concrete number of layers at which a network is considered deep. Therefore, DL algorithms are able to build hierarchical concepts by stacking lower to higher feature representations to learn complex functions, mapping the input to the output directly from raw data, without requiring human-based features. As a downside, increasing the number of hidden layers will also increase the required computational power to train the network, since
19
computing the calculations of each neuron and then adjusting their weights is a computationally expensive process. So, new DL architectures such as CNNs and Recurrent Neural Networks (RNN) were designed not to connect all the neurons to each other, thus reducing the required number of operations. As a consequence, large neural networks can currently be trained with large volumes of data to solve more complex problems, outperforming more traditional algorithms in a wide range of domains [37].
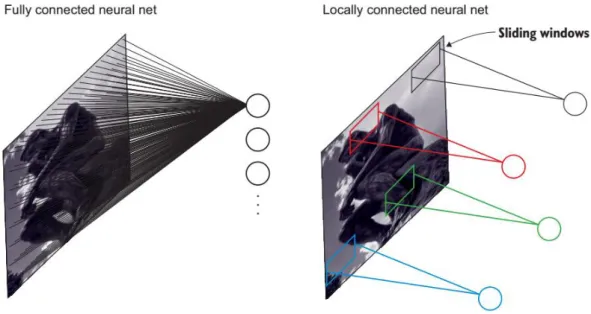
A CNN is a type of DL algorithm that was originally designed for processing images and CVs such as object detection and face recognition. Its success lies in its ability to extract the most relevant features from input data, which is then used to make the final decision [38]. MLPs are composed of dense layers that are fully connected. Fully connected means that every node in one layer is connected to all nodes from the previous and the next layers. So, each neuron has weights to train, which is not big for small images. However, what happens with images with 1,000 × 1,000 dimensions. It will yield 1 million parameters for each node in the first hidden layer. So, if the first hidden layer has 1,000 neurons, this will yield 1 billion parameters even in such a small network. Imagine the computational complexity of optimizing 1 billion parameters after only the first layer. This number will increase drastically and get out of control fast when you have tens or hundreds of layers. On the other hand, CNN is a locally connected layers, as shown in Figure 2.17. Nodes are connected to only a small subset of the previous layers’ nodes. Locally connected layers use far fewer parameters than densely connected layers.
Figure 2-17 (Left) Fully connected neural network, (Right) Locally connected network.
This local connectivity is called filter or kernel and is slid over the input data to extract features from it. A filter is a set of weights that are learned during the training phase. In this context, a convolution is defined as the dot product between the filter and the segment of the input data where the filter is applied. As a result of the convolution, a feature map containing the features of a given segment is obtained. Thus, filters act as feature detectors. At the time of applying a convolution, multiple filters can be used so that different features of the same data can be detected. Furthermore, convolutional layers are composable, meaning that the output of a convolutional layer can be fed into another. Consequently, several convolutional layers can be stacked to form a deeper CNN so that the network can detect higher-level, more abstract features.
Figure 2-18. illustrates typical CNN architecture for a toy image classification task. An image is an input directly to the network, and this is followed by several stages of convolution and pooling.
Thereafter, representations from these operations feed one or more fully connected layers.
20
Finally, the last fully connected layer outputs the class label. Despite this is being the most popular base architecture found in the literature, several architecture changes have been proposed in recent years with the objective of improving image classification accuracy or reducing computation costs[39].
Figure 2-18. CNN image classification pipeline.
• Convolutional Layers. The convolutional layers serve as feature extractors, and thus they learn the feature representations of their input images. The neurons in the convolutional layers are arranged into feature maps. Each neuron in a feature map has a receptive field, which is connected to a neighborhood of neurons in the previous layer via a set of trainable weights. Inputs are convolved with the learned weights to compute a new feature map, and the convolved results are sent through a nonlinear activation function. All neurons within a feature map have weights that are constrained to be equal; however, different feature maps within the same convolutional layer have different weights so that several features can be extracted at each location. More formally, the kth output feature map Yk can be computed as f (Wk * x) where the input image is denoted by x; the convolutional filter related to the kth feature map is denoted by Wk; the multiplication sign in this context refers to the 2D convolutional operator, which is used to calculate the inner product of the filter model at each location of the input image; and f (·) represents the nonlinear activation function. Nonlinear activation functions allow for the extraction of nonlinear features.
Traditionally, the sigmoid and hyperbolic tangent functions were used; recently, rectified linear units have become popular.
• Pooling Layers. The purpose of the pooling layers is to reduce the spatial resolution of the feature maps and thus achieve spatial invariance to input distortions and translations.
Initially, it was common practice to use average pooling aggregation layers to propagate the average of all the input values, of a small neighborhood of an image to the next layer.
However, in more recent models, max-pooling aggregation layers propagate the maximum value within a receptive field to the next layer. Formally, max-pooling selects the largest element within each receptive field such that. Figure 2-19 illustrates the difference between max-pooling and average pooling. Given an input image of size 4 × 4, if a 2 × 2 filter and stride of two is applied, max-pooling outputs the maximum value of each 2 × 2 regions, while average pooling outputs the average rounded integer value of each subsampled region.
• Fully Connected Layers. Several convolutional and pooling layers are usually stacked on top of each other to extract more abstract feature representations in moving through the network. The fully connected layers that follow these layers interpret these feature representations and perform the function of high-level reasoning.