Eduardo Basurto and Gerardo Odriozola∗
Area de F´ısica de Procesos Irreversibles, Divisi´´ on de Ciencias B´asicas e Ingenier´ıa, Universidad Aut´onoma Metropolitana-Azcapotzalco,
Av. San Pablo 180, 02200 CD M´exico, Mexico P´eter Gurin and Szabolcs Varga
Institute of Physics and Mechatronics, University of Pannonia, P.O. Box 158, Veszpr´em H-8201, Hungary (Dated: 2019-12-03)
The effect of out-of-plane orientational and positional fluctuations are examined in the phase behavior of hard spherocylinders confined between two parallel walls. The stability of isotropic, nematic and solid phases are studied for aspect ratios (κ= 1 +L/σ, whereσandLare the diameter and length of the cylinder) of 8, 10, and 16, while the width of the slit-like pore, H, is set in the quasi-two-dimensional regime, σ < H ≤ 2σ. Using replica exchange Monte Carlo (REMC) simulations and Onsager theory we provide evidence for the stabilisation of the nematic order with increasing pore width. The minimum surface density necessary to exhibit nematic order remains nearly the same with increasingH while the upper bound of nematic order is postponed to higher densities in detriment of the single-layer-solid phase. We prove that a drying-out effect takes place in the pore as the density increases linearly from the wall to the middle of the pore in the ideal gas limit. This behavior is kept for the isotropic phase and partially in the nematic one, while a wetting behavior is observed at the walls mostly for the solid phases. Forκ= 8, we have also observed a compressibility signal of a transition between an isotropic fluid and a cluster-like fluid. This cluster phase is destabilized by increasingH. Finally, we build a master diagram, where the drying-wetting, solid-solid, and close packing density curves are independent fromκ.
I. INTRODUCTION
The rich phase behavior of hard body fluids depends very strongly on the shape of the particles [1] and the con- fining dimension [2, 3]. It is now well understood that the anisotropic shape of particles is responsible for the forma- tion of mesophases such as the the nematic, smectic, and columnar. Similarly, confinement gives rise to very rich phase behavior. For example, depending on the interac- tion between the confining walls and the particles, several phenomena may arise such the wetting, evaporation, layer- ing, and different types of anchoring [4–8]. Probably, the most important consequences of strong confinement are re- lated to the fact that the nature of orientational ordering of anisotropic particles is quite different in two and three dimensions. The three-dimensional (3D) nematic phase is accompanied by long range orientational order, while the two-dimensional (2D) one is quasi-long ranged and the ori- entational correlation decays algebraically. In addition to this, in case of particles with sufficiently large anisotropy, the 3D isotropic-nematic (I-N) phase transition is usually first order, while the 2D nematic transforms continuously to the isotropic phase through the Kosterlitz-Thouless disclination unbinding mechanism with decreasing den- sity [9, 10]. The strange nature of 2D nematic phase was explored with several simulation studies [11–17] and even with experiments [18, 19]. Note that similar differences are present in the properties of 2D and 3D solid phases, too [20–23].
∗godriozo@azc.uam.mx
The simplest way to investigate the crossover between 2D and 3D phase behavior of hard body fluids is to confine the particles between two parallel hard plates, where set- ting the wall-to-wall distance (pore width) from infinity to the shortest dimension of the particle allows to interpolate between 3D and 2D bulk properties. That is, by tuning the pore width it is possible to examine the expected intermediate behavior between 2D and 3D orientational and positional ordering of rod-like particles. It is also possible to do experiments with hard ellipsoids (or sphero- cylinders), where the confined hard ellipsoids corresponds to the 2D bulk system of hard ellipses in the case of most extreme confinement [24]. Comparing the strictly 2D and 3D I-N phase transitions, it is observed that the mini- mum shape anisotropy required to stabilize the nematic ordering is very different. In the case of hard ellipsoids, confinement stabilizes slightly the nematic order, which is neither 2D nor 3D nematic, because the aspect ratio (the ratio of the lengths of major and minor axes) must exceed 2.8 in 3D bulk [25, 26], while the minimal aspect ratio is only 2.4 in 2D bulk [27]. This slight stabilization effect of hard flat walls on the nematic ordering of the ellipsoids was confirmed by Monte Carlo simulations [28, 29]. The opposite trend happens in the case of hard spherocylin- ders, i. e. confinement destabilizes the nematic ordering, since the minimal aspect ratioκ(the total length divided by the diameter) is 4.8 in 3D [30, 31], while it is around 8 in 2D. A possible explanation for this behavior is that the cylindrical part of the particle behaves as a hard rect- angle in 2D confinement, which is known to favor the formation of clusters and, depending on the shape of the particle tip, even the formation of a tetratic phase is fea-
sible when the anisotropy is moderate [32–34]. The effect of central and terminal shape parts of rod-like particles was examined in a quasi-2D granular system, where the monolayer of hard rods was vibrated vertically [35]. It was found that the cylindrical shape of the central part of the particles is responsible for the tetratic correlation, while rounded or tapered tips favor nematic order [35].
Monte Carlo simulation studies also confirm these find- ings, given that the tetratic phase was found in the system of weakly anisotropic hard rectangles [36, 37], while only short ranged tetratic correlations were observed in the case of hard discorectangles [32]. Therefore, it is logical to consider the tetratic correlation in strictly confined hard spherocylinders (hard discorectangles) as a key factor for the destabilisation of the nematic phase.
It must be also taken into account that the properties of 2D and 3D nematic phases are qualitatively different.
This can be seen in the system of hard spherocylinders placed in a slit-like pore, where the hard flat surfaces induce a planar adsorption and a surface phase transition between orientationally disordered and ordered surface layers (2D I-N ordering) with increasing density in the pore. This surface induced 2D I-N transition is not related to the capillary I-N transition of 3D nematisation, because the 3D I-N transition terminates at a critical density larger than the 2D I-N transition density [38–40]. Monte Carlo simulations found that the 3D nematisation can be strengthen with narrowing pores in such an extent that the capillary isotropic phase vanishes at pore widths smaller than about the double of the rod length so that only the surface induced nematic phase survives in very narrow pores [41]. The 2D I-N transition was studied for the fluid of very long hard spherocylinders, which are placed between two planar hard walls [41–43]. It was found that the effect of adding out-of-plane positional and orientational freedom destabilizes the 2D nematic ordering, which means that more and more particles are needed to form the 2D nematic phase with increasing wall-to-wall distance in the pore [44]. This is due to the fact that the out-of-plane orientation freedom decreases the effective in-plane shape anisotropy of the particles, while the positional out-of-plane ordering increases the available room for particles. From a 2D point of view, the confined rods can be considered as a polydisperse mixture of 2D hard discorectangles, where the polydispersity takes place both in length, due to the increase of orientational freedom, and diameter, due to the increase of out-of-plane positional freedom. The effect of polydispersity can be stronger for shorter rods, where the nature of 2D I-N transition changes from continuous to first order [45].
In this work, we study the phase behavior of hard spherocylinders which are placed between two parallel walls using replica exchange Monte Carlo simulations and Onsager theory. The length,L, and the diameter,σ, of the cylindrical part of the particle is chosen such that the aspect ratio, k= 1 +L/σ, is fixed to 8, 10, and 16.
The wall-to-wall distance,H, is restricted to stay between σ and 2σ, σ < H <2σ, which makes the system be in
the quasi-2D region, where two independent fluid layers cannot evolve in the slit. This means that layers adsorbed on opposite walls directly interact with each other. We pay special attention to the adsorption properties, the cluster formation, and the stability of the ordered phases.
We show that almost the same number of particles per unit area,ρ, is enough for the formation of nematic or- der withH =σandH= 2σ, even though the available volume for the particles is double forH = 2σ. In addi- tion to this, wetting of the walls occurs at lowerρvalues with increasing the pore widthH, whereas the opposite tendency can be seen for the single-layer-solid (SLS) for- mation curve. All these results are summarized in a phase diagram, which share similar features for all studied κ values. Indeed, the wetting lines, the maximal packing density lines, and the two-layer-solid (TLS) formation lines approximately collapse to define master curves.
II. SIMULATION DETAILS
We have performed replica exchange Monte Carlo (REMC) simulations of confined hard spherocylinders.
This technique was developed to enhance sampling from equilibrium, specially in the cases where the free energy landscape is uneven [46, 47]. It is based on the definition of an extended ensemble,Qext =Q
iQi,Qibeing a partition function of ensemblei. In our case, we make use of an ex- pansion of the isobaric ensemble,Qext=Q
iQ(N, Pi, T), whereN,T, andPi are the number of particles, temper- ature, and the three dimensional pressure of ensemblei, respectively [48]. Here,N andT are fixed for all ensem- bles definingQext. This expansion is useful to deal with systems of hard particles [49–51].
As mentioned, spherocylinders are hard particles made up of two hemispheres of diameterσconnected by cylin- ders of lengthL. For these particles, the aspect ratio is then given byκ=L/σ+ 1. The overlapping algorithm for spherocylinders consists on a simple method, where the distance between the nearest points of two line-segments with length L must be larger thanσ [52]. In addition, the overlapping of spherocylinders with walls is simply achieved by comparing the distances between the center of the spheres at each end of the particle and the corre- sponding wall, which cannot be less than the hemisphere radius,σ/2. Our system is then built by placingN sphe- rocylinders between two parallel hard walls separated a distance H and perpendicular to the z axis. We build two different starting arrangements. On the one hand, we considerNr different loose initial configurations, where particles positions and orientations are taken at random while avoiding overlaps. On the other hand, we also build Nr identical compact initial configurations, where par- ticles are packed parallel to the walls in order to yield the densest packing, see the Supplemental Material (SM).
That is, by stacking side-by-side particles alternating the z-position to get in contact with each wall while forming columns, which are then assembled by making the hemi-
spheres of the one column enter into the holes of the next one. In the first case, the system evolves by increasing density, whereas in the second case the system of replicas follows an expansion.
We have applied periodic boundary conditions only in the x and y axes, given that the z axis is bounded by the walls. We have also employed Verlet lists to gain efficiency.
The values of βPi follow a geometric progression, with a minimum pressure of βPmin = 0.02σ−3 and a maxi- mum pressure of βPmax = 2.0σ−3, with β = (kBT)−1. Each of the Nr replicas performs the sampling of the isobaric ensemble at a fixedPi value, where conventional displacement, rotation, and volume change trials are car- ried out. This is implemented in Graphic Processing Units (GPUs), being each replica handled by a single core, allowing for the definition of a large number of replicas. Next, information is gathered by the CPU where replica swaps are tried with acceptance probabil- ity min{1,exp [(βPi−βPj)(Vi−Vj)]}, wherePi,Pj, Vi, andVj are the pressures and volumes of replicasi and j, respectively. We allow swap trials of replicas sampling from ensembles i andj with |i−j| ≥1, in such a way that we obtain an average acceptance around 30%. This is done as explained in detail elsewhere [53].
In all cases we run the simulations long enough to en- sure the system or replicas reaches a stationary state, presumably equilibrium. After achieving this condition, we perform several averages over the system of replicas, including probability density functions and structural properties. For most runs we have defined a relatively large number of replicas,Nr= 230, andN = 128, 160 and 144 forκ= 8, 10 and 16, respectively. Note that this tech- nique takes advantage of density fluctuations that increase with decreasing the system size. Consequently, it does not provide an efficient way to study long-range correlations among particles, but yields a detailed equation of state, βP(ρ), and isothermal compressibility,χ(ρ). However, in a few cases we have performed runs with Nr= 80 and N '1400 to observe quasi-long range correlations.
III. RESULTS
In the case of H → σ, the confined system of sphe- rocylinders by parallel plates should produce the same results as discorectangles. This last case is studied in reference [32] for several κvalues and in particular for κ = 16. We consider this case as a reference to check the correctness of our implementation. For this purpose, we perform simulations with κ = 16 and H = σ, by compressing loose random configurations and expanding tightly packed structures. The comparison of our out- comes with those given in reference [32] is shown in panel a) of Fig. 1, where the 2D pressure, βP H, is plotted against the 2D number density, ρ=N H/V. Note that each of our curves is constituted by 230 points, and this is why we employ lines to represent them. Compression and expansion runs yield the same stationary curves, which
a)
b)
c)
FIG. 1. a) 2D pressure,βP H, b) isothermal compressibility, χ, and c) nematic order parameter,SN, as a function of the 2D number density,ρ, forH=σandκ= 16. Symbols in panel a) are data from Bates and Frenkel [32] forH =σ. Black and red lines correspond to compression and decompression runs. The snapshots show typical configurations of the isotropic fluid, nematic fluid, and solid, as increasing density.
in addition coincide with the data reported by Bates and Frenkel [32]. Hence, we can safely conclude that our implementation is correct. In addition, the isother- mal compressibility, as obtained from density fluctuations throughχ=N(hρ2i − hρi2)/hρi2, also produce identical curves for compression and expansion runs. The same occurs for the nematic order parameter
SN =
* v u u t 1
N
N
X
i=1
cos(2φi)
!2
+ 1
N
N
X
i=1
sin(2φi)
!2+ , (1)
whereφi is the angle between an arbitrary fixed axis on the xy plane and the projection of the axis of theith par- ticle on this plane. Notwithstanding, we have observed marked differences of this parameter when comparing runs starting from loose random configurations and com- pact ordered structures during a long equilibration time, despite the fact thatβP(ρ) andχ(ρ) were nearly the same at much shorter times. The same was observed for the tetratic order parameter,ST, which is defined by replacing 2φby 4φin Eq. (1) (not shown). For 0.038< ρ <0.045, the former starting condition produces some configura- tions with lowerSN and higherST values than the second one, which yields arrangements where all particles are clearly aligned with a well defined director. The fact of having different configurations during long simulation
a)
b)
c)
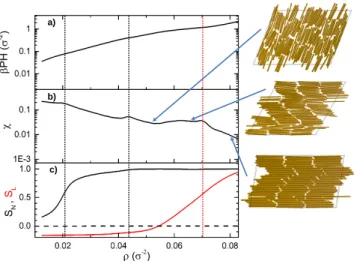
FIG. 2. a) 2D pressure,βP H, b) isothermal compressibility, χ, and c) nematic (black) and layer (red) order parameters, SN andSL, as a function of the 2D number density,ρ, for H = 1.8σ andκ= 16. Vertical dashed lines are located at the differentχ(ρ) maxima. The snapshots corresponds to the densities signaled by the arrows.
times signals that equilibrium is hard to achieve. Indeed, the compression curve for SN andST were observed to evolve very slowly with REMC cycles, approaching the expansion one. From here on, we only show expansion curves, which are observed to produce equilibrium with a smaller computing effort.
The isothermal compressibility curve,χ(ρ), shown in the panel b) of Fig. 1 shows two peaks. The first one is linked to a sudden increase of the nematic order param- eter,SN, which is a signature of the I-N transition. In addition,SN > ST for allρvalues. Snapshots correspond- ing to the isotropic and nematic fluids are depicted at the left of Fig. 1. Furthermore, this firstχpeak, located at ρIN= 0.021±0.001, is closely preceded by the inflection point of SN(ρ). We observe that the density distribu- tion is always unimodal for all pressure values around this point signaling a high order transition (not shown), which is consistent with a Kosterlitz-Thouless disclina- tion unbinding mechanism [9] and agrees with strictly 2D results [32]. Orientational correlations in the 2D nematic phase decays algebraically, and soSN also diminishes with increasing the system size. Nonetheless, we expect the shape of curveSN(ρ) to hold with increasingN and so, the location of its inflexion point should remain invariant for finite systems. The second peak ofχcorresponds to the nematic-solid transition reported in the phase diagram given elsewhere [32] and occurs atρNS = 0.041±0.001.
As can be seen, it also coincides with a smaller increase of SN(ρ), where the particles further align to form the solid-like structure. Here, the appearance of columns and rows is observed. Recall that in two dimensions there are no true crystals, given that thermal fluctuations destroys long range order [54]. According to the unimodal density distributions we have obtained, although stronger than
FIG. 3. Positional distribution function,f(z), as obtained forκ= 16 andH = 2σfor pressures in the range 0.02σ−3<
βP < 2.0σ−3. Green, blue, and red curves correspond to the isotropic, nematic, and solid phases, respectively. The black curve corresponds to the ideal gas exact solution. The broader blue curve corresponds toSL∼0. The insets show lateral snapshots of some representative configurations, which correspond to the profiles of isotropic, nematic, and solid phases.
the I-N transition, the nematic-solid transition is not first order.
For the same κ = 16, fixingH to 1.8σ produces the results shown in Fig. 2. It is observed a somewhat uneven but smooth increasing βP H as a function of ρ, which translates into aχ(ρ) showing the three maxima signaled by the vertical dashed lines. With increasing pressure, the first one corresponds to the I-N transition, the second one to the nematic-solid transition, and the third one, a very wide peak occurring at much larger ρvalues, is related to a layering process. Note that the isotropic-nematic location, ρIN, is close to the inflexion point of SN(ρ), which is practically the same as for the case H ≈σ. In addition,ρNS is increased a bit and it continues to match a small increase ofSN(ρ). In Fig. 2 c) we show, together withSN, the layering order parameter which is given by
SL=
6R(σ−H)5/12
(σ−H)/2 (ρ(z)−ρ)dz¯ +R(H−σ)/2
(H−σ)5/12(ρ(z)−ρ)dz¯
5(H−σ) ¯ρ ,
(2) where ρ(z) is the 2D number density profile and ¯ρ = R(H−σ)/2
(σ−H)/2 ρ(z)dz/(H−σ).
Note that SL is negative if the particles are located in the middle of the pore, while it is positive if the particles are adsorbed on the walls. Interestingly,SLis zero for flat density profiles. Therefore we can distinguish the drying- out and wetting phenomena at the walls with the help of this parameter. The possible values ofSL are restricted into the interval of [−1/5,1]. Thus, negative values point out to drying and positive values to a wetting situation.
TheSL(ρ) curve shown in Fig. 2 c) turns positive above ρNS, so that wetting of the walls starts well inside the solid region. Hence, isotropic and nematic phases are drying of the walls for H = 1.8σ. Furthermore, the
a)
b)
c)
d)
FIG. 4. a) 2D pressure,βP H, b) isothermal compressibility, χ, c) nematic order parameter, SN, and d) layering order parameter, SL, as a function of the 2D number density, ρ, forσ≤H ≤2σandκ= 16. Different curves correspond to differentH values, as labeled.
increasing rate of SL(ρ) is small, which yields a not so well defined inflexion point. This point seems to coincide with the χ(ρ) maxima and we take it as the transition between a SLS and a TLS. The three snapshots inserted in Fig. 2 corresponds to the dry SLS (SLSd), wet SLS (SLSw), and wet TLS (TLSw), from top to bottom. This last structure shows neighboring particles belonging to the same column alternating positions in thez direction, which leads to a much larger packing density (see the SM for a comparison between the snapshots of 1LSw and the 2LSw forN =1400).
As mentioned above, a simple criteria for discriminat- ing wetting from drying could be given in terms ofSL. Its definition relies on the density profile of the particles centres, ρ(z), or equivalently, on the positional distri- bution function defined as f(z) =ρ(z)/ρ, which fulfills RH/2
−H/2f(z)dz= 1. This positional distribution function is shown in Fig. 3 forκ= 16 andH= 2σ. In this plot we employ different colors to distinguish among the curves belonging to different phases. We also insert as a black line thef(z) corresponding to the ideal gas limit. In this case, the exact calculation yields
f(z) =
2
H−σ− 4|z|
(H−σ)2 if σ−H2 ≤z≤H−σ2 ,
0 otherwise,
(3)
forH < κσ. This expression is derived in the first section of the SM. We can observe that this limiting formula agrees perfectly with our simulation results forρ <0.02.
At these densities a drying-out effect takes place because the particles move away from the walls and accumulate in the middle of the pore. This drying-out effect is due to the fact that the density is low enough and the particles can maximize the number of microstates with the gain coming from the orientational freedom when they are located in the middle of the pore. A significant departure from the ideal gas limit is observed for the nematic phase, where the midplane maximum diminishes its height and small peaks emerge close to the walls. For a large enough pressure, the profile looks like the highlighted blue curve, which corresponds toSL ∼0 and has the peaks at the walls with a similar height than that at the midplane.
Thus, this curve can be considered as a dividing line between the drying and wetting phenomena of the walls forH= 1.8σ. Conversely, the particles wet the walls in the solid phase. For a low pressure solid, wetting is not strong enough to produce a couple of well defined layers at the walls because several particles are still located close to the midplane. For a large enough pressure particles are totally excluded from the midplane and peaks at the walls are fully developed. In between these two cases, peaks at the walls continuously grow with increasing pressure, while the depletion at the middle of the pore becomes stronger. This yields a smooth grow ofSL(ρ), which signals a broad solid-solid transition. This is due to the fact that the SLS-TLS transition imply not only the formation of two layers but also their arrangement to yield a structure where particles alternate theirz positions.
Our results deviate substantially from previous simula- tion results, which were performed in much wider pores.
It was observed that the particles wet the walls and a thin nematic film forms in the vicinity of the walls at such den- sities, where the middle of the pore is still isotropic [41, 42].
The change of the equation of state, the compressibility, and the order parameter curves with increasingH can be seen in Fig. 4. At lowρvalues, all curves collapse and produce the first peak ofχ(ρ) with practically the same ρIN. As mentioned, this peak is correlated to a sudden increase of SN. It should be noted that for the same 2D number densityρand for increasingH, SN slightly decreases. This is a result of the gain in possible polar angle values, which decreases the 2D shape anisotropy (the effective kappa in the xy plane). The nematic-solid transition, the one observed at ρ ∼ 0.04, shifts to the right with increasingH. The main consequence of these results is that the out-of-plane orientational and posi- tional freedom can support the formation of 2D nematic ordering. Thus, the density range for the nematic phase widens. It is surprising that practically the same amount of particles is enough to induce nematic ordering when we double the pore width and the available room for the particles. At even larger densities, the curves for low and highH behave very differently. ForH <1.6σthe shape ofβP(ρ) is nearly kept, strongly contrasting with cases
a)
b)
c)
d)
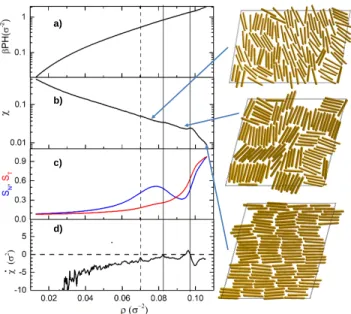
FIG. 5. a) 2D pressure,βP H, b) isothermal compressibility, χ, c) nematic (blue) and tetratic (red) order parameters,SN
andST, and d) derivative ofχ(ρ), ˙χ(ρ), as a function of the 2D number density,ρ, forH =σandκ= 8. The snapshots corresponds to the densities signaled by the arrows.
having H >1.6σ, where the systems yield much larger densities. This increase in density is accompanied with a wide peak of χ(ρ), as discussed forH = 1.8σ, which in turn is linked to an increase of SL, indicating that the particles start locating close to the walls. Note that the density at which wetting commences, ρW, shifts to the left with increasingH. Nonetheless, except forH = 2σ, wetting always starts once the solid phase is formed. Note also that for H > 1.8σ the location of the χ(ρ) peak signaling the solid formation is not clear. Hence, in this case we have performed simulations withN'1400 and Nr= 80 to determine, from the decayment of the radial distribution peaks, the transition density. We have fol- lowed the same procedure for allκvalues to determine all fluid-solid transitions occurring above the wetting line.
For H ' σ, decreasing κleads to the disappearance of the nematic fluid phase. According to Bates and Frenkel [32] this happens close toκ= 8. In this case, we observeSN curves reaching values close to 0.5 and some snapshots where a clear director can be defined, as shown by the top right snapshot of Fig. 5. Nonetheless, at the inflexion point of SN(ρ), neither theχ(ρ) curve nor its derivative, ˙χ(ρ), show any sign of an I-N transition. In addition, in this case we have also performed simulations withN ≈1400 showing much lowerSN values and a fast decay of orientational correlations, confirming the absence of a nematic fluid. So,κ= 8 seems to be just below the κ limit for obtaining a nematic fluid phase. Note also that the nematic phase is frustrated by the appearance of clusters forming a mosaic-like arrangement, which makes SN(ρ) to decrease whileST(ρ) increases up to the point
a)
b)
c)
d)
FIG. 6. a) 2D pressure,βP H, b) isothermal compressibility, χ, c) nematic (solid lines) and the difference between the nematic and the tetratic order parameters (dashed lines), SN and SN−ST, and d) layering order parameter, SL, as a function of the 2D number density, ρ, for σ ≤ H ≤ 2σ.
All data correspond to κ= 8. Different curves correspond to different H values, as labeled. Snapshots show typical configurations forH = 2σ and the densities pointed out by the arrows.
of yielding ST(ρ) > SN(ρ). Recall that these clusters appear even by starting from tight compact parallel con- figurations and so, one can safely expect them to belong to equilibrium. Furthermore, the appearance of these clusters is accompanied by a tiny peak ofχ(ρ), probably more noticeable by the zero value of ˙χ(ρ), suggesting the existence of an isotropic to tetratic transition, as the one formed by hard rectangles [37], although in this last case SN(ρ) remains close to zero for allρ. We should mention that Bates and Frenkel described this phase as globally isotropic, with strong local positional and orientational correlations between particles [32]. They have indeed ruled out the existence of a tetratic phase forκ= 6 and ρ= 0.125 by studying the decay of the orientational order with distance for systems withN = 1000. We have con- firmed this with ourN ≈1400 simulations forκ= 8 and H'σ. So, in view of these results, it is difficult to name this phase otherwise than globally isotropic with strong tetratic correlations. Nonetheless, given the existence of this tinyχ peak, which persists with increasingH up to H= 1.7σas shown in Fig. 6 b), let us call it cluster phase.
It should also be mentioned that tetratic correlations are also found for similar systems [35, 55], where particle tips
FIG. 7. 2D pressure,βP H, and nematic order parameter,SN, as a function of the 2D number density,ρ. Full lines correspond to Onsager outcomes and dashed lines to simulations. Black and red correspond toH = 1.1σand 2.0σ, respectively. The top panel correspond toκ= 16 and the bottom one toκ= 10, as labeled.
are shown to have an important impact on the presence of the tetratic order. We speculate that there exist a system
with κ&8 which forms a nematic phase atH = 2σand
produces clusters atH =σ.
Results forκ= 8 andσ≤H≤2σare shown in Fig. 6.
As for all κ, the curves collapse for lowρvalues, as the system approaches the ideal gas limit, and they shift to the right with increasingH for largeρvalues. In addition, the χpeak signaling the isotropic-cluster transition shifts to the right and decreases its height, vanishing atH = 1.8σ.
This is accompanied by a smoothing of theSN(ρ) drop as well as the disappearance of the well of the difference of the nematic and tetratic curves,SN(ρ)−ST(ρ). Indeed, SN(ρ)−ST(ρ) turns always positive for H >1.8σ. In other words, cluster formation is hindered by increasing the pore width. This process ends at H = 2σ, where the drop ofSN(ρ) disappears and clusters are not longer observed. Finally, the other features observed for the fluid- solid and layering transitions already shown forκ= 16 are kept. In the SM we present theκ= 10 case, which
/
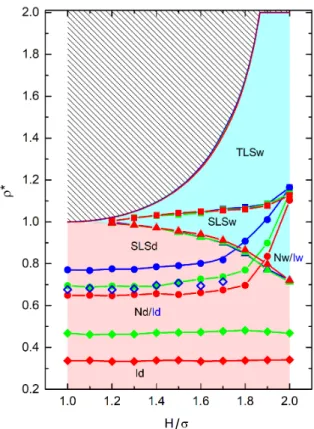
FIG. 8. General phase diagram of hard spherocylinders confined by two walls.ρ∗=ρ/ρcp, whereρcpis the 2D close packing density forH =σ. Inaccessible densities are shown by the hatched area. Blue, green, and red lines correspond toκ= 8, 10, and 16, respectively. Solid squares, circles, and diamonds correspond to SLS-TLS transition, nematic-solid transition, and I-N transition, respectively. Open diamonds correspond to a probable clustering transition forκ= 8. Tri- angles correspond to wetting line, i. e. the density location at whichSL= 0. This line divides the diagram into wetting and drying regions, which are colored with bluish and reddish tones, respectively. Labels I, N, SLS, and TLS correspond to isotropic, nematic, single-layer-solid, and two-layer-solid, respectively. The final letter in the labels, w and d, make reference to wetting and drying, respectively. Blue labels Iw and Id correspond only to theκ= 8 case.
shows an I-N transition while producing some cluster-like configurations.
The outcomes of the Onsager theory are compared to data from simulations in Fig. 8 for κ = 16 and 10.
The implementation of the Onsager theory is given in in section II of the SM. It is observed that the general trends of the equation of states,βP(ρ)H, and the nematic parameter curves,SN(ρ), are qualitatively captured by the theory. In addition, for increasingH it captures the shift ofβP(ρ)H toward smaller values, and for increasing κthe shift ofSN(ρ) to reach lower densities. Also, the theory predicts the independence of the I-N transition fromH, which is practically confirmed by simulations. It seems that the theory improves the prediction ofρIN for increasingκ.
Finally, we build a general phase diagram that depicts ρ∗=ρ/ρcpas a function ofH,ρcpbeing the close packing density for H = σ. The original phase diagrams as a function of ρ and η are given in the SM. This general phase diagram is given in Fig. 8. We hatch the region of inaccessible densities and include the I-N transitions, the nematic-solid transitions, and the SLS-TLS transitions.
Note that the maximal packing density curves obtained for the differentκvalues collapse to define a master curve, and this fact allows us to define a common inaccessible region. The same happens with the obtained wetting lines, which collapse to define a single curve. This let us define the same wetting and drying areas for allκvalues.
These are colored with pale red for drying and light cyan for wetting. A similar collapse is also observed for the two layer solid formation curves. As a consequence of the wetting and drying regions, we add an extra letter to the phases labeled in Fig. 8. For instance, the Nd and Nw labels for κ= 10 and 16 stand for drying and wetting nematic. No transition is observed between Nd and Nw as only a simple change inSL(ρ) occurs with increasing density. Similarly, we can identify an isotropic drying (Id) and an isotropic wetting (Iw) phase forκ= 8. The SLS phase can also be drying or wetting. In the case of lowH, the drying is preferred because the particles are located mainly in the center of pore to increase the orientational entropy. Note that the wetting region vanishes completely asH approaches σ. The SLSw appears at lower densities than the TLS, which is always wetting. Hence, we observe the following phase sequence with increasing density for H = 1.6σandκ= 10 or 16: 1) isotropic, 2) nematic, 3) SLSd, 4) SLSw and 5) TLSw. It is worth noting that the SLS density range decreases its size with increasing H, vanishing atH = 2σ. At this point, the nematic phase changes directly into a TLS.
Conversely to the close packing, wetting, and solid-solid transition curves, the I-N and the nematic-solid transitions shift toward lower densities with increasingκ. In other words, increasingκproduces a relative easiness to form ordered phases. We can see in the master diagram that the density range of the nematic widens at the expenses of the SLS with increasing pore width, while the density range of the isotropic phase is nearly constant, in good agreement with theoretical predictions (see Eq. (18) of SM). This means that the same number of particles per unit of area is needed to yield a nematic phase, irrespective ofH. This is a quite unexpected result given the obvious increase of accessible volume withH. Finally, the kink in the compressibilty we have obtained forκ= 8, associated a possible isotropic-cluster transition, disappears forH >
1.7σ. We have observed that increasingH disfavors the tetratic correlations.
IV. CONCLUSIONS
We have built the phase diagram of strongly confined spherocylinders with anisotropy 8, 10, and 16 in slit-
like pores. We have constrained the particles to the pore width range σ < H < 2σ. For this purpose, we have performed replica exchange Monte Carlo simulations, exact calculations in the ideal gas limit, and bifurcation analysis of the Onsager-theory. The stability regions of the isotropic, nematic, and solid phases have been determined to see the effect of varying the shape anisotropy and the pore width. In addition, the upper bound of the solid phase is bordered with the maximimal density of the close packed solid structure.
The three different phase diagrams corresponding to the different particle’s shape anisotropies,κ, share very similar features (see the last section of the SM). This allows to build a general phase diagram where some curves seems to be independent ofκ. In particular, the maximal accessible packing density, the lines splitting the drying and wetting regions, and the transitions toward a TLS, are very close to define a master curve. Conversely, the I-N and the nematic-SLS transitions are clearlyκdependent.
Our results also show that the isotropic-nematic curves do not depend onH, i. e. the same number of particles is needed to induce nematic ordering at H = σ and H = 2σ. This is against the naive linear expectation that doubling the pore width should be accompanied with doubling the number of particles to get the a similar behavior. Moreover, the out-of-plane orientational and positional fluctuations are believed to work against the orientational ordering as the 2D projected area of the hard spherocylinder is less anisotropic. Conversely to the I-N density dependence withH, the nematic-solid transition is postponed to higher densities as positional and orientational fluctuations are favored. Therefore, the stability region of the nematic ordering is enhanced by widening the pore. This behavior contrasts with the Monte Carlo results reported for L= 320σ, where the I-N transition density increases with the pore width for H > 2σ (note that the σ < H < 2σ region was not examined [44]).
Another important aspect of our work focuses on the drying or wetting behavior of the particles at the walls.
In the ideal gas limit, we show that the local density increases linearly from the wall to the middle of the pore.
This behavior results in a drying-out effect at the walls in the isotropic phase, whereas wetting of the walls is observed mostly for the solid phase. The nematic phase also exhibits a drying-out effect except close toH = 2σ, where wetting emerges at the walls.
Finally, we have observed forκ= 8 a compressibility signal, compatible with a weak higher order phase tran- sition between an isotropic fluid and a cluster-like fluid, neither of them showing quasi-long range orientational order of any type. This cluster phase is destabilized by increasingH. We speculate the same destabilization may appear when considering particles with different degree of sharpening of their tips.
We would like to emphasize that our results show that the experimental detection of 2D nematic ordering can be easier in wider pores because the system can be less dense
and the cluster formation is not entropically favored. It is also feasible that the same stabilization of the nematic phase by widening the pore could occur for particles without rounded ends, such as cylinders.
ACKNOWLEDGMENTS
The authors thank finantial support from CONACyT through project A1-S-9197. GO acknowledge Fundaci´on Marcos Moshinsky for financial support. VS and GP thank the financial support of National Research, Devel- opment and Innovation Office – K 124353.
[1] L. Mederos, E. Velasco, and Y. Mart´ınez-Rat´on, J. Phys.:
Condens. Matter26, 463101 (2014).
[2] A. op Reininka, E. van den Pol, A. Petukhov, G. J. Vroege, and H. N. W. Lekkerkerker, The European Physical Jour- nal: Special Topics222, 3053 (2013).
[3] J. Chen, Progress in Polymer Science3, 54 (2016).
[4] L. D. Gelb, K. E. Gubbins, R. Radhakrishnan, and M. Sliwinska-Bartkowiak, Rep. Prog. Phys. 62, 1573 (1999).
[5] I. Rodr´ıguez-Ponce, J. M. Romero-Enrique, E. Velasco, L. Mederos, and L. F. Rull, Phys. Rev. Lett. , 2697 (1999).
[6] D. de las Heras, E. Velasco, and L. Mederos, Phys. Rev.
Lett.94, 017801 (2005).
[7] L. Harnau and S. Dietrich, in Soft Matter, edited by G. Gompper and M. Schick (Wiley-VCH, Berlin, 2007) Chap. 3, p. 159.
[8] M. Khadilkar and F. Escobedo, Soft Matter 12, 1506 (2016).
[9] J. M. Kosterlitz and D. J. Thouless, J. Phys. C6, 1181 (1973).
[10] D. Frenkel and R. Eppenga, Phys. Rev. A31, 1776 (1985).
[11] J. P. Straley, Phys. Rev. A4, 675 (1971).
[12] J. Vieillard-Baron, J. Chem. Phys.56, 4729 (1972).
[13] J. Cuesta and D. Frenkel, Phys. Rev. A42, 2126 (1990).
[14] H. Schlacken, H. J. M¨ogel, and P. Schiller, Molec. Phys.
93, 777 (1998).
[15] M. D. Khandkar and M. Barma, Phys. Rev. E , 051717 (2005).
[16] Y. Mart´ınez-Rat´on, E. Velasco, and L. Mederos, J. Chem.
Phys.122, 064903 (2005).
[17] R. Vink, Eur. Phys. J. B72, 225 (2009).
[18] K. Slyusarenko, D. Constantin, and P. Davidson, J. Chem.
Phys.140, 104904 (2014).
[19] A. Czogalla, D. Kauert, R. Seidel, P. Schwille, and E. Petrov, Nano Lett.15, 649 (2015).
[20] M. Schmidt and H. L¨owen, Phys. Rev. E55, 7228 (1997).
[21] A. Jaster, Phys. Rev. E59, 2594 (1999).
[22] A. Fortini and M. Dijkstra, J. Phys. Condens. Mat.18, L371 (2006).
[23] E. P. Bernard and W. Krauth, Phys. Rev. Lett. 107, 155704 (2011).
[24] Z. Zheng, F. Wang, and Y. Han, Phys. Rev. Lett.107, 065702 (2011).
[25] M. Allen and C. Mason, Mol. Phys.86, 467 (1995).
[26] G. Odriozola, J. Chem. Phys.136, 134505 (2012).
[27] G. Bautista-Carbajal and G. Odriozola, J. Chem. Phys.
140, 204502 (2014).
[28] X. Zhou, H. Chen, and M. Iwamoto, J. Chem. Phys.120, 5322 (2004).
[29] H. Miaoa and H. Mab, Chin. J. Chem. Phys. 29, 212 (2016).
[30] S. McGrother, D. Williamson, and G. Jackson, J. Chem.
Phys.104, 6755 (1996).
[31] P. Bolhuis and D. Frenkel, J. Chem. Phys. 106, 666 (1997).
[32] M. A. Bates and D. Frenkel, Phys. Rev. E112, 10034 (2000).
[33] Y. Mart´ınez-Rat´on, E. Velasco, and L. Mederos, Phys.
Rev. E79, 011711 (2006).
[34] Y. Mart´ınez-Rat´on and E. Velasco, Phys. Rev. E 79, 011711 (2009).
[35] V. Narayan, N. Menon, and S. Ramaswamy, J. Stat.
Mech.01, P01005 (2006).
[36] K. W. Wojciechowski and D. Frenkel, Comp. Met. Sci.
Technol.10, 235 (2004).
[37] A. Donev, J. Burton, F. Stillinger, and S. Torquato, Phys.
Rev. B73, 054109 (2006).
[38] R. van Roij, M. Dijkstra, and R. Evans, Europhys. Lett.
49, 350 (2000).
[39] R. van Roij, M. Dijkstra, and R. Evans, J. Chem. Phys.
113, 7689 (2000).
[40] R. Aliabadi, M. Moradi, and S. Varga, Phys. Rev. E92, 032503 (2015).
[41] M. Dijkstra, R. van Roij, and R. Evans, Phys. Rev. E 63, 051703 (2001).
[42] P. Brumby, H. Wensink, A. Haslam, and G. Jackson, Langmuir33, 11754 (2017).
[43] M. Semiromi and A. Avazpour, Liq. Cryst.45, 262 (2018).
[44] M. Cosentino Lagomarsino, M. Dogterom, and M. Dijk- stra, J. Chem. Phys.119, 3535 (2003).
[45] A. D´ıaz-De Armas and Y. Mart´ınez-Rat´on, Phys. Rev. E 95, 052702 (2017).
[46] A. P. Lyubartsev, A. A. Martinovski, S. V. Shevkunov, and P. N. Vorontsov-Velyaminov, J. Comp. Phys.96, 1776 (1992).
[47] K. Hukushima and K. Nemoto, J. Phys. Soc. Jpn.65, 1604 (1996).
[48] T. Okabe, M. Kawata, Y. Okamoto, and M. Mikami, Chem. Phys. Lett.335, 435 (2001).
[49] G. Bautista-Carbajal, A. Moncho-Jord´a, and G. Odrio- zola, J. Chem. Phys.138, 064501 (2013).
[50] S. Varga, Y. Mart´ınez-Rat´on, E. Velasco, G. Bautista- Carbajal, and G. Odriozola, Phys. Chem. Chem. Phys.
18, 4547 (2016).
[51] G. Bautista-Carbajal, P. Gurin, S. Varga, and G. Odrio- zola, Sci. Rep.8, 8886 (2018).
[52] C. Vega and S. Lago, Comput. Chem. , 55 (1994).
[53] E. Basurto, C. Haro-P´erez, C. Vargas, and G. Odriozola, Phys. Chem. Chem. Phys.20, 27490 (2018).
[54] K. Huang,Statistical Mechanics(Wiley, New York, 1963).
[55] M. Gonz´alez-Pinto, F. Borondo, Y. Mart´ınez-Rat´on, and E. Velasco, Soft Matter13, 2571 (2017).