Surprise event detection of the supercomputer execution queues ∗
Zoltán Gál
a, Tibor Tajti
b, György Terdik
aaUniversity of Debrecen, Debrecen, Hungary zgal@unideb.hu,terdik.gyorgy@inf.unideb.hu
bEszterházy Károly College, Eger, Hungary tajti@aries.ektf.hu
Submitted September 14, 2014 — Accepted February 10, 2015
Abstract
Huge amount of data is generated by and collected from the IoT (Inter- net of Things) physical and virtual devices. These sets of data series ref- lect in complex form the state of a given system in multidimensional space.
Healthiness evaluation of a given system implies state analysis with enhanced methods. Special events can appear during the execution of jobs in a su- percomputer (HPC – High Performance Computer) system. Depending on the HPC architecture hundreds or even thousands of computation nodes are working in parallel. The scheduler of the HPC front-end node manages dif- ferent queues (parallel, serial, test, etc.) of the job execution. The multitude of data series captured periodically with several tens of thousands of sam- ples creates a set of several dozen variables for each computation node. The healthiness of the whole HPC system is a temporal concept in the term of 2D or 4D multidimensional time-space domains. In this paper we propose a healthiness evaluation method for each execution queue of two different HPC system with 20 TFLOP/s and 5 TFLOP/s computation capacities, respec- tively. Time independent community structure is determined and controlled based on multiple similarity measures and ANN (Artificial Neural Network) based SOM (Self-Organized Map) algorithm. For each cluster of variables is
∗This work was partially supported by the TÁMOP-4.2.2.C-11/1/KONV-2012-0001 (FIRST – Future Internet Research, Services and Technology) project. This project has been supported by the European Union, co-financed by the European Social Fund. This work was also partially supported by the European Union and the European Social Fund through project Supercomputer, the national virtual lab (grant no.: TAMOP-4.2.2.C-11/1/KONV-2012-0010).
http://ami.ektf.hu
87
determined a representing variable, including time specific and global char- acteristics of the own cluster. The resulting set of representing variables contains less than ten dissimilar time series. Wavelet methods are used for extreme event detection in time of each representing variable. The surprise event detection in time of the HPC execution queues is based on the simul- taneity of extreme events’ fingerprints.
Keywords: High Performance Computer, Sensors/actuators, IoT, Complex Event Processing, Event Stream Processing, SOM, FFT, STFT, Wavelets, Artificial Neural Networks
MSC:91A28, 65C60, 60G35
1. Introduction
The Internet of Things (IoT) contains sensor and actuator devices connected by special network technologies providing services for different fields of the Information Society [1]. Classical network applications are extended establishing new, intelli- gent services based on the data generated by these devices. Conform to the current IoT conception of the European Union any usage of the IoT includes one of the following five areas: smart cities, smart energy, smart health, smart manufacturing and smart transport. The Machine-to-Machine (M2M) communication technology becomes more and more important in this aspect and creates huge amount of data every day. The sensor data has origin of different small physical or logical objects.
These sensor objects are sampled periodically to capture the values or can force self-transmission of extra values asynchronously in case of special event occurrences.
The definition of special event term depends on the programmed threshold value of a given variable. The usability of the generated data depends on the type of measured variable. In some cases all the captured data should be archived (i.e.
health or finance system monitoring) for offline processing possibility, but for the real time applications (i.e. process controlling) only the online filtered information has serviceable character. In any cases we are facing with the big data paradigm [2]. Efficient compressing and filtering algorithms are needed to process the data produced by the IoT. The online filtering and compressing mechanisms in IoT environment should take in consideration the energy usage, as well. The relation among the faithful of the data, the energy consumption of the sensor network and the capturing delay of the data is not trivial. Having complex aspects that need to be taken in consideration, lot of work is invested to find the optimal solution to this problem.
In this paper we are focusing on the data reduction mechanisms to decrease the amount of data captured from high number of sensor nodes with huge number of variables and significantly stored at the sink node of the sensor network. Two different architecture supercomputer systems are analysed to detect the surprise events during the execution time. In chapter 2 we present related work to the data clusterization methods and the surprise event detection based on wavelets. The measurement scenario in Massive Parallel Processing (MPP) and cluster architec-
ture High Performance Computer (HPC) systems with different job schedulers will be given in chapter 3. The mechanisms discussed previously will be applied, com- paring the two HPC architectures. Chapter 4 concludes the analysis and gives possible continuation of the work.
2. Related work
One of the IoT benefit is the detection possibility of the actual events in the real world. A multitude of physical and logical sensors generate data about the analysed complex system and can be real-time analysed by the evaluation server [3]. Special events of a whole or a part of the system can happen in any interval of the execution time. Having several hundred or thousands of controllers with tens of variables each, makes necessary identification of the essential status variables. This reduction of the variables makes possible online identification of the special status events of the analysed system. Without the reduction of the number of variables huge computation capacity is reclaimed making very expensive the analysing hardware and software tool. The overall goal of the surprise event detection is to identify online the anomalies of the analysed system with minimum amount of computation capacity. The essence of three methods are presented shortly in this chapter because in the research work of surprise event detection these methods are not familiar, yet.
2.1. SOM clustering algorithm
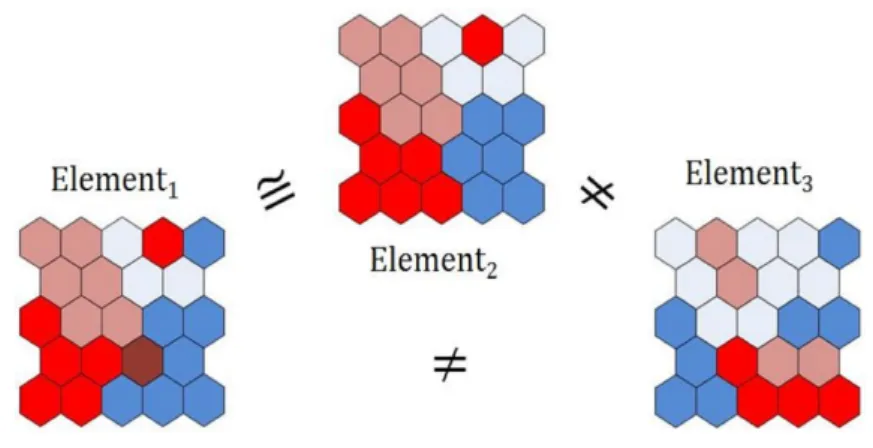
Self-organizing map (SOM) is an Artificial Neural Network (ANN) based method to create two-dimensional picture where correlated elements are placed in physical vicinity [6]. This method allows a set of high-dimensional data to be represented on a single topographic map. The method has two phases (training, mapping) and four components (initialization, competition, cooperation, adaptation). In the training phase after a random initialization a vector quantization is executed by competition. In the mapping phase the new input vector is classified. Each element gets associated a weight vector with diameter equal to the number of elements and is placed on the map near to the elements with closest distance metric.
Two elements are considered to belong to the same cluster if their weight vectors are similar. To be more suggestive the weight vector itself is represented on two dimensional patterns with colored hexagon object for each weight. On Figure 1 the upper and the left hand patterns are similar, but they are dissimilar to the right hand side pattern. This is why Element1andElement2belong to the same cluster, butElement3 does not.
2.2. DBSCAN clustering algorithm
Because of the high amount of captured data with only a small percentage of usable information, efficient clustering of the variables is proposed for special event detec- tion of such systems [4], [5]. The clustering algorithm DBSCAN (Density-Based
Figure 1: Cluster creation by SOM
Spatial Clustering of Applications with Noise) is the most cited one, it is efficient method to identify data clusters. It uses just two parameters: EPS, MIN_EL.
EPS stands for the radius of the vicinity of a given element, and MIN_EL gives the minimum number of elements forming a cluster. If a number of MIN_EL ele- ments are in a region of diameter EPS, then a cluster is started. If a given element does not belong to any cluster, then it is considered noise and remains alone.
Figure 2: Cluster creation by SOM
This algorithm evaluates each element as cluster candidate and test the ad- herence to the existing clusters. The complexity of the algorithm for n elements is O[n log(n)] and the necessary memory capacity is O(n). The cluster elements can be shaped arbitrarily. Having notion of noise element makes this algorithm robust. As a disadvantage is that the border elements of a given cluster can take part in multiple clusters. The cluster creation depends on the distance measure
applied. Euclidian measure is used for scalar elements. For high-dimensional data other distance measures (cosine similarity, Sorensen-Dice coefficient, parametrized correlation index, Hamming distance, Jaccard index, Tanimoto similarity) can be used. For D-dimensional data the estimation of parameter MIN_EL is given by the following formula:
M IN_EL≥D+ 1
Best value for parameter EPS is the maximum value that influence mostly the number of created clusters. If EPS is too small, then lot of noise elements will remain. If EPS is too large, then the majority of elements will belong to the same cluster. In Figure 2 three elements in the upper right corner can be included into a 2D sphere with 2xEPS diameter, but they do not form a cluster because the minimum number of elements in this case MIN_EL = 4. Enhanced variant of this algorithm is the generalized DBSCAN (GDBSCAN) where the values of the parameters are determined by the algorithm itself [5].
2.3. Special event detection by CWT
Fourier Transform (FT) is a useful tool for detecting global characteristics of a time series using spectral analysis. Identification in time of a given event is not possible by the FT or Fast Fourier Transform (FFT). Short-Time Fourier Transform (STFT) and Wavelet Transform (WT) makes possible to detect special events in time by the time-frequency representation of the analysed data series. Continuous Wavelet Transform (CWT) divides the continuous time into small waves named wavelets.
A wavelet grows and decays in a limited time period. A detailed overview of the CWT can be found in [8] and [9]. Letf(t)be a periodically sampled signal. The continuous wavelet coefficientsCa,bof the signalf(t)and waveletψa,b(t)are given by:
Ca,b(f(t), ψa,b(t)) = Z∞
−∞
f(t)ψa,b(t)dt= Z∞
−∞
f(t) 1
√aψ t−b
a
dt,
where a is the scaling parameter,b is the time shifting parameter and ψ(t) is a mother wavelet function (i.e. Haar, Daubechies, Symlet, Coiflet, etc.). Any mother waveletψ(t)is square integrable function with the following properties:
Z∞
−∞
ψ(t)dt= 0, and Z∞
−∞
ψ2(t)dt= 1.
An abrupt transition in signal produce large absolute values of the wavelet co- efficients Ca,b. Wavelet coefficients Ca,b localize the discontinuity best at small scales. The singularity of the original signalf(t)only affects a small set of wavelet coefficientsCa,b.
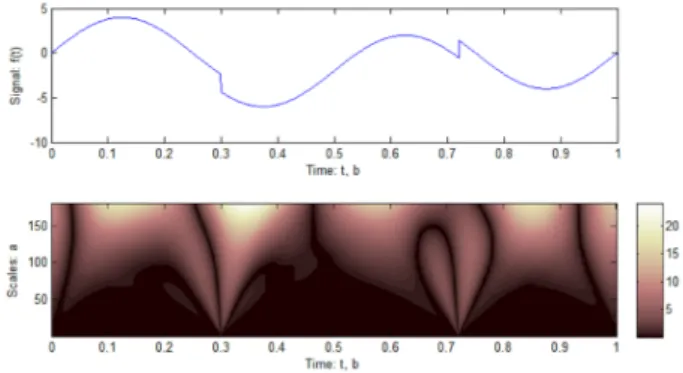
On Figure 3, top part signalf(t)can be seen being a discontinued function by shifting modification att1= 0.3andt2= 0.7 of the functiong(t) = 4sin(4πt).
Figure 3: Special event identification by CWT
The bottom part of the figure shows the effects of this discontinuity on the CWT diagram. If periodicity exists in scaling dimension, then the original signal has fractal property [8].
3. Measurement scenario and analysis
The methods presented in the previous section were applied to analyse two dif- ferent supercomputer (HPC) systems. The artificially cognitive capability of the dedicated sensor subsystem placed in HPC system measures different states of the compute nodes and transmits these values to the interpretation and processing machine [10]. There were captured state variables of the both HPC systems in production utilized by several hundred of users.
The detailed description and evaluation of the Massive Parallel Processing (MPP) architecture system is well presented in [11] and [12]. The second HPC architecture was cluster based with 32 compute nodes. The computation capacity of these two systems is 20 TFLOP/s (MPP) and 5 TFLOP/s (cluster), respectively.
The MPP system was running SGE (Sun Grid Engine) job scheduler and the cluster system was scheduled by the open-source software SLURM (Simple Linux Utility for Resource Management).
SGE operates with three separated job queues but SLURM has only one queue.
The number of captured variables differs only at the memory modules temperatures because the cluster HPC system has more RAM for each compute node. Each MPP CN has six RAM DIMMs, which number is sixteen at the cluster CN. The epoch time isT = 10sec for both systems but the number of epochs was different because of the different continuous working times: NM P P = 55,341; Ncluster = 37,884.
The measurement time intervals were 6.4 days and4.4days, respectively.
Both HPC systems were running hundreds of jobs and other high number of jobs was waiting in the queue during the measurement. HPC systems have a given set of variables able to be captured by a dedicated controller based subsystem.
In our case this hardware and software tool was Ganglia [11], [12]. The captured
MPP HPC Cluster HPC
No. of Compute Nodes (CN) 128 32
No. of CPUs/CN 2 2
No. of Cores/CPU 6 12
RAM/CN 48 GB 64 GB
Job Scheduler SGE SLURM
Functional Queues SERIAL, PARALLEL, TEST 1 Table 1: Physical characteristics of the analysed HPC systems
variables are produced by to two types of sensors. Logical sensors (see Table 2.) measure capacity while physical sensors (see Table 3.) measure energy usage of the analysed systems. These variables are given by the Ganglia capturing tool depending on the HPC architecture type. Applying ANN based SOM algorithms it was found that for MPP system seven clusters can be created.
MPP and System Variable Meaning
1. Load_one Reported system load, averaged over one minute 2. Load_five Reported system load, averaged over five minute 3. Proc_run Number of running processes
4. Proc_total Number of total processes
5. Pkts_in Number of packets read from all non-loopback inter- faces
6. Pkts_out Number of packets written to all non-loopback inter- faces
7. Bytes_in Number of bytes read from all non-loopback interfaces 8. Bytes_out Number of bytes written to all non-loopback interfaces
9. Mem_free Memory free capacity
10. CPU_user Percentage of CPU cycles spent in user mode 11. CPU_system Percentage of CPU cycles spent in non-user mode
Table 2: Captured HPC logical variables by the Ganglia tool
Each cluster has representing variable including special characteristics of the represented group of variables. The same result was obtained with the DBSCAN algorithm, as well.
The seven variable clusters are: A(1,. . . , 4), B(5,. . . , 8), C(9), D(10), E(11), F(12,. . . , 14), G(15,. . . , 20), where the numbers are representing the index of the variables [12]. For cluster architecture having only one job queue the number of clusters is nine (see Figure 4): A(1,. . . , 3), B(4), C(5,. . . , 8), D(9), E(10), F(11), G(12), H(13,. . . , 14,29,. . . , 30), I(15,. . . , 28). This result shows that for the detection of extreme events of the HPC system the number of variables captured can be decreased by∼70%even the variable clusters of the two HPC architectures is different.
From the faithfulness point of view can be determined three different classes of
MPP System Variable Cluster System Variable Meaning
12. System_Temp Server temperature [0C] Server tempera- ture [0C]
13. CPU1_Temp CPU1 temperature CPU1 tempera-
ture
14. CPU2_Temp CPU2 temperature CPU2 tempera-
ture 15. P1_DIMM1A_ Temp Memory modules tempera-
ture Memory modules
temperaturel 17. P1_DIMM3A_ Temp Memory modules tempera-
ture Memory modules
temperature 18. P2_DIMM1A_ Temp Memory modules tempera-
ture Memory modules
temperature 20. P2_DIMM3A_ Temp Memory modules tempera-
ture Memory modules
temperature Table 3: Captured HPC physical variables by the Ganglia tool
variables: a) Faithful variables are forming strong clusters for both architectures (i.e. 1. Load_one, 2. Load_five, 3. Proc_run or 5. Pkts_in, 6. Pkts_out, 7. Bytes_in, 8. Bytes_out); b) Migrant variables are shifting from one vari- able cluster to other when the HPC architecture changes (i.e. 13. CPU1_Temp, 14. CPU2_Temp); c) Isolating variables remain alone independently of the HPC architecture type (i.e. 4. Proc_total, 9. Mem_free, 10. CPU_user, 12. Sys- tem_Temp).
Faithful variables form clusters with relatively high number of participants.
This property reduces significantly the necessary sampled variables for extreme event detection task. The class of migrant variables contains only reduced number of candidates and characterizes the difference between the two HPC architectures.
The isolating variables do not depend on the HPC architecture and are strong characterizing elements of the HPC execution state. Using CWT it was found that the different class of variables has different wavelet transform.
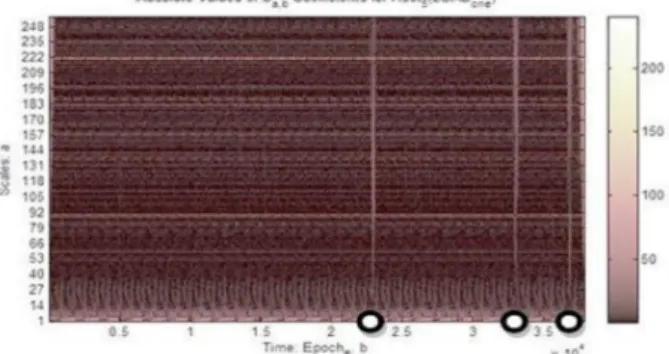
On Figure 5 can be seen that there were three short time intervals for variable 1.
Load_one at the CN5 with significant changes. The same three time intervals can be seen on Figure 6 for variable 4. Mem_free of the same node. In these moments the cluster architecture HPC had surprise event detected by the CWT. The signif- icant changes of the two different variables are detected in this way. Coincidence of several variable changes can be detected by the CWT in the same manner.
Even different classes of variable have different CWT, extreme events are de- tected by every variable cluster because the fingerprint of the surprise events (ver- tical lines on the CWT maps for different isolating variables) matches. In our case these surprise events appeared at around three epoch numbers: b1= 2.3×10⁶, b2= 3.3×10⁶, b3= 3.6×10⁶.
Figure 4: SOM maps for Cluster architecture HPC, CN5
Figure 5: CWT of Cluster architecture HPC, variableCN5,1.Load_one
Figure 6: CWT of Cluster architecture HPC, variableCN5,4:M em_f ree
4. Conclusions
SOM and DBSCAN are useful methods to create variable clusters of the data sampled from sensor networks. This clusterization of the variables reduces the analysed amount of data with∼70%. By analysing variables of MPP and cluster based HPC systems three classes of variables are proposed: faithful, migrant and isolating one. Each class has special role in the minimizing method of the number of HPC state variables necessary to detect special events. Even several jobs were waiting for the execution with SGE scheduler some of the hardware resources were out of work. The occurrence of surprise events at the HPC system execution can be detected by the constant wavelet transform (CWT) of a representive element of the variable clusters. Further analysis needs to find the exact characteristics of the variable classes proposed.
References
[1] Vermesan, O., Friess, P., Internet of Things – Converging Technologies for Smart Environments and Integrated Ecosystems,River Publishers, 2013.
[2] Smith, J. G.,Vermesan, O., Friess, P. Furness, A., The Internet of Things 2012: New Horizons,Halifax Publisher, ISBN: 978-0-9553707-9-3, 2012.
[3] Jain, A. K., Murty, M. N., Flynn, P. J. , Data Clustering: A Review,ACM Computing Surveys, 31 (3), 264-323, 1999.
[4] Ester, M., Kriegel, H.-P., A density-based algorithm for discovering clusters in large spatial databases with noise,Proceedings of the Second International Conference on Knowledge Discovery and Data Mining, AAAI Press. 226–231. ISBN 1-57735-004- 9., 1996
[5] JIANG, D., Pei, J., Zhang, A.,DHC: A Density-Based Hierarchical Clustering Method for Time Series Gene Expression Data,BIBE, 393-400, 2003
[6] Kohonen, T., Self-organized formation of topologically correct feature maps, Springer-Verlag, Biological Cybernetics, Volume 43, Issue 1 , 59-69, 1982
[7] Mallat, S., G., A theory for multiresolution signal decomposition: the wavelet representation,IEEE Transactions on Pattern Recognition and Machine Intelligence, 11 (7): 674–693, 1989.
[8] Percival, D., B., Walden, A. T., Cambridge Series in Statistical and Probabilis- tic Mathematics: Wavelet Methods for Time Series Analysis,Cambridge University Press, 2006.
[9] Sadek, S. A., Michaelis, A. B., Sayed, U.,A statistical framework for real- time traffic accident recognition,Journal of Signal and Information Processing, Vol.
1, 70–81, 2010.
[10] Special Issue on Cognitive Infocommunications,Journal of Advanced Computational Intelligence and Intelligent Informatics, (2012) 16: 2.
[11] Terdik, Gy., Gal, Z. ,Advances and practice in Internet of Things: A case study, Proceedings of 4th IEEE International Conference on Cognitive Infocommunications
(CogInfoCom 2013), Budapest, Hungary, December 2-5, 2013, ISBN: 978-1-4799- 1544-6, 435-440.
[12] Gal, Z., Tajti, T., Complex Event Processing in Supercomputer Environment:
Sensor and Neural Network Based Analysis, Proceedings of IEEE 4th International Conference on Cognitive Infocommunications (CogInfoCom 2013), Budapest, Hun- gary, December 2-5, 2013, ISBN: 978-1-4799-1544-6, 735-740.