Infrared neural stimulation and inhibition using an implantable silicon photonic microdevice
Á.Cs. Horváth1,2,3, S. Borbély4,5, Ö.C. Boros6, L. Komáromi6, P. Koppa6, P.Barthó4, Z. Fekete1,2
1 Research Group for Implantable Microsystems, Faculty of Information Technology & Bionics, Pázmány Péter Catholic University, Budapest, Hungary
2 Microsystems Laboratory, Institute for Technical Physics & Material Science, Centre for Energy Research, Hungarian Academy of Science, Budapest, Hungary
3 Óbuda University Doctoral School on Materials Sciences and Technologies, Budapest, Hungary
4 MTA TTK NAP Sleep Oscillations Research Group, Budapest, Hungary
5 Department of Physiology and Neurobiology, Eötvös Loránd University, Budapest, Hungary
6 Department of Atomic Physics, Budapest University of Technology & Economics, Budapest, Hungary
Abstract
Brain is one of the most temperature sensitive organs. Besides the fundamental role of temperature in cellular metabolism, thermal response of neuronal populations is also significant during the evolution of various neurodegenerative diseases. As such critical environmental factor, thorough mapping of cellular response to variations in temperature is desired in the living brain. So far, limited efforts have been made to create complex devices that are able to modulate temperature, and concurrently record multiple features of the stimulated region. In our work, the in vivo application of a multimodal photonic neural probe is demonstrated. Optical, thermal and electrophysiological functions are monolithically integrated in a single device. The system facilitates spatial and temporal control of temperature distribution at high precision in the deep brain tissue through an embedded infrared waveguide, while it provides recording of the artefact-free electrical response of individual cells at multiple locations along the probe shaft. Spatial distribution of the optically induced temperature changes is evaluated through in vitro measurements and a validated multi- physical model. The operation of the multimodal microdevice is demonstrated in the rat neocortex and in the hippocampus to increase or suppress firing rate of stimulated neurons in a reversible manner using continuous wave infrared light (λ = 1550 nm). Our approach is envisioned to be a promising candidate as an advanced experimental toolset to reveal
thermally evoked responses in the deep neural tissue.
1. Introduction
Temperature is undoubtedly an important factor in physiological processes1. The clinical relevance of its effect on several diseases has been recognized, however, we still have a limited knowledge on the spatial and temporal distribution and fluctuation of temperature, and its role in brain homeostasis. Besides the inherent thermal fluctuation in the brain, diagnostic and therapeutic tools may also introduce thermal changes in the tissue. Novel optical stimulation methods like optogenetics or semi-invasive imaging techniques relying on multi-photon excitation are hypothesized to cause significant heating of large volume of brain tissue during continuous illumination, increasing local temperatures by several °C2, 3. Other groups have drawn our attention to the fact that related models often underestimate in vivo temperature rise during stimulation4,5. During electric stimulation of the spinal cord6 or stimulation with low-frequency magnetic field7 tissue heating is proposed to take into account when evoked responses are considered. Besides imaging artefacts of thermal origin, stimulation techniques relying on thermal intervention are also under intensive research, including infrared neural stimulation. Infrared neural stimulation (INS) uses pulsed infrared light (between the wavelength of 1400-2100 nm) to generate highly controlled temperature transients in neurons (dT/dz or dT/dt), leading them to fire action potentials8,9,10. The main advantage of INS is that it can be applied to neural tissue without prior genetic incorporation of light sensitive opsins thereby offering greater ease and flexibility of use8. In recent years, several applications of INS were published. It was shown that INS can alter GABAergic neurotransmission11, pace rabbit hearts12, activate specific regions in the brain (such as the visual cortex)9, and INS of auditory neurons was also presented13. Besides the excitatory effects of infrared light, inhibitory effects have been discovered by Duke et al, who has demonstrated the suppression of neural activity in sciatic nerve fibres of a rat14. While the activation mechanism of INS relies on the spatiotemporal gradient of temperature, blocking of action potential propagation is supposed to be a function of an increase in baseline temperature15. Laser induced inhibition is hypothesized to be caused by the non-uniform rate increases in temperature-dependent Hodgkin-Huxley gating mechanism leading to reversible block of action potential generation16. The advantage of infrared neural inhibition (INI) compared to INS is that it requires significantly lower radiant exposure17, which is beneficial for the development of portable devices dedicated to investigations in behaving subjects.
However, early results are promising, in vivo demonstration on intracortical or hippocampal
targets has not been presented. The above studies focusing on both neurophysiology and neuroengineering confirm, that there is still room for further investigation of temperature dependence as an experimental factor in vivo.
To gain more systematic information in this respect, multifunctional tools are desired, which provide parallel thermal stimulation and recording all integrated in microdevices of limited dimensions18. Optical stimulation microdevices or briefly optrodes, mostly dedicated to optogenetic manipulation, may provide alternative solutions to provoke thermal changes. An early hybrid system combining silicon microprobes with optical fibers has been proposed by Royer et al.19. Fabrication of integrated dielectric waveguides has been also utilized on top of implantable microelectrodes20, 21, 22, 23. Besides passive optical components, the integration of light sources like laser diode die chips also offers new perspectives24. Probes holding addressable microLED arrays on the shaft have been also tested for in vivo use25, 26, 27. The operation of these devices are limited to the visible wavelength regime, however, near-infrared applications are also gaining attention. Configurations of end-fire waveguide arrays28, Utah arrays29, and Michigan-type microprobes30 have been proposed to deliver infrared light through embedded passive waveguides, but in vivo demonstration has not supported their safe and efficient operation. In this work, we demonstrate the in vivo use of an implantable multifunctional microsystem, which is able to deliver infrared light and concurrently measure cellular activity in the deep neural tissue. The safe application of the proposed technique is established by systematic optical, thermal and electrochemical characterization, which provides valuable input to introduce the device into customized experiments. To our knowledge, this is the first integrated microdevice used to perform deep tissue neuromodulation with infrared light and simultaneously measures the evoked changes in firing characteristics of neurons.
2. Results
2.1 Design of integrated microdevice for thermal modulation of neural activity
Our approach to investigate thermal modulation of neural activity relies on a multifunctional probe design, which provides stimulation and measurement functions simultaneously. This advanced microsystem is manufactured from single-crystalline silicon, and comprises integrated photonic and electrical components. The configuration is shown in
Figure 1.a. The probe holding an embedded waveguide is connected to an optical fiber delivering infrared light (λ = 1550 nm) from a pig-tailed laser diode (max. power: 70 mW). The 5 mm long, 170 µm wide and 190 µm thick shaft of a silicon probe acts as an optical waveguide and carries conductive and insulating thin film layers that forms wiring and sites for recording neuronal action potentials and changes in tissue temperature. The transmission of infrared light is facilitated by a wet chemical nanomachining process detailed in our prior work31. The resulting surface roughness of the silicon shaft makes low-loss delivery of infrared light into the tissue (see Figure 1.d). The coupling of infrared (IR) light from an external light source (e.g. laser diodes) is guided through integrated microstructures. The IR radiation exits the shaft at the tip, and is eventually absorbed in the tissue. The average overall efficiency of the microoptical system delivering the infrared light at chip-scale is measured as 32.04 ± 4.10 %, while the max. efficiency in packaged form is 41.5 ± 3.29 %30. The average beam spot size at the probe tip is 0.024 ± 0.006 mm2.The absorbed energy is converted to heat, which can be measured using integrated platinum temperature sensor during device operation to maintain stable temperature in the vicinity of the modulated population of neurons. The evoked neuronal response like action potentials can be monitored through embedded platinum recording sites located close to the end facet of the waveguide (see Figure 1.b). The chip device is mounted on a custom printed circuit board, which provides stable connections to electrical and optical sockets (see Figure 1.c). More details on micro- and nanofabrication and results on the optical characteristics (like beam characteristics, optical profile) of the system can be found in our prior work30. The overview of the microfabrication steps is shown in Figure S1. The validated optical model of the microsystem has been also published by our group32. In the current work, thermal characterization and in vivo validation of the device is presented. The optical efficiency of the device presented in this paper is 24.2 ± 6.9 % (n = 5). The sensitivity of the integrated temperature sensor is TCR=2636 ± 75 ppm/K (n =5). The electrochemical characteristics of the recording sites are shown in Figure 1.e & f. Beyond the preparation steps of the device already presented in our prior work30, the impedance of the recording sites is further reduced by depositing porous platinum on the sputtered platinum surfaces. This extra electrochemical process reduces the initial impedance value at 1 kHz decreased from 678 ± 198 kΩ to 46 ± 9 kΩ (n = 4). Deposition method is described in the Electrochemical characterization section.
Figure 1. (a) Components of the implantable microsystem. 1: Si substrate, 2: multimode optical fiber, 3: cylindrical coupling lens, 4: shaft with multiple functionality, 5: probe tip. Figure is not to scale. (b) Optical microscopy image of the optrode tip. (Scale bar shows 300 µm) (c) Photo of an assembled optrode device. Scale bar of the picture with small and larger magnification are 3 cm and 5 mm, respectively. (d) Scanning electron micrograph representing the surface quality of the optrode tip. (Scale bar shows 100 µm) (e) & (f): Amplitude and phase diagrams of the impedance of the electrophysiological recording sites, respectively.
2.2 Distribution of temperature in continuous mode control
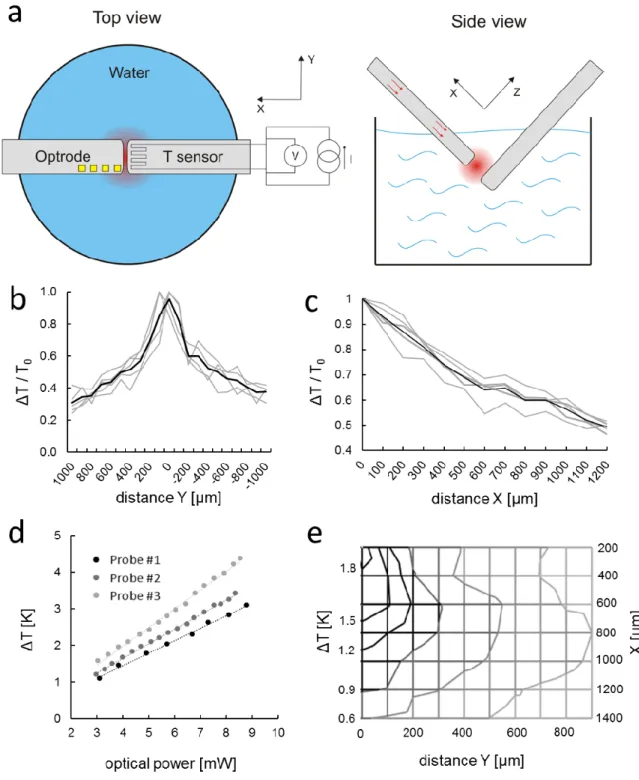
For the safe use of the proposed technique, it is essential to determine the spatial distribution of temperature around the probe tip, precisely. An in vitro experimental setup is prepared (schematic in Figure 2.a), where the optrode under investigation is immersed in water, and temperature in the surrounding medium is monitored through a calibrated external platinum temperature sensor. The setup allowed the positioning of the external temperature sensor with respect to the optrode along multiple axis. These data provide valuable information on the decay of heat energy accumulated during the absorption of infrared radiation in the wet medium (Figure 2.b & c). The full width at half maximum of the distribution of local radiant heating is 1020 ± 184 µm along the y axis (x=200 µm) perpendicular to the shaft. More experimental details can be found in the Methods section. Reconstruction of a 2D distribution of a particular probe is shown in Figure 2.e.
Before in vivo experiments, a calibration procedure was performed to determine diode specific operational characteristics (see optical power vs operating current in Figure S2) and rise in temperature as a function of optical power (see Figure 2.d). These curves were considered during the design of each animal experiment. To check the reliability of the integrated temperature sensor, the relationship between integrated and external temperature sensor (at location x(y=0) = 200 µm) was measured (Figure S3a) and calibrated through a fiber-optic temperature sensor (Figure S3b) to ensure the proper interpretation of the data on temperature. It was found that the external measurement gives a higher estimation of temperature than the integrated sensor by 24 ± 6 %, so we rescaled our measured data in further in vivo use. Since the probe can be mounted with optical fibers of various core diameter, the effect of core diameter on temperature distribution was also checked along the y axis (Figure S4). There is a slight change in the shape of the distribution, which may be attributed to the change in the beam shape. More details on the effect of fiber core diameter and beam shape on the optical output can be found in our prior work33.
Figure 2. (a) Schematics of the in vitro experimental setup for the characterization of spatial temperature distribution. (b) Normalized distribution of the temperature increase along the y axis (x=200 µm). (c) Relative rise in temperature as a function of distance between the tips of the immersed optrode and the external temperature sensor. (d) Calibration curves: optical power vs. rise in temperature. (e) 2D representation of the distribution of temperature rise along two perpendicular axes x and y. The location of the probe tip is considered the origin of the coordinate system.
2.3 Thermal modulation of spiking activity
Experiments in rat subjects were performed to test electrode functionalities and to interrogate evoked responses to infrared neuromodulation in the cortex and in the hippocampus. Figure S6 shows the experimental arrangement of surgery using two implanted devices: our multimodal device and a laminar silicon probe as control for the validation of recorded data. In our stimulation protocols comprising 2 mins ON and 4 mins OFF periods, the change of spiking activity of neurons in the vicinity of the irradiated regions was evaluated using various optical powers at a wavelength of 1550 nm. At least ten trials per optical power in a randomized fashion were recorded to determine the characteristic changes in neuronal firing pattern. In the raw data, no visible artefact due to stimulus onset was detected (Figure 3a, 4a, 5a). To validate our coupled optical-thermal model, concurrent measurement of tissue temperature was also carried out with the integrated temperature sensor at various optical powers (see Figure S12). Action potential waveforms were not affected by the stimulation, even after several hours (Figure 3b, 4b, 5b), indicating the lack of neural damage. The spatial distribution and temporal dynamics of the rise in temperature induced by the infrared irradiation at the location of single unit recording were estimated by the multi-physical model.
Related data was visualized for each experimental arrangement (see Methods section). Figure 3-5 summarize our findings for cortical excitation, cortical inhibition and hippocampal excitation, respectively.
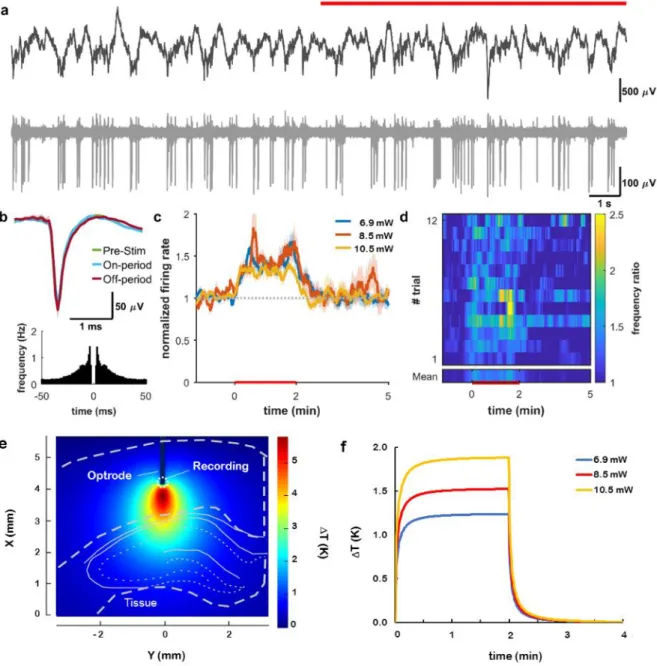
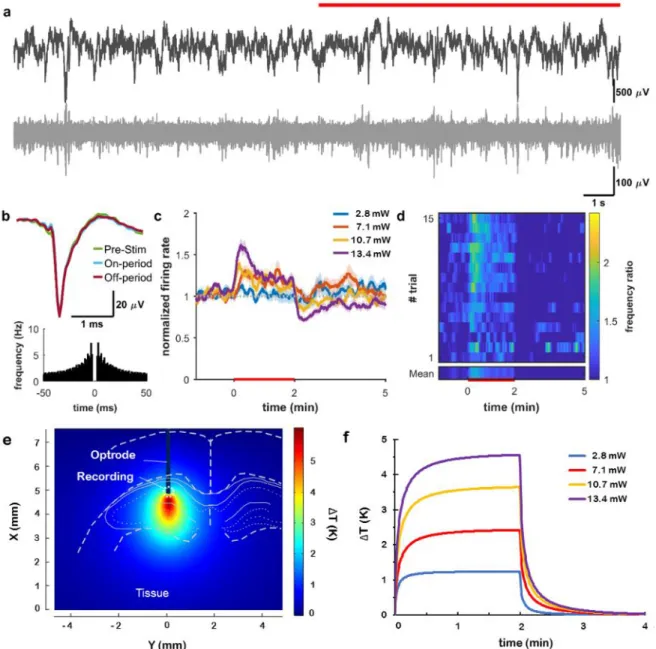
Cortical multiunit activity at 1300 m showed a significant increase at all optical power values (p<0.01 for 6.9, 8.5, 10.5 mW, Figure 3cd). Multiunit activity at 1600 m, however, was suppressed throughout the stimulus at high optical power (p < 0.01 for 6.9, 8.5, 10.5 mW, Figure 4 cd). A similar protocol in the hippocampal CA1 pyramidal layer caused an increase in multiunit activity at high power stimuli (p<0.01 for 2.8, 7.1, 10.7, 13.4 mW, Figure 5 cd).
Figure S9 contains representative data on the change in body (rectal) temperature during the stimulus sequences, which also supports our claim that no global changes are in correlation with the local rise in brain temperature during the course of experiments.
Figure 3. Infrared excitation of cortical neurons. (A) Local field potential (top) and unit activity (bottom) at 1300 m cortical depth recorded from the multimodal probe before and during (red line) heating. (B) Waveform and auto-correlogram of a single unit clustered from the recording site on (A). The spike waveform does not change between the pre-stimulus, stimulus-on, and stimulus-off periods. (C) Changes in firing rate of cortical multiunit for various excitation powers. (D) Average spike rate difference across trials (heat map). (E) Simulated temperature distribution during stimulus onset around the excited region at 10.5 mW and (F) simulated temporal change of temperature in the vicinity of the integrated temperature sensor of the optrode in the case of all applied optical power in this experiment.
Figure 4. Infrared inhibition of cortical neurons. (a) Local field potential (top) and unit activity (bottom) recorded from the 16-channel silicon probe at 1600 m cortical depth before and during (red line) heating. (b) Waveform and auto-correlogram of a single unit clustered from the recording site on (a). The spike waveform does not change between the pre-stimulus, stimulus-on, and stimulus-off periods. (c) Changes in firing rate of cortical multiunit for various excitation powers. (d) Average spike rate difference across trials (heat map). (e) Simulated temperature distribution during stimulus onset around the excited region at 10.5 mW and (f) simulated temporal change of temperature in the vicinity of the integrated temperature sensor of the optrode in the case of all applied optical power in this experiment.
Figure 5. Infrared excitation of hippocampal neurons. (a) Local field potential (top) and unit activity (bottom) recorded from the multimodal probe before and during (red line) heating. (b) Waveform and auto-correlogram of a single unit clustered from the recording site on (A). The spike waveform does not change between the pre-stimulus, stimulus-on, and stimulus-off periods. (c) Changes in firing rate of cortical multiunit for various excitation powers. (d) Average spike rate difference across trials (heat map). (e) Simulated temperature distribution during stimulus onset around the excited region at 13.4 mW optical power and (f) simulated temporal change of temperature in the vicinity of the integrated temperature sensor of the optrode in the case of all applied optical power in this experiment.
3. Discussion
It is well established that temperature has influence on several neurophysiological properties including resting potential, action potential and synaptic transmission34. In view of the efficiency of cellular metabolism, the overall thermal impact on cell population is apparent.
Approximately, 40 % of the energy produced during oxidative metabolism is used to convert glucose to ATP in the brain, while 60 % is dissipated as heat35. This metabolic activity is still high in resting states. Metabolism through the blood-brain barrier is also intensified through larger permeability in response to temperature increase36. The advances in brain diagnostics helped us to recognize that pathological hyperthermia is a modulatory factor in brain disorders37. As a result, hypothermia has been proposed as a therapeutic tool to limit neuronal injury in neurodegenerative diseases. The efficiency of hypothermia has been proven in cases of ischemia38, epilepsy39 and traumatic brain injury40. Underlying processes are intensively researched at various level of organization in the brain. At the synapse level, Brownian motion governs the diffusion of molecules (like neurotransmitters and calcium ions) and has potential effect on the motion of proteins within the membrane or the cytoplasm41. Horvath et al revealed first that synaptic transmission is also sensitive to heat in the homeostatic center of the brain42. Their results received gradually increasing attention as TRP channels have been discovered, and have given evidence to the modulatory effect of temperature in cellular communication43. Some of these thermally activated receptors are active at normal physiological temperature as well44. At the cellular level, response to elevated temperature may change the excitability of cells, which is substantiated by the occurrence of spontaneous action potentials and increased spontaneous synaptic activity45. This cellular response can be definitely characterized using implantables, dedicated to (1) induce thermal changes in a spatially confined manner and (2) record brain signals in a single cell level. In our work, characterization and in vivo validation of such an implantable photonic microdevice was demonstrated.
Description of spatial distribution of temperature induced by infrared excitation will definitely provide guidelines for future in vivo use. Optical-thermal models validated in real experiments will also definitely help the evaluation of more complex experiments focusing on the evoked response of several brain regions to locally controlled thermal changes. Our results confirmed that, changes in the spike rate of both cortical and hippocampal neurons using our integrated approach are reversible, and there is no influence on either waveforms of individual neurons, oscillatory activity or body temperature. This means that the effective cross-section of our stimulation procedure is small enough to avoid direct global changes in physiological mechanisms.
Our primary aim was to test concurrent infrared stimulation and electrical recording in the deep neural tissue. Our study is the first in vivo test with such photonic device. Similar work in the literature has demonstrated Utah configuration for addressing intracortical IR stimulation, however, the authors have not proved in vivo performance29. Regarding the quality of neural signals recorded with our probe and the reference laminar probe, we found that no photoartefacts induced by IR stimulation can be detected during signal acquisition. This is especially important in view of the well-known Becquerel effect deteriorating electrical signals during optogenetic stimulation with visible light46. Using the integrated temperature sensor located on the probe shaft, we are also able to monitor the change in temperature, which provides a valuable feedback helping us to ensure safe operation of the device.
In contrast to optogenetic methods, infrared neural stimulation uses water as the chromophore, no viral sensitization is needed. In the extracellular medium, infrared light is converted into heat, and due to conductive heat propagation has a much larger effective cross- section (or stimulated volume of tissue in other words). For this reason, the spatial configuration of the end facet of the waveguide is not as critical as for devices designed to deliver visible light, where stimulation sites should be located in the close vicinity of the recording sites.
Our secondary aim was to reveal potentials of the technique in vivo, which may initiate new approaches to investigate debated hypotheses with a novel experimental toolset. For this reason, the recording depth was varied to cover regions from the superficial layer of the cortex down to the CA1 region of the hippocampus. In layer V of the cortex, a permanent increase in firing rate was observed without apparent sensitivity to the change in temperature above a threshold in the optical power range of (5-15 mW). In parallel with this example of neuronal excitation, inhibitory effect was also detected in layer VI, which was proportional to the change in temperature. The rise and recovery time in this case (about 3 minutes) was substantially longer than that of the excitatory response (< 1 minute). Approximately 50% change in the spike rate was achieved in both cases, when the highest excitation power was applied. In the hippocampus, variations in the frequency of multiunit activity was found to be similar to the data on cells recorded in the supragranular layers of the cortex. In this region, sensitivity to temperature gradient was more remarkable than that measured in the cortex.
Some recent studies in the literature has shown similar observations, however, these experiments were limited to in vitro subjects44, 46, 47, 49, 50. For example, in our experiments, the activity of CA1 neurons was recorded during in vivo stimulation. There is a growing literature debating the expression, presence and function of thermosensitive receptors and ion channels in the hippocampus45, 51, however, the in-depth investigation of the underlying phenomena and sensitivity to temperature was out of the scope of our work. Nevertheless, the very recent
results of Xia et al suggests that safety limits are far beyond the range we used50, therefore our toolset is definitely able to address questions on cell excitability modulated with tissue temperature.
Besides the above works on the response of brain cells to hyperthermia, studies on infrared neural stimulation (INS) and infrared neural inhibition (INI) may also benefit from the use of our photonic microdevice. In particular, our results indicate that low-energy (in the range of a few mW) irradiation of the intracortical and hippocampal neurons is able to either boost or suppress the firing activity of neurons without creating high spatial or temporal gradient of temperature increase. Nevertheless, the degree of inhibition (decrease in firing rate) in our case of infragranular cells are in the same range as demonstrated in vitro by Xia et al at 1550 nm with continuous wave laser light50 and in vivo by Cayce et al at 1875 nm with pulsed infrared irradiation52.
Methods
Fabrication and design
Fabrication of the silicon optrode device relies on standard MEMS fabrication technology (Figure S1). The fabrication process is described in details in ref 30. The ready-to- use device is shown in Fig. 1.C. The length of the optrode shaft is 5 mm, and width and thickness are 170 µm and 190 µm, respectively. The wires and recording sites located on the silicon carrier are composed of Ti/Pt multilayer (total thickness: 270 nm) embedded in a silicon- dioxide/silicon nitride dielectric stack (total thickness: 600 nm). The sidewalls of the fabricated optrodes are optimized through wet chemical etching to be optically smooth. This is necessary as deep reactive ion etching, used to release probe structures from the silicon wafer, results in periodic grooves of high roughness throughout the sidewall surfaces (see our prior work in ref. 31 for detailed analysis). The optically smooth sidewalls (see Figure 1.D) facilitate total internal reflection of IR light inside the probe shaft. As a result, IR light can be coupled into the 5 mm long Si shaft and can be delivered into the neural tissue. The illuminated region is the probe shaft, in this case 170 µm x 190 µm. IR light (wavelength of 1310 or 1550 nm) is guided through a multi-mode glass optical fiber butt-coupled to the Si chip (see Fig. 1.A). In the current design, a laminar array (intersite distances of two types were 100 µm and 300 µm) of four recording sites and a platinum filament as calibrated temperature sensor are located on the probe tip. The sites and the filament are connected to a custom designed PCB to record neuronal activity and temperature.
Electrochemical characterization
The impedance of each platinum recording sites was characterized using electrochemical impedance spectroscopy (EIS). A Gamry Reference 600 Potentiostat (Gamry Instruments, Warminster, PA, US) was used in a three-electrode compartment filled with 0.01 M phosphate buffered saline solution (P4417, tablet diluted in 200 mL distilled water, Merck KGaA, Germany). A leakless miniature Ag/AgCl electrode (ET072-1, eDAQ Pty Ltd., Australia), a Pt wire and the recording site of the optrode were applied as reference, counter and working electrodes, respectively. 25 mV rms voltage was utilized for sweeping between a frequency range from 10 Hz to 10 kHz. All of the electrochemical measurements were conducted in a Faraday-cage at room temperature in a cleanroom environment.
To further reduce the impedance of the platinum recording sites, we improved the active surface area by electroplating porous platinum (also called as black-platinum). The same potentiostat was applied as for EIS, in galvanostatic mode. For the deposition of the porous layer, lead free 1 wt. % chloroplatinic acid solution (diluted from 8 wt. % chloroplatinic acid solution in H2O, Merck KGaA, Germany) was used along with PVP (Polyvinylpyrrolidone, Merck KGaA, Germany) to improve the wettability of the sputtered platinum surfaces. The deposition processes were carried out in a three-compartment electrochemical cell. A leakless miniature Ag/AgCl (3.4 mol/L KCl) electrode (ET072-1, eDAQ Pty Ltd., Australia) and a platinum sheet were used as reference and counter electrode, respectively. Recording sites have been electroplated by maintaining current density of 10 mA/cm2 for 60 seconds. This individual deposition approach reduced the variability of site impedances as low as possible.
Gamry Echem Analyst software (Gamry Instruments, Warminster, PA, US) was used to evaluate and represent the Bode plot of the measurement. Fig. 1.E & F show a comparison of the impedance magnitudes and phase angles of the recording sites before and after electroplating.
Characterization of absolute output power
To determine the absolute optical power exiting the probe tip, we performed optical measurements with a Germanium IR sensor (OP-2 IR, Coherent Inc, CA, USA) connected to a laser power meter (FieldMaxII-TOP, Coherent Inc, CA, USA). During the course of the in vitro experiments, two light sources have been used. A flat-window infrared laser diode (RLT1300-40G, Roithner GmbH, Austria) with a nominal optical power of 40 mW and a wavelength of 1.31 µm was applied to conduct initial testing of the setup for thermal measurements. In this case, the beam of the laser diode was focused onto the core of the multimode optical fiber through a custom designed optical bench described in our prior work30.
Later on, the characteristic spatial distribution and calibration curves were acquired by using a pigtailed laser diode (LPSC-1550-FG105LCA-SMA, Thorlabs, Inc., USA), which provided a nominal power of 50 mW at a wavelength of 1.55 µm.
During beam power measurement, the optrode device was fixed on a 1D translation stage facing the laser power meter without any imaging optics (Figure S8/B). The tip of the optrode was positioned to the axis of IR detector and 100 µm away from its active surface (cf.
Figure S8/A). During optical heating measurements and in vivo experiments, the laser diode was driven with different DC currents using a Keithley 2635A source measure unit (Keithley Instruments Inc, OH, USA). We measured and recorded the output optical power of each optrode at all driving currents in the operation range of the diodes to determine calibration curves. Representative characteristic curves can be seen on Figure S2. These measurements of absolute power were systematically repeated during the course of in vivo experiments to avoid misinterpretation of the data due to possible degradation in the light source or in integrated components of the probe. In contrast to several publications on optical stimulation, we used absolute optical power throughout the text instead of power density or energy density, however, both can be derived easily as the area of the stimulation site was fixed (0.024 ± 0.006 mm2).
Characterization of output heat distribution
Testing of optical heating was performed in saline in 1.7 ml compartment at room temperature. The schematic of the measurement setup is shown in Fig. 2.A. The shaft of two Si probes were immersed in the liquid medium. One was the heating source (optrode) and another one was used to measure the temperature change in different positions from the end facet of the optrode (reference point of the coordinate system). IR light was coupled to the optrodes from the same light source used for absolute optical power measurement. This radiation was emitted from the probe tip and was absorbed in the water medium, therefore elevated the temperature of that. This change in temperature at the illumination spot was recorded by an external temperature sensor (R0=358.56 Ohm, TCR=2650 ppm/K, size: 100 µm x 100 µm) located on the tip of the other Si probe. The spatial change of temperature was recorded at multiple locations along the axis of the shaft (x) and also in perpendicular direction (y) with a step-size of 100 microns set by a micropositioner. The optical power is derived from the absolute optical output power measurements. The excitation waveform is presented in Figure S9.
Thermal modeling
In our previous work, a coupled optical-thermal model of the optrode device was developed and validated by surface topographic and optical measurements32. In the present study, the validation of thermal results of the model was carried out by temperature measurements discussed in section 2.2. The thermal model developed in COMSOL Multiphysics uses the optical intensity distribution at the probe tip provided as an output of a ray tracing model implemented in Zemax32. As a result, the absorbing liquid medium at the tip is the heat source in our thermal model, and the temperature distribution is calculated using the heat transfer equation. The material properties as heat capacity, density, thermal conductivity were set for silicon and water from the material library of COMSOL. The outputs of the simulation are the spatial and temporal evolution of the temperature distribution. In the simulated configuration, the shaft is immersed in a depth of 3 mm into the liquid medium (water) kept in the polyethylene cylinder, which is also taken into account during heat conduction. The radius and the height of the cylinder is 6.7 mm and 12 mm, respectively, the thickness of the wall is 1 mm. The excitation peak value, periodic time and pulse length were 7.88 mW, 120 s and 60 s, respectively. The spatial distribution along the X and Y direction from the base position (see Figure 2.A) are shown on Figure S10 A and B in equilibrium state.
The temporal changes are represented in Figure S11. The temperature values provided by the thermal model were also validated through in vivo measurement (see a representative curve in Figure S12).
Surgery
Experiments were made in accordance with the Hungarian Act of Animal Care and Experimentation (1998, XXVIII) and with the directive 2010/63/EU of the European Parliament and of the Council of 22 September 2010 on the protection of animals used for scientific purposes. Experimental protocol was approved by the regional ethical committee (license number PEI/001/2290-11/2015 for our in vivo experiments). Efforts were made to minimize the number of animals used. Rats were kept under a 12:12 h LD cycle (lights-on at 7:00 a.m.) in a temperature-controlled room at 22±2 °C. Standard food-pellets and tap water were available ad libitum.
Our acute experiments were carried out on 3 male wistar rats (Toxicoop, Budapest, Hungary) weighing between 230 and 440 g at the time of the surgery. The animals were anesthetized with urethane (1 g/kg; i.p.), then placed in a stereotaxic instrument (RWD Life Science; Shenzhen, China). A single large craniotomy was made over the somatosensory
cortical region. After durotomy, the electrodes were inserted and we waited at least for 30 minutes before recording.
Electrophysiology recordings
To record local field potential (LFP) activity, NeuroNexus (Ann Arbor, USA) silicon probes were inserted into the brain. Linear 16-channel silicon probes were inserted to the lateral part of left somatosensory cortex (Br. AP -3.3, L +2.7, in 18º at 1800 or 2800 μm depth in the case of cortical or hippocampal recordings, respectively)., while our custom designed optrode, featuring four electrophysiological recording sites, a platinum temperature sensor and a built‑in light cable, was inserted to the medial part of somatosensory cortex (Br. AP -3.3, L +2, in 0º at 1600 or 2600 μm depth in the case of cortical or hippocampal recordings, respectively). An additional screw electrode implanted over the cerebellum served as a reference. Coordinates are based on the stereotaxic atlas of Paxinos and Watson (1986).
Recordings were made with Intan RHD2132 16-channel amplifiers, connected to an RHD-2000 Evaluation Board. Rectal temperature was measured by a TH-5 Thermalert Monitoring Thermometer (Physitemp; Clifton, USA) and recorded using the analog inputs of the Intan RHD-2000 system. All signals were sampled at 20 kHz. Long-term heating sessions were made by laserdiode system (LPSC-1550-FG105LCA-SMA, Thorlabs, Inc., USA) connected to our custom optrode and controlled by Keithley 2635A device (Keithley Instruments Inc, OH, USA). Heating was triggered by a square pulse generated by an NI-USB 6211 (National Instruments, TX, USA) data acquisition system, connected to x86 based PC, which was also used for LFP recording simultaneously.
Evaluation of electrophysiology
Raw LFP channels were band pass filtered between 0.4-7 kHz, and multi-units were detected with an absolute threshold. The unit activity was combined from multiple neighboring channels, downsampled to 1 kHz and smoothed with a 10 ms moving average filter. This data was used for calculation of peri-stimulus time histogram (PSTH) of heating events. Single unit detection was made by a simple thresholding method, followed by a manual clustering. Since we always detected only one cluster, we used this method only for removing artefacts and unexpected sudden noise.
Optical stimulation protocol
Optical output power of each probe was measured before and after the in vivo experiment to check beam stability and ensure validity of the evoked responses. For each animal, the stimulation cycle was composed of 2 min long ON (diode switched on), and 4 min long OFF (diode switched off) periods to allow sufficient time for the temperature of the stimulated region to return to baseline temperature. To check the reproducibility of the stimulation patterns in the electrophysiological traces, 10-15 trials were performed in a random fashion for each applied power (temperature). Driving current of the IR laser diode was supplied by a Keithley 2635A source measure unit (Keithley Instruments Inc, OH, USA). Each onset of the laser diode was synchronized with trigger signals generated by an NI 6211 Data Acquisition Board (National Instruments, Austin, TX, USA).
References
1. Dell, A. I., Pawar, S., & Savage, V. M. Systematic variation in the temperature dependence of physiological and ecological traits. Proceedings of the National Academy of Sciences, 108(26), 10591-10596; 10.1073/pnas.1015178108 (2011).
2. Stujenske, J. M., Spellman, T., & Gordon, J. A. Modeling the spatiotemporal dynamics of light and heat propagation for in vivo optogenetics. Cell Reports, 12(3), 525-534;
10.1016/j.celrep.2015.06.036 (2015)
3. Picot, A., Dominguez, S., Liu, C., Chen, I. W., Tanese, D., Ronzitti, E., Forget, B. C.
Temperature rise under two-photon optogenetic brain stimulation. Cell reports, 24(5), 1243-1253; 10.1016/j.celrep.2018.06.119 (2018).
4. Arias-Gil, G., Ohl, F. W., Takagaki, K., Lippert, M. T. Measurement, modeling, and prediction of temperature rise due to optogenetic brain stimulation. Neurophotonics, 3(4), 045007; 10.1117/1.NPh.3.4.045007 (2016).
5. Senova, S., Scisniak, I., Chiang, C. C., Doignon, I., Palfi, S., Chaillet, A., Pain, F.
Experimental assessment of the safety and potential efficacy of high irradiance photostimulation of brain tissues. Scientific reports, 7, 43997; 10.1038/srep43997 (2017).
6. Zannou, A. L., Khadka, N., Truong, D. Q., Zhang, T., Esteller, R., Hershey, B., Bikson, M. Temperature increases by kilohertz frequency spinal cord stimulation. Brain stimulation, 12(1), 62-72; 10.1016/j.brs.2018.10.007 (2019).
7. Zheng, Y., Dou, J. R., Dong, L., Gao, Y. Thermal effect induced by low-frequency magnetic field on physiological characteristics in hippocampal CA1 region of rat.
Biomedical Physics & Engineering Express, 4(1), 015020; 10.1088/2057- 1976/aa9686 (2017).
8. Wells, J., Kao, C., Konrad, P., Milner, T., Kim, J., Mahadevan-Jansen, A., & Jansen, E. D. Biophysical mechanisms of transient optical stimulation of peripheral nerve.
Biophysical journal, 93(7), 2567-2580; 10.1529/biophysj.107.104786 (2007).
9. Cayce, J. M., Friedman, R. M., Chen, G., Jansen, E. D., Mahadevan-Jansen, A., &
Roe, A. W. Infrared neural stimulation of primary visual cortex in non-human primates.
Neuroimage, 84, 181-190; 10.1016/j.neuroimage.2013.08.040 (2014).
10. Chernov, M., & Roe, A. W. Infrared neural stimulation: a new stimulation tool for central nervous system applications. Neurophotonics, 1(1), 011011;
10.1117/1.NPh.1.1.011011 (2014).
11. Feng, H. J., Kao, C., Gallagher, M. J., Jansen, E. D., Mahadevan-Jansen, A., Konrad, P. E., & Macdonald, R. L. Alteration of GABAergic neurotransmission by pulsed infrared laser stimulation. Journal of neuroscience methods, 192(1), 110-114;
10.1016/j.jneumeth.2010.07.014 (2010).
12. Jenkins, M. W., Wang, Y. T., Doughman, Y. Q., Watanabe, M., Cheng, Y., & Rollins, A. M. Optical pacing of the adult rabbit heart. Biomedical optics express, 4(9), 1626- 1635; 10.1364/BOE.4.001626 (2013).
13. Izzo, A. D., Walsh Jr, J. T., Ralph, H., Webb, J., Bendett, M., Wells, J., & Richter, C.
P. Laser stimulation of auditory neurons: effect of shorter pulse duration and penetration depth. Biophysical journal, 94(8), 3159-3166;
10.1529/biophysj.107.117150 (2008).
14. Duke, A. R., Jenkins, M. W., Lu, H., McManus, J. M., Chiel, H. J., & Jansen, E. D.
Transient and selective suppression of neural activity with infrared light. Scientific reports, 3, 2600; 10.1038/srep02600 (2013).
15. Walsh, A. J., Tolstykh, G. P., Martens, S., Ibey, B. L., Beier, H. T. Action potential block in neurons by infrared light. Neurophotonics, 3(4), 040501;
10.1117/1.NPh.3.4.040501 (2016).
16. Ganguly, M., Jenkins, M. W., Chiel, H. J., & Jansen, E. D. Modeling the effects of elevated temperatures on action potential propagation in unmyelinated axons. In Clinical and Translational Neurophotonics; Neural Imaging and Sensing; and Optogenetics and Optical Manipulation (Vol. 9690, p. 96901O); 10.1117/12.2211048 (2016).
17. Lothet, E. H., Shaw, K. M., Lu, H., Zhuo, J., Wang, Y. T., Gu, S., Jenkins, M. W.
Selective inhibition of small-diameter axons using infrared light. Scientific reports, 7(1), 3275; 10.1038/s41598-017-03374-9 (2017).
18. Fekete, Z. Recent advances in silicon-based neural microelectrodes and microsystems: a review. Sensors and Actuators B: Chemical, 215, 300-315;
10.1016/j.snb.2015.03.055 (2015).
19. Royer, S., Zemelman, B. V., Barbic, M., Losonczy, A., Buzsáki, G., & Magee, J. C.
Multi‐array silicon probes with integrated optical fibers: light‐assisted perturbation and recording of local neural circuits in the behaving animal. European Journal of Neuroscience, 31(12), 2279-2291; 10.1111/j.1460-9568.2010.07250.x (2010)
20. Wu, F., Stark, E., Im, M., Cho, I.J., Yoon, E.S., Buzsáki, G., Wise, K.D. and Yoon, E.
An implantable neural probe with monolithically integrated dielectric waveguide and recording electrodes for optogenetics applications. Journal of Neural Engineering, 10(5), p.056012; 10.1088/1741-2560/10/5/056012 (2013)
21. Kanno, S., Lee, S., Harashima, T., Kuki, T., Kino, H., Mushiake, H., Yao, H. and Tanaka, T. Multiple optical stimulation to neuron using Si opto-neural probe with multiple optical waveguides and metal-cover for optogenetics. In 2013 35th Annual International Conference of the IEEE Engineering in Medicine and Biology Society (EMBC) pp. 253-256; 10.1109/EMBC.2013.6609485; (2013)
22. Libbrecht, S., Hoffman, L., Welkenhuysen, M., Van den Haute, C., Baekelandt, V., Braeken, D. and Haesler, S. Proximal and distal modulation of neural activity by spatially confined optogenetic activation with an integrated high-density optoelectrode. Journal of Neurophysiology, 120(1), pp.149-161;
10.1152/jn.00888.2017 (2018)
23. Park, S., Guo, Y., Jia, X., Choe, H.K., Grena, B., Kang, J., Park, J., Lu, C., Canales, A., Chen, R. and Yim, Y.S.. One-step optogenetics with multifunctional flexible polymer fibers. Nature Neuroscience, 20(4), p.612; 10.1038/nn.4510 (2017)
24. Schwaerzle, M., Paul, O. and Ruther, P. Compact silicon-based optrode with integrated laser diode chips, SU-8 waveguides and platinum electrodes for optogenetic applications. Journal of Micromechanics and Microengineering, 27(6), p.065004; 10.1088/1361-6439/aa6ad4 (2017)
25. Buzsáki, G., Stark, E., Berényi, A., Khodagholy, D., Kipke, D.R., Yoon, E. and Wise, K.D. Tools for probing local circuits: high-density silicon probes combined with optogenetics. Neuron, 86(1), pp.92-105; 10.1016/j.neuron.2015.01.028 (2015) 26. Wu, F., Stark, E., Ku, P.C., Wise, K.D., Buzsáki, G. and Yoon, E. Monolithically
integrated μLEDs on silicon neural probes for high-resolution optogenetic studies in behaving animals. Neuron, 88(6), pp.1136-1148; 10.1016/j.neuron.2015.10.032 (2015)
27. McAlinden, N., Cheng, Y., Scharf, R., Xie, E., Gu, E., Reiche, C.F., Sharma, R., Tathireddy, P., Dawson, M.D., Rieth, L. and Blair, S. Multisite microLED optrode array for neural interfacing. Neurophotonics, 6(3), p.035010; 10.1117/1.NPh.6.3.035010 (2019)
28. Kossey, M.R., Alt, S., Rizk, C. and Foster, A.C. Integrated Photonic Arrays as a Platform for Infrared Neural Stimulation. In Bio-Optics: Design and Application (pp.
BoS2A-8). Optical Society of America; 10.1364/BODA.2017.BoS2A.8 (2017)
29. Abaya, T. V., Diwekar, M., Blair, S., Tathireddy, P., Rieth, L., Clark, G. A., Solzbacher, F. Characterization of a 3D optrode array for infrared neural stimulation. Biomedical optics express, 3(9), 2200-19; 10.1364/BOE.3.002200 (2012).
30. Horváth, Á. C., Boros, Ö. C., Beleznai, S., Sepsi, Ö., Koppa, P., & Fekete, Z. A multimodal microtool for spatially controlled infrared neural stimulation in the deep brain tissue. Sensors and Actuators B: Chemical, 263, 77-86;
10.1016/j.snb.2018.02.034 (2018).
31. Kiss, M., Földesy, P., & Fekete, Z. Optimization of a Michigan-type silicon microprobe for infrared neural stimulation. Sensors and Actuators B: Chemical, 224, 676-682;
10.1016/j.snb.2015.10.084 (2016).
32. Boros, Ö. C., Horváth, Á. C., Beleznai, S., Sepsi, Ö., Lenk, S., Fekete, Z., Koppa, P.
Optical and thermal modeling of an optrode microdevice for infrared neural stimulation. Applied optics, 57(24), 6952-6957; 10.1364/AO.57.006952 (2018).
33. Horváth, Á. C., Boros, C. Ö., Sepsi, Ö., Beleznai, S., Koppa, P., Fekete, Z. Optical characterization of an infrared neural optrode. In 2018 Symposium on Design, Test, Integration & Packaging of MEMS and MOEMS (DTIP) (pp. 1-4). IEEE;
10.1109/DTIP.2018.8394242 (2018).
34. Wang, H., Wang, B., Normoyle, K. P., Jackson, K., Spitler, K., Sharrock, M. F., Du, R.
Brain temperature and its fundamental properties: a review for clinical neuroscientists.
Frontiers in neuroscience, 8, 307; 10.3389/fnins.2014.00307 (2014).
35. Alberts B, Johnson A, Lewis J, Raff M, Roberts K, Walter P. Molecular Biology of the Cell. 4th edition. Garland Science; 2002.
36. Kiyatkin, E. A., and Sharma, H. S. Permeability of the blood-brain barrier depends on brain temperature. Neuroscience 161, 926–939; 10.1016/j.neuroscience.2009.04.004 (2009).
37. Kiyatkin, E.A., Wakabayashi, K.T., Lenoir, M. Physiological fluctuations in brain temperature as a factor affecting electrochemical evaluations of extracellular glutamate and glucose in behavioral experiments. ACS Chem. Neurosci. 4, 652–65;
10.1021/cn300232m (2013).
38. Colbourne, F., Grooms, S. Y., Zukin, R. S., Buchan, A. M., & Bennett, M. V.
Hypothermia rescues hippocampal CA1 neurons and attenuates down-regulation of the AMPA receptor GluR2 subunit after forebrain ischemia. Proceedings of the National Academy of Sciences, 100(5), 2906-2910; 10.1073/pnas.2628027100 (2003).
39. Motamedi, G. K., Lesser, R. P., & Vicini, S. Therapeutic brain hypothermia, its mechanisms of action, and its prospects as a treatment for epilepsy. Epilepsia, 54(6), 959-970; 10.1111/epi.12144 (2013).
40. Marion, D. W., Penrod, L. E., Kelsey, S. F., Obrist, W. D., Kochanek, P. M., Palmer, A. M., Dekosky, S. T. Treatment of traumatic brain injury with moderate hypothermia.
New England Journal of Medicine, 336(8), 540-546;
10.1056/NEJM199702203360803 (1997).
41. Triller, A., and Choquet, D. New concepts in synaptic biology derived from single- molecule imaging. Neuron 59, 359–374; 10.1016/j.neuron.2008.06.022 (2008).
42. Horvath, T. L., Warden, C. H., Hajos, M., Lombardi, A., Goglia, F., and Diano, S. Brain uncoupling protein 2: uncoupled neuronal mitochondria predict thermal synapses in homeostatic centers. J. Neurosci. 19, 10417–10427; 10.1523/JNEUROSCI.19-23- 10417 (1999).
43. Szallasi, A. TRP Channels as Therapeutic Targets: From Basic Science to Clinical Use. Academic Press, 10.1016/C2013-0-09923-9 (2018).
44. Shibasaki, K., Suzuki, M., Mizuno, A., & Tominaga, M. Effects of body temperature on neural activity in the hippocampus: regulation of resting membrane potentials by transient receptor potential vanilloid 4. Journal of Neuroscience, 27(7), 1566-1575;
10.1523/JNEUROSCI.4284-06.2007 (2007).
45. Kim, J., & Connors, B. High temperatures alter physiological properties of pyramidal cells and inhibitory interneurons in hippocampus. Frontiers in cellular neuroscience, 6, 27; 10.3389/fncel.2012.00027 (2012).
46. Kozai, T. D., & Vazquez, A. L. Photoelectric artefact from optogenetics and imaging on microelectrodes and bioelectronics: new challenges and opportunities. Journal of Materials Chemistry B, 3(25), 4965-4978; 10.1039/C5TB00108K (2015).
47. Hedrick, T., & Waters, J. (2011). Spiking patterns of neocortical L5 pyramidal neurons in vitro change with temperature. Frontiers in cellular neuroscience, 5, 1.
48. de la Peña, E., Mälkiä, A., Vara, H., Caires, R., Ballesta, J. J., Belmonte, C., & Viana, F. The influence of cold temperature on cellular excitability of hippocampal networks.
PloS one, 7(12), e52475; 10.1371/journal.pone.0052475 (2012).
49. Radzicki, D., Yau, H. J., Pollema-Mays, S. L., Mlsna, L., Cho, K., Koh, S., Martina, M.
Temperature-sensitive Cav1. 2 calcium channels support intrinsic firing of pyramidal neurons and provide a target for the treatment of febrile seizures. Journal of Neuroscience, 33(24), 9920-9931; 10.1523/JNEUROSCI.5482-12.2013 (2013).
50. Xia, Q., Nyberg, T. Inhibition of Cortical Neural Networks Using Infrared Laser. Journal of biophotonics, e201800403; 10.1002/jbio.201800403 (2019).
51. Hurtado-Zavala, J. I., Ramachandran, B., Ahmed, S., Halder, R., Bolleyer, C., Awasthi, A., Lester, H. A. TRPV1 regulates excitatory innervation of OLM neurons in the hippocampus. Nature communications, 8, 15878; 10.1038/ncomms15878 (2017).
52. Cayce, J. M., Friedman, R. M., Jansen, E. D., Mahavaden-Jansen, A., & Roe, A. W.
Pulsed infrared light alters neural activity in rat somatosensory cortex in vivo.
Neuroimage, 57(1), 155-166; 10.1016/j.neuroimage.2011.03.084 (2011).
Acknowledgement
The supportive work of the cleanroom staff at the Microsystems Laboratory of the Hungarian Academy of Sciences and that of Szabolcs Kiss and Iván Gresits by helping with the validation of temperature sensors. The authors are also thankful to the National Brain Research Program (grant: 2017_1.2.1-NKP-2017-00002), the National Research, Development and Innovation Office (grants: NKFIH K 120143, NKFIH PD121307, TUDFO/51757/2019-ITM), New National Excellence Program of the Ministry for Innovation and Technology (UNKP-19-4-PPKE-9; UNKP-19-3-I-OE-36) and the BME-Nanonotechnology FIKP grant of EMMI (BME FIKP-NAT). The support of the European Union through the grant EFOP-3.6.3-VEKOP-16-2017-00002 co-financed by the European Social Fund is also acknowledged. The Bolyai János Scholarship of the Hungarian Academy of Sciences granted for Z.F. and S.B is also acknowledged.
Author Contributions Statement
A.C. H, S. B., C.O.B, P.K., P.B., Z.F wrote the main manuscript and prepared the figures. S.B., A.C.H. and P.B. worked on the in vivo experiments and evaluation; Z.F. and A.C.H. developed, prepared the microdevices and performed the in vitro tests and evaluation.
Multi-physical model was implemented and validated by C.O.B, L.K. and P.K. All authors reviewed the manuscript.
Data availability statement
The datasets generated during and/or analyzed during the current study are available from the corresponding author on reasonable request.
Competing financial and non-financial interests
The authors declare no competing financial and non-financial interests.
Supplementary
Figure S1
Figure S1. Schematic representation of technology process flow of optrode fabrication. Three post-processing steps were developed in (Kiss, 2016) to transform the shaft of a standard silicon neural probe into low-loss infrared waveguide. The whole manufacturing scheme is detailed in our prior work30
The fabrication of the multimodal silicon probe relies on silicon MEMS (Micro-electro- mechanical systems) processes. The initial substrate is a 200 µm thick (100) single-crystalline silicon wafer. Double-side polished wafers are used to maximize the efficiency of the integrated Si waveguide by maintaining the atomic smoothness of the wafer surface. Wet oxidation of silicon wafers is performed at 1100 °C. 50 nm thick thermal SiO2 layer is grown on the substrate surface. To further isolate the recording sites from the bulk Si, a 300 nm thick low-stress silicon nitride (SiNx) film was deposited in an LPCVD chamber (Tempress Systems, Inc., Netherlands) at 830 °C and 200 mTorr. The gas flow rate of H2SiCl2 and NH3 was 160 sccm and 20 sccm, respectively. The SiNx and SiO2 are removed from the backside of the wafer by wet etching in phosphoric acid and diluted HF, while front side layers are protected by low temperature oxide and SPR 4.0 photoresist (Figure S1, step 1). Wet etching was used instead of dry etching to maintain the smoothness of the backside surface. A sacrificial Al layer was used to define the pattern of the TiOx/Pt recording sites, temperature monitoring
filament and wires via a standard lift-off process (step 2). First, a 300 nm thick sacrificial Al layer was deposited by electron beam evaporation. This was followed by the first photolithography step using Microposit 1818 photoresist (Rohm and Haas Company, USA), and etching steps defining the inverse pattern of the conductive layers. The conductive layers consisted of a 15 nm thick adhesion layer of TiOx formed by reactive sputtering of Ti in an Ar/O2 atmosphere (Ar/O2 ratio was 80:20). 270 nm thick Pt was sputtered on top of TiOx. The deposition of the two layer was performed in a single vacuum cycle using a DC Magnetron sputtering equipment (Leybold GmbH, Germany) (step 3). To complete the lift-off process step, photoresist and Al were removed in acetone and in nitric acid, respectively (4-5). In the next fabrication step, the top passivation layer of 1000 nm thick SiO2 layer was deposited using LPCVD at 430 °C in a gas mixture of SiH4 & O2. Contact and bonding sites were exposed by additional photolithography (Microposit 1818 photoresist) and dry etching step through a 100 nm thick aluminum hard mask (step 7). Dry etching of the SiO2/SiNx/SiO2 dielectric stack was performed in an Oxford Plasmalab 100 DRIE chamber using fluorine chemistry (step 8).
200 nm SiNx as a masking layer for wet chemical polishing was deposited again in the LPCVD system using the above parameters (step 6). The probes were then micromachined by dry etching using Bosch recipe in an Oxford Plasmalab System 100 DRIE chamber (Oxford Instruments Plc, UK). Masking layer was e-beam evaporated aluminum on the front side, while bottom SiO2/SiNx stack acted as etch stop layer. A protective 4 micron thick photoresist layer was also utilized on the backside of the wafer (step 7). Chamber pressure was 30 mTorr. ICP power was set to 750 W. C4F8 and SF6 flow rate were 100 sccm and 150 sccm, respectively.
The duration of etch and passivation cycles were 4 and 9 seconds, respectively. Finally, masking layers were removed in acetone (step 8). Fluorocarbon polymer inherently deposited on the trench sidewall during Bosch-process was removed in a high-temperature oven at 600°C in O2. The planarization of the probe sidewall is achieved by immersing the wafer in a polishing mixture of HF : HNO3 : H3PO4 in a ratio of 1 : 8 : 1 at 20 °C for 2.5 minutes (etch rate:
9-10 µm/min). The low-temperature oxide membrane at the bottom of the trenches is dissolved in buffered oxide etchant, then top and bottom SiNx protective layer is also removed completely in phosphorous acid (step 9).
Figure S2
Figure S2. Characteristic change in optical power vs. driving current of laser diodes (average + SD for three different optrodes). Measurements were performed at the probe tip using an absolute power meter.
Figure S3
Figure S3.: Representative curves to compare integrated vs external temperature sensor (a) and external Pt temperature sensor vs fiber-optics based temperature sensor (b).
Figure S4
Figure S4. Effect of fiber core diameter on temperature distribution
Figure S5
Figure S5. Normalized spatial distribution of optical heating along two perpendicular axes y and z according to Fig. 2.A.
Figure S6
Figure S6. Experimental arrangement for the in vivo validation of spatially controlled heating in the deep tissue. The blue line represents a silicon probe used as control for the evaluation of electrophysiological response of the heated tissue.
Figure S7.
Figure S7. Body temperature fluctuations monitored during stimulus sequences. We found no correlation between body temperature and brain temperature during the experiments, which confirms that changes in temperature had only local effect inside the brain.
Figure S8
Figure 8 A: Schematic of the relative position of the optrode’s waveguiding shaft and the IR detector’s active surface. (a=7 mm; b=7.1 mm) B: Photo on optical power measurement.
Figure S9
Figure S9. Time domain representation of recorded data during optically induced heating with cycles of square wave signals (T = 2 min, P = 4.16 mW). The maximum temperature was probed at the plateau of five consecutive cycles to evaluate the average rise in temperature in response at a particular excitation scheme.
Figure S10
Figure S10. Measured and simulated temperature in water using 7.88 mW peak value, 120 s periodic time and 60 s pulse length excitation, at stationary state. A: along axes x, B: along axes y (see Figure 2).
Figure S11
Figure S11. Measured and simulated temporal change of temperature in water using 2.68 mW peak value, 120 s periodic time and 60 s pulse length excitation.
Figure S12.
Figure S12. Difference between simulated and in vivo temperature values induced by various input optical powers. Similarly to the calibration of integrated sensor with an external one, the simulation results have to be also scaled by 24 ± 4 %.
0 1 2 3 4 5
2.86 7.13 10.64 13.19
ΔT (K)
Optical power (mW) Measurement
Simulation