Department of Materials Physics, Eötvös Loránd University, Budapest H-1518, P.O.B. 32, Hungary
bSchool of Mechanical, Industrial and Manufacturing Engineering, Oregon State University, Corvallis, OR 97331, USA
cInstitute for Technical Physics and Materials Science, Centre for Energy Research, Budapest, Hungary
A R T I C L E I N F O
Keywords:
Multi-principal element alloy Severe plastic deformation Microstructure
Thermal stability Recovery Hardness
A B S T R A C T
The microstructural stability of a nanocrystalline HfNbTiZr multi-principal element alloy was studied by an- nealing the material in a differential scanning calorimeter (DSC). The as-received sample was obtained by severe plastic deformation using the high-pressure torsion (HPT) technique. Samples were annealed to the character- istic temperatures of the DSC thermogram, namely up to 740, 890 and 1000 K, and the microstructure of the heat treated specimens was analyzed. It was found that the heating up to 740 K yielded a decomposition of the initial body-centered cubic (bcc) phase into two bcc phases with a lower and a higher lattice constant. During annealing up to 890 K, a Zr/Hf-rich hexagonal-close packed (hcp) phase started to nucleate. Heating the sample up to 1000 K resulted in the formation of a nanocrystalline Zr/Hf-rich bcc phase beside the Zr/Hf-rich hcp and the Nb- rich bcc phases. Beside the phase transformation a recovery of the severely deformed defect structure and a grain coarsening were also observed which was accompanied by a reduction of the hardness above 740 K.
1. Introduction
Sincefirst reported in 2004, multi-principal element alloys(MPEAs) including high-entropy alloys (HEAs) [1,2], which are composed of multiple principal elements in equal or near equal molar ratios, have received a great deal of attention from the scientific community [3].
This is not only due to the vast amount of new materials, but also thanks to their outstanding and unique properties, such as high ductility at cryogenic temperatures [4], good wear resistance [5], and super- conductivity [6]. Out of these new materials, refractory MPEAs are among the most suitable for high temperature applications. These MPEAs are based on refractory elements (consisting of nine elements in Group IV (Ti, Zr, Hf), Group V (V, Nb, Ta), and Group VI (Cr, Mo, W)), all of which have melting points higher than 1875 °C. Since it is known that alloys generally maintain their strength at temperatures below
~0.6 of their absolute melting temperature, refractory alloys are em- ployable at higher temperatures than other metallic materials. How- ever, even though many refractory MPEAs exhibit high temperature strength, most of them are rather brittle at room temperature [7]. One of the alloys that was reported to exhibit both high hardness at elevated temperature and good ductility at room temperature is the equimolar refractory MPEA HfNbTiZr [8]. Therefore, the present study focuses on this material.
Other than chemical composition, the mechanical properties of metallic materials can be tuned using severe plastic deformation (SPD).
A material after processing by SPD has an increased lattice defect density (e.g. dislocation density or twin fault probability) and a de- creased grain size, resulting in a considerable strength enhancement. In a previous report [9], it was shown that HfNbTiZr after processing by 10 turns of high-pressure torsion (HPT) has a reduced grain size to the nanocrystalline regime and a large dislocation density of
~210 × 1014 m−2, thereby exhibiting an outstanding hardness of about 4400 MPa. Haché et al. has summarized that generally, nano- crystalline MPEAs surpass coarse-grained MPEAs and nanocrystalline conventional alloys in strength, while exhibiting higher thermal stabi- lity than pure and binary nanocrystalline materials [10]. Hence HPT is the treatment of choice in this paper.
One key feature of MPEAs is their high-entropy configuration, which is maximized when the material is in one solid solution phase.
However, it was found that a number of MPEAs decomposed when exposed to elevated temperatures. For example, CoCrFeMnNi formed three distinct phases after prolonged exposure at 500 °C [11], or in AlTiVNb processed by HPT, intermetallic phases precipitated after an- nealing [12]. This phase separation is found to be heavily dependent on the material chemical composition. In the case of CoCrFeMnNi alloy, several investigations have been conducted on the effect of Co, Mn and
https://doi.org/10.1016/j.matchar.2020.110550
Received 18 May 2020; Received in revised form 14 July 2020; Accepted 3 August 2020
⁎Corresponding author.
E-mail address:jeno.gubicza@ttk.elte.hu(J. Gubicza).
Available online 05 August 2020
1044-5803/ © 2020 The Author(s). Published by Elsevier Inc. This is an open access article under the CC BY license (http://creativecommons.org/licenses/BY/4.0/).
Ni on the phase stability [13–15], showing the stabilizing/destabilizing effect of different elements on different phases. Similar researches have also been done for other alloys [16,17]. Nevertheless, it is possible for the phase decomposition to be beneficial to the mechanical properties of the materials, as shown for e.g., the AlTiVNb MPEA, where its hardness increased when the MPEA was annealed up to 700 °C, while decreased at higher temperatures. Such unusual anneal response was also observed in other nanocrystalline MPEAs [18,19]. Other beha- viours after annealing were also observed. For example, HfNbTaTiZr after being brought to elevated temperatures (600, 800 and 1000 °C) was initially hardened; however, as the holding time increased, the material hardness declined [20].
In this paper, the thermal stability of a nanocrystalline HfNbTiZr MPEA is investigated. The nanostructured microstructure was achieved by 10 turns of HPT. First, the characteristic temperatures for the evo- lution of the nanostructure are determined by calorimetry. Then, samples are heated up to these temperatures, and the microstructure and the phase composition in the annealed specimens are characterized in detail. Finally, the effect of these changes on the hardness is revealed.
2. Material and methods 2.1. Processing of the material
Magnetic levitation melting of a mixture of four pure components (purity > 99.9 wt%) was used for synthesizing the Hf25Nb25Ti25Zr25
MPEA, followed by the homogenization heat treatment at 1290 °C for 24 h. The cast material was machined into cylindrical billets with a diameter of 10 mm, and these billets were sliced by electric discharge machining (EDM) into disks with a thickness of ~1 mm. Thefinal disk thickness of ~0.85 mm was achieved by mechanical grinding. A con- ventional HPT facility with quasi-constrained set-up was utilized for the HPT process [21]. The HPT processing was conducted for 10 turns at room temperature under a pressure of 6.0 GPa at a rotational speed of 1 rpm.
2.2. Differential scanning calorimetry
The thermal stability of the nanocrystalline HfNbTiZr MPEA mate- rial was studied on the disk edges subjected to 10 turns by HPT.
Specifically, small specimens with a width of about 1 mm were cut from the HPT-processed disk using a diamond saw, therefore the character- ization was conducted at the HPT disk edges between the radii of 4 and 5 mm. These specimens were subjected to annealing in a differential scanning calorimetry (DSC) using a Perkin Elmer (DSC2) calorimeter.
First, a sample was heated up to the maximum test temperature, 1000 K at a heating rate of 40 K/min under an Ar atmosphere. Then, the characteristic temperatures of the microstructure evolution were de- termined from the thermogram. Finally, individual samples were he- ated up to these temperatures at a heating rate of 40 K/min and then quenched to room temperature at a rate of about 300 K/min for mi- crostructure investigation.
2.3. Microstructure studied by electron microscopy
The microstructures of the HPT-processed and the annealed samples were characterized by transmission electron microscopy (TEM). Thin TEM-lamellae were prepared from the disk samples by a focused ion beam (FIB) technique using Ga+ions. First, the samples were glued using a special glue at 100 °C for not more than 1 min to a Cu-stub for mechanical grinding and polishing. In the second step, ion-beam thin- ning of the 50μm thick lamella was started at 7 keV using 2 mA ion current. Finally, the perforated lamella was cleaned at 3 keV and later at 1 keV from both sides to remove the damaged layers from its sur- faces.
A Titan Themis G2 200 scanning transmission electron microscope
(STEM) was used for TEM and energy-disperse X-ray spectroscopy (EDS) investigations. The microscope was equipped with a four-seg- ment Super-X EDS detector. A corrector for the spherical aberration (Cs) was applied at the imaging part, while probe-correction was not used.
The image resolution is 0.16 nm in STEM Z-contrast imaging mode (recorded with a Fishione high-angle annular dark-field (HAADF) de- tector). The EDS data were recorded (together with the HAADF signal) in spectrum-image mode, and elemental maps were made for the con- stituents of the alloy in order to investigate the decomposition of the studied MPEA.
2.4. Microstructure characterization by X-ray diffraction
The phase composition was analyzed by X-ray diffraction (XRD) by utilizing a Rigaku Smartlab powder diffractometer using CuKαradia- tion (wavelength:λ= 0.15418 nm). Before XRD measurements, the surfaces of the samples were mechanical polished using 800, 1000, 1200, 2500 and 4000 grit papers, and subsequently colloidal silica suspension with 1μm particle size. Then, etching was applied on the surface for ~30 s with a solution of 45 ml distilled water, 5 ml HF and 2 ml nitric acid. The lattice parameter was calculated using the Nelson- Riley method [22] applied to the diffraction peak positions.
The microstructure of the MPEA samples was investigated using X- ray line profile analysis (XLPA). The measurement of the X-ray line profiles was carried out using a high-resolution rotating anode dif- fractometer (type: RA-MultiMax9, manufacturer: Rigaku) with CuKα1
radiation (wavelength:λ= 0.15406 nm). X-rays scattered into Debye- Scherrer rings were detected using two-dimensional imaging plates, and the intensity distribution perpendicular to the rings were measured as the diffraction profile. The line profiles evaluation was carried out using the Convolutional Multiple Whole Profile (CMWP)fitting method [23].
In this procedure, afitting of all measured diffraction peaks was per- formed with a convolution of theoretical profiles related to diffraction domain size and dislocation density. The dependence of dislocation broadening of the diffraction peaks on the indices of reflections was taken into account by the dislocation contrast factors [23]. For cubic crystals, the contrast factors depend on two parameters,Ch00andq. For Hf25Nb25Ti25Zr25MPEA with a bcc structure, the value ofCh00is about 0.31 for both edge and screw dislocations as determined in a former study [9]. The values ofqare 1.5 and 2.7 for edge and screw disloca- tions, respectively.
2.5. Hardness test
Hardness testing was performed on the HPT-processed and the an- nealed samples by a Zwick Roell ZHμindentation machine having a Vickers indenter, with 500 g applied load and 10 s dwell time. The surface before hardness testing was treated with the same manner as for XRD measurements (see Section 2.4). The average microhardness of each sample was determined from 10 measurements.
3. Results
3.1. DSC scan on the MPEA sample processed by HPT
Fig. 1 shows the DSC curve obtained for the HPT-processed HfNbTiZr MPEA at a heating rate of 40 K/min. The thermogram con- sists of three broad and strongly overlapping exothermic peaks. The first peak starts at 400 K andfinishes at about 740 K. The second peak ends at 890 K, and there is a third smaller peak between 890 and 1000 K. These peaks may be related to the recovery/recrystallization of the HPT-processed nanocrystalline microstructure and/or phase trans- formations in the MPEA sample.
3.2. XRD study of the evolution of phase composition during annealing The evolution of the phase composition during annealing was stu- died for the nanocrystalline HfNbTiZr MPEA by XRD. The initial HPT- processed state has a single-phase bcc structure as revealed by the XRD pattern inFig. 2which was taken from the disk edge. The lattice con- stant determined from the peak positions was 0.3438 ± 0.0003 nm.
The evolution of the phase composition due to heating up to different characteristic temperatures defined in the DSC curve inFig. 1is illu- strated in the XRD profiles as shown inFig. 3. In thisfigure, only a part of the diffractograms taken for the diffraction angles between 62 and 72° is shown in order to reveal the special shape of the bcc peak with the indices 211. Indeed, after annealing up to 740 K, an additional shoulder appeared at the left side of the main bcc peak. At the same time, the main bcc peak shifted to a higher angle compared to the HPT- processed state, suggesting a decrease of the lattice constant. Assuming that the bcc peak comprises two subprofiles, two Lorentzian functions werefitted to the whole reflection which gave the positions and the intensities of the two profile components. The same procedure was applied for the other bcc peaks in the pattern profile and from the subprofile positions the lattice constants of the bcc phases corre- sponding to the two subreflections were determined.Table 1shows that the lattice parameter of the bcc phase corresponding to the subprofiles appeared at lower angles was 0.3485 ± 0.0007 nm. This phase is
denoted as bccL. For the other bcc phase scattering X-rays into higher angles (bccH), the lattice constant was obtained as 0.3427 ± 0.0001 nm. The intensity fractions of the bccL and bccH phases were 29 and 71%, respectively.
Fig. 3shows that after annealing up to 890 K the microstructure also contained two bcc components but their lattice constants are closer than for the sample heated up to 740 K (seeTable 1). The fractions of bccL and bccH phases were 41 and 54%, respectively. In addition to the bcc phases, a novel hcp phase formed while the intensity fraction was only ~5%. Due to this low fraction of the phase, the XRD peaks were noisy and therefore the lattice constants of the hcp phase were not determined. After annealing up to 1000 K, the fraction of the hcp phase increased to about 12% and the lattice constants were obtained as a = 0.3201 ± 0.0002 nm and c = 0.5094 ± 0.0003 nm. Considering the similar hcp peak positions at both 890 and 1000 K, the lattice parameters at 890 K are anticipated to be consistent with the values determined for 1000 K. At the highest annealing temperature, the bcc peaks again consisted of two components: a narrow subprofile at lower diffraction angle and a much broader subreflection at higher angle. The latter profile overlapped not only with the peak bccL phase but also with the reflections of the hcp phase as shown inFig. 4where Lor- entzian functions were fitted to the bcc and hcp peaks. The lattice parameters and the fraction of the different phases were determined from the peak positions and areas obtained for all separated peaks in the pattern. The lattice constants of the bccL and bccH phases were 0.3438 ± 0.0001 nm and 0.3416 ± 0.0003 nm, respectively. The fraction of the bccL component was ~28% while the major component Fig. 1.DSC thermogram obtained for the sample cut from the edge of a disk
processed by 10 turns of HPT.
Fig. 2.XRD diffractogram for the sample cut from the edge of a disk processed by 10 turns of HPT.
Fig. 3.Parts of the XRD patterns measured for the HPT-processed sample and the specimens annealed after HPT up to the temperatures of 740, 890 and 1000 K.
Table 1
The crystalline phases, their lattice constants and intensity fractions as obtained by XRD. BccL and bccH indicate the bcc phases for which the XRD peaks ap- peared at lower and higher diffraction angles, respectively (seeFig. 3).
State of material Phases Lattice constant [nm] Fraction [%]
10 HPT bcc a = 0.3438 ± 0.0003 100
10 HPT + 740 K bccL a = 0.3485 ± 0.0007 29
bccH a = 0.3427 ± 0.0001 71
10 HPT + 890 K bccL a = 0.3443 ± 0.0002 41
bccH a = 0.3435 ± 0.0001 54
hcp n.a. 5
10 HPT + 1000 K bccL a = 0.3438 ± 0.0001 28
bccH a = 0.3416 ± 0.0003 60
hcp a = 0.3201 ± 0.0002 12
c = 0.5094 ± 0.0003
of bccH had a fraction of ~60%.
3.3. TEM study of the microstructure
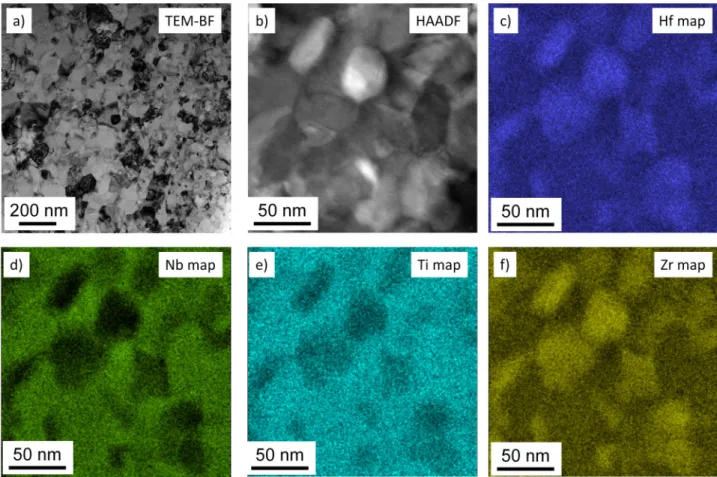
Fig. 5a shows a TEM bright-field (BF) image for the microstructure of the HPT-processed HfNbTiZr sample. The average grain size was obtained as ~33 nm by averaging the diameters of the grains in many TEM images. Fig. 5b shows a HAADF image while the corresponding EDS elemental maps are given in Fig. 5c–f. No chemical
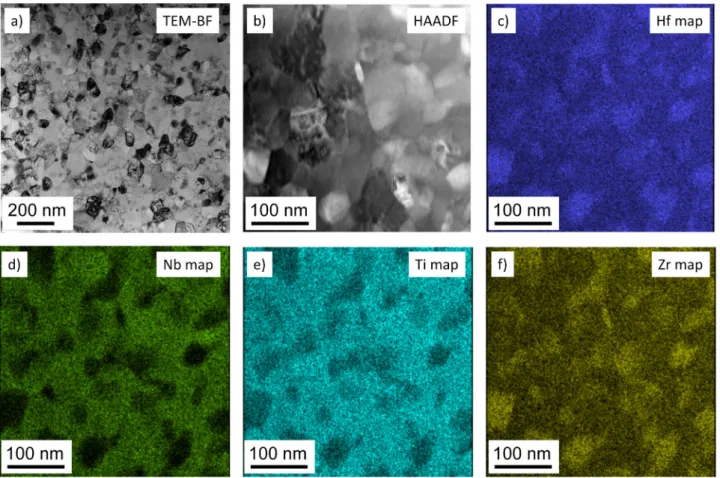
inhomogeneities were revealed by these maps. After annealing to 740 K, the grain size was measured as ~38 nm which is shown in a typical BF-TEM image inFig. 6a and the nanocrystalline microstructure does not differ significantly from the processed MPEA before heat treatment. The HAADF image inFig. 6b and the elemental maps in Fig. 6c–f revealed reasonable chemical homogeneities although XRD showed decomposition into two bcc phases leading to different lattice constants that are most probably caused by different chemical compo- sitions. This apparent contradiction can be explained by the fact that XRD investigates a much larger volume than TEM, therefore the area studied by the latter method may be occasionally free of considerable inhomogeneity.
After heating up to the temperature of 890 K, the grain size de- termined from the TEM micrographs increased to ~81 nm where a representative TEM-BF image of the microstructure is shown inFig. 7a.
This value is much larger than that obtained immediately after HPT (~33 nm) and after annealing to 740 K (~38 nm). The HAADF image in Fig. 7b and the corresponding EDS elemental maps inFig. 7c–f indicate considerable chemical inhomogeneities. The element pairs of Zr/Hf and Nb/Ti vary complementary. The highest spatial heterogeneities were observed for Nb and Zr. In practice, the measured chemical composition in some Zr/Hf-rich regions demonstrated the following concentrations (in at.%): 37–47% Zr, 27–31% Hf, 8–18% Nb and 14–18% Ti, while some Nb/Ti-rich areas showed the following concentrations: 32–36%
Nb, 23–24% Ti, 21–25% Zr and 19–20% Hf. It should be noted that grains with different compositions may exist under each other in the TEM sample, therefore the composition measured on a given area may be an average for more than one grain. Nevertheless, it is un- ambiguously proved that the MPEA material decomposed to Zr/Hf- and Nb/Ti-rich regions which surely correspond to the separate phases bccL and bccH with higher and lower lattice constants, respectively, as ob- served by XRD inFig. 3, since the atomic sizes of Zr and Hf are much Fig. 4.Separation of the overlapping XRD peaks for the determination of the
peak areas byfitting Lorentzian functions on the profiles scattered from bccL, bccH and hcp phases for the HPT sample heated up to 1000 K.
Fig. 5.BF (a) and HAADF (b) images obtained by (S)TEM for the initial HPT-processed sample. The chemical composition for the area shown in (b) was investigated by STEM -EDS. The elemental maps for Hf (c), Nb (d), Ti (e) and Zr (f) are also shown.
larger than that for Nb or Ti [24]. XRD also revealed the precipitation of an hcp phase in the annealed MPEA at 890 K (seeSection 3.2), but this phase has a very low fraction (~5%) according to XRD and was not observed in the obtained TEM images.
Fig. 8a shows a representative BF-TEM image obtained on the sample heated up to 1000 K. The grain size determined from the TEM images was ~87 nm which only slightly differs from the value obtained for 890 K (~81 nm). A HAADF image and the corresponding EDS maps are presented inFig. 8b–f. The elemental maps reveal similar chemical inhomogeneities as observed for 890 K, i.e., Zr/Hf- and Nb/Ti-rich re- gions were identified. After the examination of some Zr/Hf-rich areas, the following concentration ranges were obtained: 41–53% Zr, 27–33%
Hf, 1–15% Nb and 12–17% Ti. Similar investigations for the Nb/Ti-rich regions yielded 32–36% Nb, 22–25% Ti, 21–24% Zr and 18–20% Hf.
The latter volumes most probably related to the bccH phase identified by XRD since the major element Nb has the lowest atomic radius among the four constituents of the alloy. On the other hand, the Zr/Hf-rich regions correspond ambiguously to the bccL phase. Indeed, a highly magnified HAADF image inFig. 9a with the corresponding elemental maps inFig. 9b–e for the alloy annealed to 1000 K reveals that there are Zr/Hf-rich volumes with either bcc or hcp structure. The white cross in Fig. 9b–e indicates a Zr/Hf-rich part where the structure was hcp, while the red cross indicates a Zr/Hf-rich part showing a bcc structure. The corresponding TEM diffraction pattern is shown inFig. 9f. The mea- sured elemental concentrations were 44% Zr, 29% Hf, 13% Ti and 14%
Nb for the bcc phase, and 50% Zr, 36% Hf, 12% Ti and 2% Nb for the hcp phase which was measured on a very thin part of the sample where overlapping of different grains were excluded. This is a reasonable difference between the chemical compositions of the bcc and hcp phases, since among the constituents of this MPEA only Nb has a bcc structure in pure form. Therefore, the higher Nb content could stabilize
the bcc phase while the Nb content below a certain limit formed an hcp structure.
From the TEM-EDS maps, the fraction of the Nb-rich areas was about 70% for both 890 and 1000 K. The Nb-rich regions correspond to phase bccH for which the XRD intensity fraction values were ~54 and
~60% at 890 and 1000 K, respectively. The difference between the XRD and TEM-EDS fractions can be explained by the much smaller volume studied by TEM as compared to XRD. In addition, in the TEM-EDS map we measure the average composition along the beam direction through the local thickness of the TEM lamella. Due to the possible overlap of the grains with different compositions and structures, the separation of the various phases in the map is uncertain.
3.4. Analysis of X-ray line profiles
The breadth and shape of the XRD peak profiles were analyzed for the bcc phase components.Fig. 4illustrates that as a simple approx- imation the overlapping peaks werefitted by the sum of Lorentzian functions, therefore the breadth of the peaks for each bcc phase com- ponent could be determined. The full width at half maximum (FWHM) of the peaks in the reciprocal space was determined as FWHM = cosθ·Δ(2θ)/λwhereθis the Bragg angle,Δ(2θ) is the peak breadth in radians andλis the wavelength of X-rays in nm unit. The FWHM values as a function of the magnitude of the diffraction vector (g = 2·sinθ/λ) are plotted inFig. 10a–c for the bcc components in the HPT-processed specimens followed by annealing at 740 K, 890 K and 1000 K, respectively. This representation of the XRD peak breadths is called as Williamson-Hall plot. For comparison purposes, the peak breadths for the HPT-processed sample are also plotted. It should be noted that this analysis was performed only for six reflections from the seven measured peaks shown inFig. 2by eliminating the XRD peak Fig. 6.BF (a) and HAADF (b) images obtained by (S)TEM for the HPT-processed specimen annealed up to 740 K. The chemical composition for the area shown in (b) was investigated by STEM -EDS. The elemental maps for Hf (c), Nb (d), Ti (e) and Zr (f) are also shown.
with the indices 222 that was weak and noisy.
Fig. 10a shows that for the sample heated up to 740 K the peaks of the bccL phase were broader than the HPT-processed sample while the reflections of the bccH phase were narrower than the peaks of the HPT specimen. After heating up to 890 K, the XRD profiles of both bcc components in the annealed sample were narrower than the peaks of the bcc phase in the HPT-processed sample. In addition, the Wil- liamson-Hall plot reveals that the peak breadths are constant for all reflections for the phase bccH suggesting that the peaks were broadened only due to thefinite size of the diffraction domains (or crystallites in other words). On the other hand, for the phase bccL the peak breadth increases with increasing the magnitude of the diffraction vector, thereby indicating strain broadening in addition to size broadening. The strain broadening can be caused by lattice defects such as dislocations developed during HPT-processing and/or by chemical heterogeneities in the studied phase [25–27]. Thus, it can be concluded that in the phase bccH at 890 K the remaining dislocation density is negligible and there is no considerable chemical inhomogeneity. After heating up to 1000 K as seen inFig. 10c, the phase bccH exhibits strain broadening beside size broadening while for phase bccL only size broadening was observed.
The dislocation density and the diffraction domain size were eval- uated quantitatively from the XRD peak profiles using the CMWPfitting procedure. In this method, the theoretical peak profile is calculated for each reflection assuming that the peak broadening is caused by thefi- nite crystallite size and dislocations.Fig. 11illustrates CMWPfitting of a part of the XRD pattern for the HPT-processed HfNbTiZr MPEA spe- cimen. In order for a better visibility of the agreement between the measured andfitted patterns, only a part of thefitted diffractogram is shown in this figure, but the fitting was carried out in the whole measured diffraction angle range (between 30 and 120°). For the heat
treated samples, the bcc phase was assumed to have two components (bccL and bccH), therefore each measured bcc profile wasfitted with two overlapping theoretical functions which depend on the crystallite sizes and the dislocation densities of the two bcc phase components.
The peaks of the hcp phase were notfitted due to their relatively low intensity; rather they were put into the background. The average dif- fraction domain sizes and the average dislocation densities obtained by the CMWP method are listed inTable 2. In the initial single-phase HPT- processed sample, the diffraction domain size was ~15 nm and the dislocation density was ~219 × 1014m−2. The grain size determined by TEM is slightly larger than the domain size obtained by XLPA. This difference may be caused by the much better statistics of the XLPA method compared to TEM since the former procedure studies orders of magnitude larger volume [27].
In the sample heated up to 740 K, the diffraction domain size of the major bccH phase is ~24 nm and the dislocation density is
~36 × 1014m−2which are higher and lower, respectively, than the values obtained for the HPT specimen. In the meantime, the dislocation density in the bccL phase was similar or only slightly higher than that for the HPT-processed specimen. After annealing up to 890 K, the do- main size in the major bccH phase was ~47 nm and the dislocation density decreased below the lower detection limit for the present XLPA (~1013m−2). This very low dislocation density is in agreement with the lack of strain broadening in the Williamson-Hall plot for this phase (seeFig. 10b). On the other hand, for the phase bccL a relatively large dislocation density of ~164 × 1014m−2was detected. In the specimen heated up to 1000 K, the major bccH phase has a domain size of
~12 nm and a dislocation density of ~92 × 1014m−2while negligible dislocation density was detected for the phase bccL in accordance with the lack of strain broadening in the Williamson-Hall plot (seeFig. 10c).
For this phase, the crystallite size was about 52 nm. It should be noted Fig. 7.BF (a) and HAADF (b) images obtained by (S)TEM for the HPT-processed specimen annealed up to 890 K. The chemical composition for the area shown in (b) was investigated by STEM -EDS. The elemental maps for Hf (c), Nb (d), Ti (e) and Zr (f) are also shown.
that for the annealed samples the real dislocation densities may be somewhat lower than the values obtained by XLPA due to the inevitable counting of chemical inhomogeneities in the bcc phases that may contribute to strain broadening in addition to dislocations.
3.5. Change of the hardness during annealing
Fig. 12shows the evolution of the microhardness as a function of the temperature of annealing for the HPT-processed HfNbTiZr MPEA.
The hardness of the HPT sample was 4420 ± 200 MPa and it remained practically unchanged after annealing up to 740 K. In this state, the hardness was measured as 4610 ± 350 MPa. Thereafter, heating of the HPT sample up to 890 K resulted in softening to 3620 ± 340 MPa.
With increasing the temperature to 1000 K, the hardness further de- creased to 3100 ± 300 MPa.
4. Discussion
4.1. Evolution of the phase composition during annealing
The decomposition of different MPEAs during annealing has been studied both experimentally [19,24,28,29] and theoretically using thermodynamic simulations [19]. To the knowledge of the authors, such an investigation has not been performed for the four-component HfNbTiZr MPEA. In the meantime, the thermal stability of the five- component HfNbTaTiZr HEA has been extensively studied [19,24].
That material contained an additionalfifth component of Ta besides all the four constituents of the presently studied MPEA. Numerical simu- lations with Calphad software revealed the equilibrium phase compo- sition of thefive-component HfNbTaTiZr MPEA in a temperature range between 0 and 2500 °C [19].
Based on the reported data, Fig. 13 shows the variation of the fractions of the equilibrium phases in HfNbTaTiZr alloy as a function of temperature in a range between 400 and 1100 K that is interesting to our research. The dashed vertical lines indicate the temperatures at which our HfNbTiZr MPEA was investigated. It can be seen that at 740 K an Nb/Ta-rich bcc phase and a Zr/Hf/Ti-rich hcp phase coexist with fractions of 45% and 55%, respectively. Contrary to this predic- tion, the present nanocrystalline HfNbTiZr MPEA heat treated up to 740 K contained two bcc phases with different lattice constants. The phase bccH is the main phase with a fraction of 71% while bccL has a higher lattice constant and a fraction of 29% (seeTable 1). Considering the atomic radii of the constituent elements of HfNbTiZr, the phase bccL was most probably enriched in Zr and/or Hf while the phase bccH was enriched in Nb and/or Ti. The existence of a Nb-rich bcc phase is in accordance with the result of the Calphad calculation performed for HfNbTaTiZr (seeFig. 13) but instead of the Zr/Hf-rich hcp phase a bcc phase was detected in our material. The nucleation of the hcp phase in the bcc HfNbTaTiZr and HfNbTiZr alloys may start with a spinodal decomposition, similar to the process observed in HfNbTaZr [30]. Thus, when decomposition starts in the bcc HfNbTiZr alloy most probably the Zr/Hf-rich regions formfirst with maintaining the bcc crystal structure.
If the heat treatment was long enough, the bcc structure in the Zr/Hf- rich volumes would transform into an hcp structure. Therefore, the bccL phase can be considered as an intermediate metastable phase during the formation of a Zr/Hf-rich hcp structure.
Fig. 3andTable 1reveal that at 890 K an hcp phase formed but its fraction is very low (about 5%) and the main phases are the two bcc structures with slightly different lattice constants. EDS elemental maps inFig. 7suggest that the two bcc phases with lower and higher lattice parameters are Nb- and Zr/Hf-rich phases, respectively. Considering the equilibrium phase composition calculated for HfNbTaTiZr (seeFig. 13), Fig. 8.BF (a) and HAADF (b) images obtained by (S)TEM for the HPT-processed specimen annealed up to 1000 K. The chemical composition for the area shown in (b) was investigated by STEM -EDS. The elemental maps for Hf (c), Nb (d), Ti (e) and Zr (f) are also shown.
Fig. 9.A HAADF image (a) and the corresponding elemental maps for Hf (b), Nb (c), Ti (d) and Zr (e) in the case of the sample annealed up to 1000 K after HPT. The white cross indicates a Zr/Hf-rich part where the structure was hcp. The corresponding TEM diffraction pattern is shown in (f). The red cross indicates a Zr/Hf-rich part where the structure was bcc. (For interpretation of the references to colour in thisfigure legend, the reader is referred to the web version of this article.)
Fig. 10.Williamson-Hall plots of the full width at half maximum (FWHM) versus the magnitude of the diffraction vector (g) for the separated profiles of the different phases after annealing at 740 K (a), 890 K (b) and 1000 K (c).
the HPT-processed HfNbTiZr sample annealed up to 890 K is yet far from equilibrium since a higher hcp phase content would be expected.
Nevertheless, the lattice constants of the bccL phase decreased com- pared to 740 K due to the precipitation of the hcp structure from this phase since the hcp phase is richer in Zr and Hf. The lattice constant of
the bccH phase in HfNbTiZr increased when the temperature changed from 740 to 890 K. Calphad calculation for HfNbTaTiZr also revealed similar trend which was caused by the decrease of the Nb content in this phase with increasing temperature (see Fig. 8d in [19]).
At 1000 K, the Calphad simulation for the HfNbTaTiZr alloy sug- gests the co-existence of three phases: a Nb/Ta-rich bcc phase with the fraction of ~45%, another bcc phase enriched in Ti, Zr and Hf (fraction:
~20%) and a Zr/Hf/Ti-rich hcp phase with the fraction of ~35%. Our sample also contained two bcc phases and one hcp structure, although their experimentally determined fractions differ from the values cal- culated for HfNbTaTiZr. Both the bccL phase with higher lattice con- stant and the hcp phase surely correspond to the Zr/Hf-rich regions in the present four-element MPEA heated up to 1000 K. The EDS analysis at the bcc and hcp areas inFig. 9suggested that the hcp phase is more depleted from Nb than the bcc phase (see the compositions inSection 3.3). This conclusion is reasonable since Nb is the only element in the four constituents having a bcc structure in a pure form while the others have an hcp structure. Thus, Nb tends to stabilize a bcc structure in the HfNbTiZr MPEA and when the Nb content decreases under a limit, the alloy transforms into an hcp structure. It should be emphasized that the bccL phase at 890 K differs from the bccL phase at 1000 K. At 1000 K, the bccL phase is a newly nucleated Zr/Hf-rich structure as suggested by Calphad simulations for HfNbTaTiZr [19]. All other bcc volumes are in the bccH phase. The center of the broad peak of bccH phase is at a relatively high angle at 1000 K due to the enrichment of this phase with Nb since both the hcp and the Zr/Hf-rich bcc phases contain low amount of Nb.
The differences between the phase composition measured on the HfNbTaTiZr and HfNbTiZr alloys at 1000 K can be explained by (i) the apparently different chemical compositions of the two alloys, (ii) the present DSC annealing was short so that there was not enough time to achieve the equilibrium at 1000 K and (iii) the XRD intensity fractions listed in Table 1may differ from the mole fractions of the phases.
Nevertheless, the higher the temperature of the DSC annealing for the HPT-processed HfNbTiZr MPEA, the closer its phase composition to the simulated results obtained for HfNbTaTiZr. For a more reliable theo- retical assessment of the evolution of the phase composition in the HfNbTiZr MPEA, simulations for this composition are necessary which is out of the scope of this study.
4.2. Effect of heat treatment on microstructure
The changes in the XRD peak profiles revealed the evolution of the Fig. 11.CMWPfitting showing only for a part of the diffractogram taken on the
HPT-processed sample. The black open circles and the blue solid line show the measured and thefitted patterns, respectively. The difference between them is shown at the bottom of thefigure. (For interpretation of the references to colour in thisfigure legend, the reader is referred to the web version of this article.)
Table 2
The diffraction domain size and the dislocation density determined by XLPA for the bcc phases, as well as the grain size obtained by TEM. BccL and bccH in- dicate the bcc phases for which the XRD peaks appeared at lower and higher diffraction angles, respectively (seeFig. 3).
State of material Phases Diffraction domain size [nm]
Dislocation density [1014m−2]
Grain size [nm]
10 HPT bcc 15 ± 2 219 ± 24 33
10 HPT + 740 K bccL 24 ± 4 265 ± 45 38
bccH 24 ± 3 36 ± 5
10 HPT + 890 K bccL 21 ± 3 164 ± 18 81
bccH 47 ± 6 < 0.1
10 HPT + 1000 K bccL 52 ± 6 < 0.1 87
bccH 12 ± 2 92 ± 10
Fig. 12.The hardness versus the annealing temperature.
Fig. 13.The variation of the fractions of the different phases for HfNbTaTiZr MPEA as a function of the temperature as calculated from former Calphad modeling [13].
microstructure after heating up to different temperatures. At 740 K, the HPT-processed microstructure was recovered partially, namely in phase bccH, the dislocation density decreased from ~219 × 1014 m−2to
~36 × 1014 m−2 while the grain and diffraction domain sizes in- creased slightly (seeTable 2). At the same time, the dislocation density in phase bccL did not decrease. As the lattice constant of this phase was higher than for the HPT-processed sample, the bccL phase was surely enriched with large atoms such as Zr and Hf. Larger atoms pin dis- locations more effectively, which may cause a less pronounced or negligible recovery in the phase bccL. Considering the phase fractions and the dislocation densities listed inTables 1 and 2, respectively, the average dislocation density decreased from ~219 × 1014 m−2 to
~102 × 1014 m−2during heating up to 740 K. It should be noted, however, that the peaks of the phase bccL were relatively weak (see Fig. 3), therefore the parameters of the microstructure determined from these peaks have a higher uncertainty. It is also noted that although the peak breadths for the phase bccL at 740 K are higher than that for the HPT-processed sample in the Williamson-Hall plot shown inFig. 10a, this is not in a contradiction with the similar microstructural para- meters of the bccL phase and the HPT specimen (see Table 2). This apparent dichotomy was caused by the fact that for the Williamson-Hall plots the peak breadths were determined by the decomposition of the overlapping XRD peaks using Lorentzian functions while in the CMWP analysis the peak profile functions were calculated directly from the microstructure and these functions usually have no Lorentzian shape.
Nevertheless, the Lorentzian decomposition of XRD profiles is a suitable method for revealing the difference in the peak breadth evolutions for the bccL and bccH phases.
After heating up to 890 K, the dislocation density further decreased in both the bccL and bccH phases and the diffraction domain size in- creased to about 47 nm in the bccH phase (seeTable 2). In addition, the grain size determined by TEM increased from ~38 to ~81 nm when the temperature increased from 740 to 890 K (seeFig. 14), which suggests that grain coarsening occurred in addition to recovery in this tem- perature range. Using the fractions and the dislocation densities of the two bcc phases, an average dislocation density of ~67 × 1014m−2was calculated for the sample annealed to 890 K. It should be noted that the chemical inhomogeneities can also cause strain-like broadening of the XRD profiles. Namely, the chemical heterogeneities can yield a spatial variation of the lattice spacing in the material, thereby resulting in an XRD peak broadening which resembles the broadening caused by mi- crostrains [25–27]. Therefore, the dislocation density values de- termined by XLPA and listed inTable 2for 890 K may overestimate the real values, i.e., the average dislocation density may be lower than
~67 × 1014m−2.
After heating the HPT-processed MPEA up to 1000 K, chemical in- homogeneities were observed (seeSection 3.3), therefore the measured dislocation density of ~92 × 1014 m−2for the phase bccH may be larger than the real value. Even if this situation occurs, the average dislocation density cannot be higher than ~55 × 1014m−2, i.e., the recovery of the microstructure certainly continued between 890 and 1000 K. In this averaging, the bccL phase with narrow XRD peaks was also taken into account. This phase is practically defect-free according to the Williamson-Hall analysis of the XRD profiles (seeFig. 10), i.e., the peaks were broadened only due to the small diffraction domain size.
The bccL phase at 1000 K is a Zr/Hf-rich bcc structure which most probably was newly nucleated between 890 and 1000 K as suggested by the phase fraction evolution calculated for the HfNbTaTiZr MPEA using Calphad software (seeFig. 13). As noted earlier in the TEM-EDS ex- periments, there is a large scattering in the Nb concentration of the Zr/
Hf-rich part of the sample heated up to 1000 K.Fig. 9suggests that the regions with a few percentages of Nb were transformed into a hcp structure. As this hcp phase has a relatively low intensity fraction (about 12%), its peak profiles were not evaluated for the microstructure by the CMWP software. However, the peak breadth analysis indicates that the diffraction domain size of the hcp phase was about 30–40 nm.
On the basis of the results obtained for the variation of the phase composition and the microstructure during annealing, the processes occurring during the heat treatments in the different temperature re- gions are summarized inTable 3by considering these processes as the sources of the exothermic heats evolved in the DSC thermogram as shown inFig. 1. Up to 740 K, the decomposition into two bcc phases and the recovery in the bccH phase contributed to the heat released during annealing. Beside dislocations, the annihilation of other defects, such as vacancies, may also have a contribution to the exotherm peak evolved between 400 and 740 K as reported earlier that a very high excess vacancy concentration in the order of magnitude of 10−4can form during SPD-processing [31–33]. Between 740 and 890 K, recovery in both bcc phases, grain growth and nucleation of a new hcp phase yielded the heat evolution. Finally, between 890 and 1000 K further recovery, increase of the hcp phase fraction and nucleation of a new Zr/
Hf-rich bcc phase occurred and these processes contributed to the heat released during the DSC experiment.
4.3. Influence of the microstructure changes on the hardness
The hardness variation due to heating up to 740, 890 and 1000 K was revealed in Fig. 12. The microhardness of the HPT-processed HfNbTiZr MPEA remained unchanged after annealing up to 740 K even if the average dislocation density decreased from ~219 × 1014m−2to
~102 × 1014m−2. The softening effect of this recovery may be com- pensated by the annealing-induced hardening phenomena [34–37]. It has been shown that annealing of nanocrystalline alloys can result in hardening due to the annihilation of mobile dislocations and the re- laxation of grain boundaries. The relaxed grain boundaries can emit dislocations harder than the boundaries in the SPD-processed materials, thereby resulting in hardening. This effect usually occurs only at moderate temperatures (0.3–0.4 ×Tm, whereTmis the melting point) and this temperature range corresponds to 620–820 K for the HfNbTiZr MPEA. Therefore, the anneal-hardening can compensate the softening caused by recovery and yielding an unchanged hardness at 740 K. Be- tween 740 and 890 K there is a significant softening that may be caused by the considerable increase of the grain size and the further reduction of the dislocation density. Between 890 and 1000 K, further grain coarsening was not observed but the average dislocation density slightly decreased. This effect can explain the slight softening between 890 and 1000 K.
5. Summary and conclusions
The thermal stability of the nanostructure formed during HPT- Fig. 14.The grain size determined by TEM versus the annealing temperature.
MPEA decomposed into two bcc structures with lower (~0.3427 nm) and higher (~0.3485 nm) lattice constants as com- pared to the initial state (~0.3438 nm). The major bcc phase with the lower lattice parameter exhibited a recovery where the dis- location density considerably decreased from ~219 × 1014m−2to
~36 × 1014 m−2 while the grain size remained consistent (~20 nm). The hardness remained unchanged (~4500 MPa) after annealing up to 740 K. Most probably, the softening caused by re- covery was compensated by the hardening induced by grain boundary relaxation and annihilation of mobile dislocations, re- sulting in an unchanged hardness.
2. The heat treatment between 740 and 890 K resulted in the nuclea- tion of a Zr/Hf-rich hcp phase with a low XRD intensity fraction of about 5%. At 890 K, the major bcc phase had two components with slightly different lattice constants. These two components are Zr/Hf- rich and Nb-rich bcc structures with higher and lower lattice para- meters, respectively. Due to recovery, lowering of dislocation den- sity towards < 1013 m−2 was more pronounced in the Nb-rich phase, while the grain size significantly increased to ~81 nm. The hardness decreased from ~4500 to ~3600 MPa due to these changes in the microstructure.
3. Annealing up to 1000 K led to an increase of the XRD intensity fraction of the Zr/Hf-rich hcp phase to ~12%. In addition, a defect- free Zr/Hf-rich bcc phase was formed. The increase of the grain size between 890 and 1000 K was marginal (from ~81 to ~87 nm) while a decrease of the dislocation density was also detected. These mi- crostructural changes yielded only a slight decrease of the hardness from ~3600 to ~3100 MPa between 890 and 1000 K.
Declaration of competing interest
The authors declare that they have no known competingfinancial interests or personal relationships that could have appeared to influ- ence the work reported in this paper.
Acknowledgement
This work was supported in part by the Ministry of Human Capacities of Hungary within the ELTE University Excellence program (1783-3/2018/FEKUTSRAT); in part by the grant no. VEKOP-2.3.3-15- 2016-00002 of the European Structural and Investment Funds; and in part by the National Science Foundation of the United States under Grant No. DMR-1810343. The preparation of the TEM lamellae by Levente Illés is also acknowledged.
Data availability
The raw/processed data required to reproduce thesefindings cannot be shared at this time due to technical or time limitations.
[4] B. Gludovatz, A. Hohenwarter, D. Catoor, Edwin H. Chang, E. P. George, R. O.
Ritchie, A fracture-resistant high-entropy alloy for cryogenic applications, Science 345 (2014) 1153–1158.
[5] M.H. Chuang, M.H. Tsai, W.R. Wang, S.J. Lin, J.W. Yeh, Microstructure and wear behavior of AlxCo1.5CrFeNi1.5Tiy high-entropy alloys, Acta Mater. 59 (2011) 6308–6317.
[6] P. Kozelj, S. Vrtnik, A. Jelen, S. Jazbec, Z. Jaglicic, S. Maiti, M. Feuerbacher, W. Steurer, J. Dolinsek, Discovery of a superconducting high-entropy alloy, Phys.
Rev. Lett. 113 (2014) 107001.
[7] O.N. Senkov, D.B. Miracle, K.J. Chaput, J.P. Couzinie, Development and exploration of refractory high entropy alloys—a review, J. Mater. Res. 33 (2018) 3092–3128.
[8] Y.D. Wu, Y.H. Cai, T. Wang, J.J. Si, J. Zhu, Y.D. Wang, X.D. Hui, A refractory Hf25Nb25Ti25Zr25high-entropy alloy with excellent structural stability and tensile properties, Mater. Lett. 130 (2014) 277–280.
[9] J. Gubicza, A. Heczel, M. Kawasaki, J.K. Han, Y. Zhao, Y. Xue, S. Huang, J.L. Lábár, Evolution of microstructure and hardness in Hf25Nb25Ti25Zr25high-entropy alloy during high-pressure torsion, J. Alloys Compd. 788 (2019) 318–328.
[10] M.J. Haché, C. Cheng, Y. Zou, Nanostructured high-entropy materials, J. Mater.
Res. 35 (2020) 1051–1075.
[11] F. Otto, A. Dlouhý, K.G. Pradeep, M. Kuběnová, D. Raabe, G. Eggeler, E.P. George, Decomposition of the single-phase high-entropy alloy CrMnFeCoNi after prolonged anneals at intermediate temperatures, Acta Mater. 112 (2016) 40–52.
[12] B. Schuh, B. Völker, V. Maier-Kiener, J. Todt, J. Li, A. Hohenwarter, Phase de- composition of a single-phase AlTiVNb high-entropy alloy after severe plastic de- formation and annealing, Adv. Eng. Mater. 19 (2017) 1600674.
[13] M.E. Bloomfield, K.A. Christofidou, N.G. Jones, Effect of Co on the phase stability of CrMnFeCoxNi high entropy alloys following long-duration exposures at inter- mediate temperatures, Intermetallics 114 (2019) 106582.
[14] K.A. Christofidou, E.J. Pickering, P. Orsatti, P.M. Mignanelli, T.J.A. Slater, H.J. Stone, N.G. Jones, On the influence of Mn on the phase stability of the CrMnxFeCoNi high entropy alloys, Intermetallics 92 (2018) 84–92.
[15] K.A Christofidou, T.P. McAuliffe, P.M. Mignanelli, H.J. Stone, N.G. Jones, On the prediction and the formation of the sigma phase in CrMnCoFeNix high entropy alloys, Journal of Alloys and Compounds 770 (2019) 285–293.
[16] N.Y. Yurchenko, N.D. Stepanov, M.A. Tikhonovsky, G.A. Salishchev, Phase evolu- tion of the AlxNbTiVZr (x=0; 0.5; 1; 1.5) high entropy alloys, Metals 6, no. 12 (2016) 298.
[17] N.Y. Yurchenko, N.D. Stepanov, A.O. Gridneva, M.V. Mishunin, G.A. Salishchev, S.V. Zherebtsov, Effect of Cr and Zr on phase stability of refractory Al-Cr-Nb-Ti-V-Zr high-entropy alloys, J. Alloys Compd. 757 (2018) 403–414.
[18] B. Schuh, F. Mendez-Martin, B. Völker, E.P. George, H. Clemens, R. Pippan, A. Hohenwarter, Mechanical properties, microstructure and thermal stability of a nanocrystalline CoCrFeMnNi high-entropy alloy after severe plastic deformation, Acta Mater. 96 (2015) 258–268.
[19] B. Schuh, B. Völker, J. Todt, N. Schell, L. Perrière, J. Li, J.P. Couzinié, A. Hohenwarter, Thermodynamic instability of a nanocrystalline, single-phase TiZrNbHfTa alloy and its impact on the mechanical properties, Acta Mater. 142 (2018) 201–212.
[20] N.D. Stepanov, N.Y. Yurchenko, S.V. Zherebtsov, M.A. Tikhonovsky,
G.A. Salishchev, Aging behavior of the HfNbTaTiZr high entropy alloy, Mater. Lett.
211 (2018) 87–90.
[21] R.B. Figueiredo, P.R. Cetlin, T.G. Langdon, Usingfinite element modeling to ex- amine theflow processes in quasi-constrained high-pressure torsion, Mater. Sci.
Eng. A 528 (2011) 8198–8204.
[22] J.B. Nelson, D.P. Riley, An experimental investigation of extrapolation methods in the derivation of accurate unit-cell dimensions of crystals, Proc. Phys. Soc. 57 (1945) 160–177.
[23] G. Ribárik, J. Gubicza, T. Ungár, Correlation between strength and microstructure of ball-milled Al–Mg alloys determined by X-ray diffraction, Mater. Sci. Eng. A 387 (2004) 343–347.
[24] J.Q. Yao, X.W. Liu, N. Gao, Q.H. Jiang, N. Li, G. Liu, W.B. Zhang, Z.T. Fan, Phase stability of a ductile single-phase BCC Hf0.5Nb0.5Ta0.5Ti1.5Zr refractory high-entropy alloy, Intermetallics 98 (2018) 79–88.
[25] A. Leineweber, E.J. Mittemeijer, Diffraction line broadening due to lattice-
parameter variations caused by a spatially varying scalar variable: its orientation dependence caused by locally varying nitrogen content inε-FeN0.433, J. Appl.
Crystallogr. 37 (2004) 123–135.
[26] A. Leineweber, E.J. Mittemeijer, Anisotropic microstrain broadening due to com- positional inhomogeneities and its parametrisation, Z. Krist. (Supplement 23) (2006) 117–122.
[27] J. Gubicza, X-ray Line Profile Analysis in Materials Science, IGI-Global, Hershey, USA, 2014.
[28] D. Kumar, O. Maulik, S. Kumar, Y.V.S.S. Prasad, V. Kumar, Phase and thermal study of equiatomic AlCuCrFeMnW high entropy alloy processed via spark plasma sin- tering, Mater. Chem. Phys. 210 (2018) 71–77.
[29] V. Chaudhary, B. Gwalani, V. Soni, R.V. Ramanujan, R. Banerjee, Influence of Cr Substitution and Temperature on Hierarchical Phase Decomposition in the AlCoFeNi High Entropy Alloy, Scientific Reports 8 (2018) 15578.
[30] T.Y. Liu, J.C. Huang, W.S. Chuang, H.S. Chou, J.Y. Wei, C.Y. Chao, Y.C. Liao, J.S.C. Jang, Spinodal decomposition and mechanical response of a TiZrNbTa high- entropy alloy, Materials 12 (2019) 3508.
[31] E. Schafler, G. Steiner, E. Korznikova, M. Kerber, M.J. Zehetbauer, Lattice defect investigation of ECAP-Cu by means of X-ray line profile analysis, calorimetry and
electrical resistometry, Mater. Sci. Eng. A 410-411 (2005) 169–173.
[32] D. Setman, E. Schafler, E. Korznikova, M.J. Zehetbauer, The presence and nature of vacancy type defects in nanometals detained by severe plastic deformation, Mater.
Sci. Eng. A 493 (2008) 116–122.
[33] J. Gubicza, Defect Structure and Properties of Nanomaterials, WoodheadPublishing, Duxford, UK, 2017.
[34] A.A. Popov, I.Y. Pyshmintsev, S.L. Demakov, A.G. Illarionov, T.C. Lowe, A.V. Sergeyeva, R.Z. Valiev, Structural and mechanical properties of nanocrystal- line Ti processed by severe deformation processing, Scripta Mater. 37 (1997) 1089–1094.
[35] A. Hasnaoui, H. Van Swygenhoven, P.M. Derlet, On non-equilibrium grain bound- aries and their effect on thermal and mechanical behaviour: a molecular dynamics computer simulation, Acta Mater. 50 (2002) 3927–3939.
[36] N.Q. Vo, J. Schafer, R.S. Averback, K. Albe, Y. Ashkenazy, P. Bellon, Reaching theoretical strengths in nanocrystalline Cu by grain boundary doping, Scripta Mater. 65 (2011) 660–663.
[37] J. Gubicza, Annealing-induced hardening in ultrafine-grained and nanocrystalline materials, Adv. Eng. Mater. 22 (2020) 1900507.