Intermetallics 142 (2022) 107445
0966-9795/© 2021 The Author(s). Published by Elsevier Ltd. This is an open access article under the CC BY license (http://creativecommons.org/licenses/by/4.0/).
Thermal stability of nanocrystalline CoCrFeNi multi-principal element alloy: Effect of the degree of severe plastic deformation
Pham Tran Hung
a, Megumi Kawasaki
b, Jae-Kyung Han
b, Abel Szab ´ ´ o
a, J anos L. L ´ ´ ab ´ ar
a,c, Zolt ´ an Heged us ˝
d, Jen ˝ o Gubicza
a,*aDepartment of Materials Physics, E¨otv¨os Lor´and University, Budapest, P.O.B. 32, H-1518, Hungary
bSchool of Mechanical, Industrial and Manufacturing Engineering, Oregon State University, Corvallis, OR, 97331, USA
cInstitute for Technical Physics and Materials Science, Centre for Energy Research, Budapest, Hungary
dDeutsche Elektronen-Synchrotron DESY, 22607, Hamburg, Germany
A R T I C L E I N F O Keywords:
CoCrFeNi multi-principal element alloy High-pressure torsion
Thermal stability Dislocations Released heat Hardness
A B S T R A C T
The effect of the degree of severe plastic deformation (SPD) on the thermal stability of a nanocrystalline CoCrFeNi multi-principal element alloy was studied. The SPD method of high-pressure torsion (HPT) was utilized to achieve the nanocrystalline microstructure. The structural stability was investigated near the centers and edges of the HPT-processed disks deformed for ½, 1, 5 and 10 turns. For almost all studied samples, two exothermic peaks in the temperature ranges of 600–750 and 750–950 K were observed by differential scanning calorimetry (DSC) between room temperature and 1000 K. The saturation released heat value for the first DSC peak was about 4 J/g that was achieved at the shear strain of ~200. For the second exothermic peak, the released heat saturated at the shear strain of about 20 with the value of about 6–7 J/g. It was revealed that the first DSC peak is related to the annihilation of dislocations for low degree of deformation. At the same time, for edge parts of the disks processed by one or higher numbers of turns the vacancy annihilation has also a major contribution to the first exothermic peak. The annihilated vacancy concentration estimated from the released heat was be- tween (0.6–0.9) ×10−3. The second DSC peak was related to the disappearance of grain boundaries due to recrystallization and annihilation of the remaining dislocations. The HPT-processed CoCrFeNi MPEA samples exhibited very high hardness values between 4000 and 5100 MPa, depending on the number of turns and the location along the disk radius. The hardness decreased only during the second exothermic peak when recrys- tallization occurred.
1. Introduction
Conventionally, alloys are designed based on a single element, with a small addition of other constituents. Recently, multi-principal element alloys (MPEAs), including high-entropy alloys (HEAs), were developed, which are produced with multiple principal elements of equimolar or near equimolar ratios [1,2]. This new type of alloys presents a vast number of new materials with excellent mechanical properties, such as high strength [3–5], high fatigue, wear and corrosion resistance [6–8].
One property of MPEAs is having high mixing entropy, which stabilizes the solid solution phase [9]. However, heat treatment often causes phase decomposition in MPEAs [10,11]. It has been reported both theoreti- cally and experimentally that CoCrFeNi alloy maintains a single phase solid solution even after subjected to severe plastic deformation (SPD)
and heat treatment [12–15]. Additionally, CoCrFeNi MPEAs show outstanding mechanical properties even at high temperatures [15,16].
In addition to the chemical composition, microstructure can also drastically influence the mechanical properties of MPEAs. Different material processing routes have been utilized to produce fine-grained MPEAs with high strength. One powerful method for manufacturing bulk nanocrystalline MPEAs is SPD [17], among which high-pressure torsion (HPT) can yield the highest imposed strain, resulting in contamination-free nanocrystalline MPEAs [11,15,18,19]. For a CoCr- FeNi MPEA, after 10 turns of HPT the grain size was reduced by three orders of magnitude from about 20 μm to ~60 nm, and the lattice defect density increased concomitantly, which enhanced the hardness from
~1400 MPa to ~5100 MPa [15].
In many applications of metallic components, materials are subjected
* Corresponding author.
E-mail address: jeno.gubicza@ttk.elte.hu (J. Gubicza).
Contents lists available at ScienceDirect
Intermetallics
journal homepage: www.elsevier.com/locate/intermet
https://doi.org/10.1016/j.intermet.2021.107445
Received 8 September 2021; Received in revised form 15 November 2021; Accepted 18 December 2021
to an elevated temperature. Therefore, a careful study of the thermal stability of the phase composition and the nanostructure of SPD- processed MPEAs is essential since they influence the mechanical and functional properties of materials. Former investigations on different nanocrystalline and ultrafine-grained (UFG) metallic materials indi- cated that annealing at moderate temperatures for short times can improve the ductility while the strength only decreased slightly [20–22]. In fact, short time heat treatment can yield annealing-induced hardening [23]. This effect was also observed in MPEAs [24].
While the phase stability of MPEAs after annealing was extensively studied [24–28], the evolution of microstructure was not characterized carefully (e.g. Ref. [11]). Plastic deformation can also influence the microstructure evolution occurring during heat treatment. For the Al–Zn–Mg alloys, aging at 473 K results in GP zones and η′/η pre- cipitates with spherical and rod-like shapes. On the other hand, if equal-channel angular pressing (ECAP) process is conducted during aging, only spherical precipitates can be observed [29]. In case of a CoCrFeMnNi HEA, subsequent annealing at 600–700 ◦C after cold-rolling formed Cr-rich precipitates, which does not appear in the non-deformed HEA after annealing in a comparable time scale. The precipitations also show a strong spatial correlation with the disloca- tions formed during deformation [30].
This paper aims to reveal the relation between deformation induced by HPT and the evolution of microstructure and hardness after heat treatment of an equi-molar CoCrFeNi MPEA. The samples were pro- cessed by 1/2, 1, 5 and 10 turns of HPT, which are subsequently annealed by DSC and the result thermogram was used to determine the characteristic temperature of microstructure evolution. The specimens at ~1 and 4 mm from the center of the HPT disks are then heated up to the selected temperatures for the investigation of microstructure and hardness. The evolution of grain sizes was studied by electron back scattered diffraction (EBSD) and transmission electron microscopy (TEM), while the change in lattice defects structure (dislocations and twin faults) was characterized using X-ray line profile analysis (XLPA).
To the knowledge of the authors, this is the first study that examines the evolution of microstructure when varying both the degree of shear strain and the heat treatment process. Since electron microscopy and X-ray diffraction inspect the surface of the specimens, while DSC probes the bulk properties, synchrotron X-ray diffraction was utilized to verify the homogeneity of microstructure across the depth of the samples.
2. Material and methods 2.1. Processing of material
The Co25Cr25Fe25Ni25 MPEA was manufactured from a mixture of four pure components (purity >99.9 wt%) by utilizing the technique of vacuum induction melting and drop casting. The cast ingot has an initial thickness of ~39 mm, which was subsequently reduced to ~14 mm by hot rolling at 1050 ◦C. The sample was heat treated at 1100 ◦C to obtain a homogeneous material, from which cylindrical billets with 10 mm diameter were machined. Lastly, electric discharge machining (EDM) was used to slice the billets into disks. The final thickness of the disks was ~0.85 mm. For the HPT process, a conventional HPT facility with quasi-constrained set-up was utilized [31]. The disks were processed by HPT for ½, 1, 5 and 10 turns, operating at room temperature under 6 GPa at 1 rpm.
2.2. Differential scanning calorimetry
The CoCrFeNi MPEA was investigated at two different radii of each HPT disk to study the effect of different degree of shear strain on the thermal stability. A diamond saw was used to cut small pieces from the disk close to the center and the edge parts of the HPT-processed disks, so that the thermal stability can be investigated in a wide range of shear strain that is proportional to the distance from the disk center. Since for
the calorimetry experiments more than one sample with a reasonable size were needed, samples exactly in the center and edge of the disks could not be cut. Therefore, the middle of the “center” sample was located ~0.75 mm from the disk center and had a width of ~1.1 mm parallel to the radial direction of the HPT disk. For the “edge” specimen, the middle point was ~4.35 mm from the disk center and its width was
~1.3 mm. For both samples, the height was ~3 mm (the size of the specimens perpendicular to the radial direction of the HPT disk).
Thereafter, these specimens are called as “center” and “edge” samples even if they are about 0.7 mm from the real center and edge of the HPT disk.
Differential scanning calorimetry (DSC) was applied for the anneal- ing process, using a Perkin Elmer (DSC2) calorimeter. First, the speci- mens were heated up to the maximum test temperature of 1000 K with a heating rate of 40 K/min under Ar atmosphere in order to obtain ther- mograms, from which the characteristic temperatures of the evolution of the microstructure were determined. Each individual samples were then heated to reach these temperatures at a rate of 40 K/min, followed by quenching to room temperature at a cooling rate of about 300 K/min for the microstructure investigation.
2.3. Microstructure study by electron microscopy
Microstructure at the center of the disk specimen after HPT for ½ turn and for all HPT-processed samples heated up to 1000 K was studied by electron backscatter diffraction (EBSD). The other samples were inves- tigated using transmission electron microscopy (TEM) due to the small grain size and large lattice distortion. For the EBSD investigation, an FEI Quanta 3D scanning electron microscope (SEM) was employed. Since the surface quality significantly influences the results from EBSD method, the specimen surfaces were treated first with mechanical pol- ishing, conducted by using abrasive paper with 1200, 2500 and 4000 grit, and afterward with a 1 μm colloidal alumina suspension. The me- chanical polishing process is finished with a colloidal silica suspension (OP–S) with a particle size of 40 nm. Lastly, electropolishing was applied using an electrolyte composed of 70% ethanol, 20% glycerine and 10%
perchloric acid (in vol%). The evaluation of the EBSD images was con- ducted using the Orientation Imaging Microscopy (OIM) software. In the evaluation of the EBSD images, the areas bounded by high-angle boundaries with misorientations higher than 15◦ were considered as grains.
The severely deformed microstructure in the HPT-processed samples may be sensitive to the increase of temperature during TEM sample preparation by ion milling. Therefore, for these samples the TEM lamellae were prepared using focused ion beam (FIB) technique starting from the piece of polished material. First, a 50 μm thick lamella was cut by Ga+ions at 7 keV, which was further thinned at 3 keV and then at 1 keV to remove the damaged layers. The samples annealed at high tem- peratures are not sensitive to the slight temperature rise, therefore for these specimens the TEM lamellae were prepared by Ar-ion milling.
First, the samples were glued to a Cu-stub for cutting at 150 ◦C for not more than 1 min. Second, the piece was embedded in a Ti-disk with a two-component glue, cured at 120 ◦C for 15 min and ground with 2000 grit paper down to 60 μm. Next, the ion-beam thinning was started at 10 keV using 3 mA ion-current. Finally, the damaged layers were removed from the surface of the just perforated lamella by cleaning at 3 keV and 1 mA from both sides. The TEM investigation was carried out with a Titan Themis G2 200 scanning transmission electron microscope (STEM) operated at 200 kV. The TEM images were recorded with a CETA 16 M camera using VELOX program.
2.4. Microstructure characterization by X-ray diffraction
X-ray line profile analysis (XLPA) was utilized for the characteriza- tion of microstructure of CoCrFeNi MPEA. The sample surfaces were treated in the same manner as for the EBSD examination (see section
2.3). The XLPA measurement was conducted using a diffractometer with monochromatic CoKα1 radiation (wavelength: λ =0.1789 nm) and a single crystal Ge monochromator. The beam size was 2 ×0.2 mm2 and the longer beam side was perpendicular to the radial direction of the HPT disk. The diffractograms were used to determine the microstructure using the Convolutional Multiple Whole Profile (CMWP) fitting method [32]. This process involves fitting the measured diffraction pattern with theoretical profiles, calculated as the convolution of the peaks caused by diffraction domain size, dislocations and twin faults. The dislocation contrast factors were exploited to correct for the anisotropy of the strain broadening caused by dislocations [32]. For crystals with face centered cubic (fcc) structure such as CoCrFeNi MPEA, the dislocation contrast factors can be determined from the parameters Ch00 and q. For CoCr- FeNi MPEA, these values were calculated in a former study [15], and the value of Ch00 is 0.32 for both edge and screw dislocations, while q has the values of 1.72 and 2.49 for edge and screw dislocations, respectively.
From the CMWP evaluation, the area-weighted mean diffraction domain size (<x>), the dislocation density (ρ) and the twin fault probability (β) of the materials can be quantified.
The variation of the microstructure through the thickness of the HPT- processed disks was investigated by synchrotron X-ray diffraction measurements. These measurements were carried out at the Swedish Materials Science beam line (P21.2) at the Deutsches Elektronen- Synchrotron (DESY). The beam energy was set to 82.5 keV (λ = 0.01503 nm), and the beam was focused to a size of 2.2 ×7 μm2. Each sample was measured at the center and the edge of the HPT-processed disk. At each radial position, measurements were carried out through the full thickness of the sample, with a step size of 10 μm. Each pattern was collected while the sample was moved horizontally perpendicular to the beam by 200 μm, resulting in a larger scattering volume and better statistics. The sample to detector distance (995 mm) was calibrated with a NIST SRM660c standard LaB6 powder and the patterns were collected with a Varex XRD 4343CT flat panel detector with an active area of 430
×430 mm2 and a pixel size of 150 ×150 μm2. The recorded 2-dimen- sional images were integrated with the pyFAI software package [33]
leading to the usual (intensity vs. diffraction angle) patterns.
2.5. Hardness test
A Zwick Roell ZHμ Vickers indenter was used to determine the hardness of the HPT-processed as well as the annealed samples. A similar surface treatment that performed for EBSD investigation as described in section 2.3 was implemented before the hardness testing. Ten indenta- tion tests were conducted and averaged to obtain the final mean microhardness.
3. Results
3.1. Analysis of the DSC thermograms
Fig. 1 shows the DSC thermograms obtained for the center and the edge parts of the CoCrFeNi disks processed by ½, 1, 5 and 10 turns of HPT. Except the center of the disk processed for ½ turn, the thermograms contain two exothermic peaks. The first DSC peak starts at about 600 K and finishes at about 700–750 K. The second peak starts at 750–800 K and ends at about 900–950 K. For the center of the disk deformed by ½ turn, the first peak was not detected.
The areas under the DSC peaks are listed in Table 1. These values
Fig. 1. DSC thermograms obtained at the center and the edge of the CoCrFeNi disks processed by (a) ½, (b) 1, (c) 5 and (d) 10 turns.
Table 1
The heat released during the 1st and 2nd DSC peaks at the center and edge parts of the disks processed for different numbers of HPT turns.
Number of
turns Location Heat released in the 1st
DSC peak [J/g] Heat released in the 2nd DSC peak [J/g]
½ center 0 ±0.2 3.1 ±0.5
edge 2.1 ±0.2 6.9 ±0.7
1 center 1.1 ±0.2 4.3 ±0.5
edge 3.0 ±0.3 6.1 ±0.6
5 center 1.7 ±0.2 5.9 ±0.6
edge 4.4 ±0.5 5.8 ±0.6
10 center 1.6 ±0.2 6.6 ±0.7
edge 4.4 ±0.5 6.5 ±0.7
give the heat released during the first and second exothermic peaks. In the disk center, the area of the first DSC peak increased from zero to about 1.7 J/g when the number of turns increased from ½ to 5. Between 5 and 10 turns, there was no additional changes in the release heat at the first peak and this statement is also valid for the second DSC peak measured at the center as well as for both exothermic peaks measured at the HPT disk edge. This means that saturation in the stored energy was achieved after 5 turns of HPT. For the disk edges, the first DSC peak area was enhanced from ~2.1 to ~4.4 J/g between ½ and 5 turns, i.e., the heat released in the first peak was larger for the edge than for the center.
The area of the second DSC peak in the disk center was larger than the first one and its value increased from about 3 to 6 J/g when the number of turns increased from ½ to 5. For the disk edge, the saturation value of the area of the second DSC peak (6–7 J/g) was achieved even after ½ turn of HPT. The appearance of the exothermic peaks on the DSC ther- mograms suggests that recovery and/or recrystallization occurred dur- ing annealing of the nanocrystalline CoCrFeNi MPEA. Therefore, the evolution of the microstructure during the heat treatment was moni- tored by XLPA and TEM, and the results are presented in the following sections.
3.2. Microstructure evolution as determined by XLPA
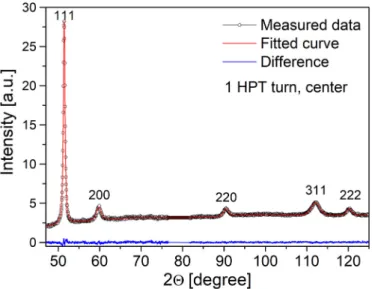
XLPA were used to determine the microstructure characteristics, including the average diffraction domain (or crystallite) size, the dislo- cation density and the twin fault probability. An illustration of the CMWP fitting is presented in Fig. 2 for the diffraction pattern taken on the center of the disk processed by 1 turn of HPT. The microstructure evolutions as a function of the temperature for the edges and the centers of the HPT disks are shown in Figs. 3 and 4, respectively. For better visualization and understanding, the temperature ranges corresponding to the 1st and 2nd DSC peaks observed at the disk edges and centers are marked in pink and yellow, respectively, in each plot in Figs. 3 and 4.
Fig. 3a shows that the diffraction domain size was about 30–40 nm for the edge of the disks processed for different numbers of turns and did not change up to the end of the first exothermic peak. On the other hand, during the second DSC peak the domain size increased considerably to about 140–170 nm.
The dislocation density was (120–150) ×1014 m−2 at the edges of the disks processed for different numbers of HPT turns (see Fig. 3b). Unlike the diffraction domain size, the dislocation density decreased during
both the first and second DSC peaks. The trend is similar for all numbers of turns, and after heating up to 1000 K the dislocation density decreased to (0.7–0.8) ×1014 m−2. The twin fault probability was about 3% at the disk edges after HPT-processing for all numbers of turns and decreased during both exothermic peaks as shown in Fig. 3c. At 1000 K, the twin fault probability was under the detection limit of XLPA (<0.1%), i.e., its value was practically zero.
Considering the disk centers, the diffraction domain size was be- tween 30 and 40 nm immediately after HPT for all studied turns and considerable coarsening was observed only during the second DSC peak, similar to the observations made at the disk edge (see Fig. 4a). At the highest temperature of 1000 K, the domain size increased to 150–200 nm at the disk center.
Fig. 4b shows the evolution of the dislocation density in the center parts of the disks versus heating temperature. Unlike the edge parts, the dislocation density at the centers depends on the number of HPT turns.
Namely, for ½ turn the dislocation density was about 77 ×1014 m−2 immediately after HPT while for higher numbers of turns the values were between 130 and 150 ×1014 m−2. For ½ turn, the dislocation density decreased only during the second DSC peak while for higher numbers of turns the density of dislocations was reduced during both the first and second peaks. Most probably, the lower driving force for re- covery due to the smaller dislocation density for ½ turn caused the lack of significant dislocation annihilation in the first DSC peak. It is noted that for higher turns (between 1 and 10 turns), during the first DSC peak, the dislocation density decreased to the same level as the value obtained for ½ turn immediately after HPT. During the second DSC peak, the dislocation density was reduced to (0.4–0.7) ×1014 m−2. Fig. 4c shows that the twin fault probability was ~1.2% at the center of the sample processed for ½ turn, while for higher numbers of turns it varied be- tween 2.1 and 2.7%. During the first exothermic peak only slight changes were observed for all samples, while in the second DSC peak the value of the twin fault probability decreased to zero.
3.3. Study of the evolution of grain size during annealing
The grain size at the centers and edges of the HPT-processed and the annealed samples was determined by TEM or SEM-EBSD. EBSD can be performed only for the specimens annealed at 1000 K since reliable indexing of the Kikuchi patterns could only be carried out in this case.
The distorted microstructure for lower temperatures and immediately after HPT resulted in low image quality. As an example, Fig. 5 shows the dark-field TEM and SEM-EBSD images for the center and the edge of the disk processed by 1 turn of HPT and annealed up to 750 and 1000 K.
Since XLPA suggested that the diffraction domain size did not change considerably between RT and 750 K, it was assumed that this is also valid for the grain size. Indeed, the grain size remained practically un- changed up to 750 K for both center and edge parts of the HPT-processed disks as shown in Fig. 6. Therefore, the grain size was not studied at 500 K except for the edge of the disk processed by 10 turns. In the latter case, the experiments proved that the grain size at 500 K was close to the values obtained in the HPT-processed state and after heating up to 750 K (see Fig. 6a). In addition, XLPA suggested there was no significant change in the microstructure between 5 and 10 turns. Thus, the grain size for the sample processed for 5 turns was not determined in this study.
Immediately after HPT, the grain size at the disk edge was about 40–60 nm, irrespectively of the number of turns. Then, these values increased to about 460–660 nm during the second DSC peak as shown in Fig. 6a. In the disk center, the grain sizes were about 600, 100 and 70 nm for ½, 1 and 10 turns, respectively. In the course of the second exothermic peak, the grain size increased to about 1550 nm for ½ turn and ~400 nm for 1 and 10 turns (see Fig. 6b). It should be noted that the grain size determined by TEM or EBSD is larger than the diffraction domain size obtained by XLPA with a factor between 2 and 8 for the studied samples. This is a general observation for the SPD-processed Fig. 2. CMWP fitting for the XRD pattern obtained for the center of the
CoCrFeNi disk processed by 1 turn of HPT. The difference between the measured and the calculated (fitted) XRD patterns is also shown at the bottom of the figure.
metallic materials since these specimens have hierarchical microstruc- ture, i.e., the grains bounded by high-angle boundaries are fragmented into subgrains and dislocation cells with low-angle boundaries [34].
Since XLPA is very sensitive to low angle misorientations, this method measures the size of subgrains and dislocation cells, yielding a lower diffraction domain size than the grain size determined by microscopic Fig. 3. The diffraction domain size (a), the dislocation density (b) and the twin fault probability (c) versus the temperature of heat treatment for the edge parts of the HPT disks processed for different numbers of turns. The temperature ranges corresponding to the 1st and 2nd DSC peaks are marked in pink and yellow, respectively.
(For interpretation of the references to colour in this figure legend, the reader is referred to the Web version of this article.)
Fig. 4. The diffraction domain size (a), the dislocation density (b) and the twin fault probability (c) versus the temperature of heat treatment for the center parts of the HPT disks processed for different numbers of turns. The temperature ranges corresponding to the 1st and 2nd DSC peaks are marked in pink and yellow, respectively. (For interpretation of the references to colour in this figure legend, the reader is referred to the Web version of this article.)
methods [35]. Nevertheless, the trends in the evolution of the grain and domain sizes during annealing are similar for both cases (compare Figs. 3a, 4a and 6).
3.4. Change of the hardness during the heat treatment
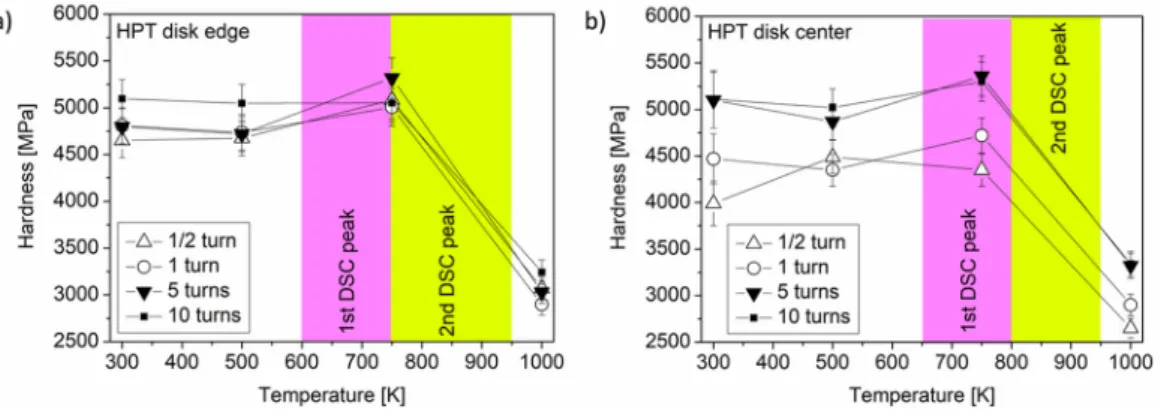
Fig. 7 shows the hardness changes upon heating at (a) the edges and (b) the centers of the HPT-processed samples, and the temperature ranges for the first and second DSC peaks are indicated in each plot.
After HPT-processing, the hardness at the edges was between 4700 and 5100 MPa for the different numbers of turns, where the values are considered within the experimental error. These values remain practi- cally unchanged up to the end of the first DSC peak, then these decreased in the course of the second exothermic peak and reached a value of
~3000 MPa at 1000 K (see Fig. 7a). In the disk centers, the hardness values were ~4000 and ~4500 MPa for ½ and 1 turn, respectively, while
for 5 and 10 turns their values were ~5100 MPa immediately after HPT as shown in Fig. 7b. Similar to the disk edge, in the center the hardness was reduced only in the course of the second DSC peak and at 1000 K its values were ~2700 and ~2900 MPa for ½ and 1 turns, respectively, and
~3300 MPa for 5 and 10 turns (see Fig. 7b).
4. Discussion
4.1. Evolution of the released heat versus the shear strain of HPT The present study revealed that except for very low imposed strains (i.e., at the center of the disk processed for the lowest number of turns,
½) two exothermic peaks developed during annealing up to 1000 K (see Fig. 1). During the first peak, the density of lattice defects (dislocations and twin faults) decreased while the grain size remained practically unchanged, indicating that in the course of this exothermic peak only Fig. 5.DF-TEM images for (a) the center of the disk processed by 1 turn of HPT and (b) heated up to 750 K. (c) EBSD grain orientation map for the disk center processed by 1 turn and then annealed up to 1000 K. DF-TEM images for (d) the edge of the disk processed by 1 turn of HPT and (e) heated up to 750 K. (f) EBSD grain orientation map for the disk edge processed by 1 turn and then annealed up to 1000 K.
Fig. 6.The grain size determined by TEM or EBSD for the (a) edge and (b) center parts of the disks processed by different numbers of HPT turns as a function of the annealing temperature. The temperature ranges corresponding to the 1st and 2nd DSC peaks are marked in pink and yellow, respectively. (For interpretation of the references to colour in this figure legend, the reader is referred to the Web version of this article.)
recovery of the severely deformed microstructure occurred (see Figs. 3, 4 and 6). For the lowest strain (i.e., at the center of the disk processed for
½ turn), the lower defect density resulted in a smaller driving force for recovery, thus it occurred at higher temperatures, namely in the course of the second DSC peak. In general, during the second exothermic peak the recovery continued and additional recrystallization also occurred as indicated by the increase of the grain size.
The heat released in the two exothermic peaks is plotted as a function of the shear strain applied during HPT in Fig. 8. The shear strain (γ) was calculated using the following formula [36]:
γ=2πNr
h , (1)
where N is the number of turns, r is the distance from the disk center and h is the thickness of the disk (h =0.7 mm). For the second exothermic peak, the released heat saturated at the shear strain of about 20 with the value of about 6–7 J/g. This trend is mainly caused by the early satu- ration of the grain size with increasing strain since the main contribution to the second DSC peak was given by the decrease of the grain boundary area due to recrystallization (see the next section). For the first exothermic peak, at the shear strain of ~20 the released heat was only about 2 J/g which is one-third of the area of the second peak. The saturation released heat value for the first DSC peak was about 4 J/g that was achieved at the shear strain of ~200. It will be shown in the next section that the enhancement of the released heat for the first peak
between the shear strains of 50 and 200 was caused by the increase of the annihilated vacancy concentration.
4.2. Calculation of the contributions of the different defects to the released heat
In our former study, for the edge part of the disk processed by 10 turns the released heat values measured for the first and second DSC peaks were compared with the values calculated from the change of the microstructure [16]. In this study, this investigation is extended to the center and edge parts of the disks processed for ½, 1 and 10 HPT turns. It should be noted that laboratory XRD investigated only the uppermost surface layer with the thickness of 5–10 μm while the DSC signal was obtained from samples containing the full cross-section of the HPT-processed disks. Therefore, for increasing the reliability of the comparison between the measured and calculated released heats, syn- chrotron XRD scan was performed on the cross-section of some selected samples in order to check the through-thickness homogeneity of the microstructure in the disks. These experiments were carried out on the center and edge parts of the disks processed for the lowest (1/2) and highest (10) numbers of turns. Fig. 9a and b shows the full width at half maximum (FWHM) versus the distance from the top surface of the HPT disks for the 1st and 10th reflections in the XRD patterns, respectively.
These two peaks are harmonic reflections with the indices of 111 and 333. At both the center and the edge parts for both ½ and 10 turns, only a slight variation of the diffraction peak width can be observed as the distance from the top surface changes. Thus, the HPT disks exhibit a high degree of through-thickness homogeneity of microstructure; therefore the microstructural parameters obtained on the disk surface by labora- tory XRD can be used for the calculation of the released heat. It is worth noting that for 10 turns the slightly higher FWHM values for the center as compared to the edge is not a significant difference if the experi- mental error is considered. Thus, significant difference between the microstructures at the center and the edge parts for 10 turns was not observed in accordance with the results of laboratory XRD experiments.
The released heat can be calculated as the sum of the change of the energies stored in different defects, such as grain boundaries, disloca- tions, twin faults and vacancies. The energy stored in grain boundaries (GBs) can be determined using the following equation [37]:
EGB=3γGB
dρm, (2)
where ρm is the mass density of CoCrFeNi (7.53 g/cm 3 [38]), d is the average grain size determined by TEM or EBSD, and γGB is the GB energy per unit area. Since the grain size remained unchanged within the experimental error during the first DSC peak, EGB was calculated only for the second exothermic peak. γGB is about 0.77 J/m2 at 800–900 K where Fig. 7.The hardness values for the (a) edge and (b) center parts of the disks processed by different numbers of HPT turns as a function of the annealing temperature.
The temperature ranges corresponding to the 1st and 2nd DSC peaks are marked in pink and yellow, respectively. (For interpretation of the references to colour in this figure legend, the reader is referred to the Web version of this article.)
Fig. 8.The heat released in the first and the second DSC peaks versus the shear strain imposed during HPT.
the second exothermic peak appeared [39].
The energy stored in dislocations can be calculated as [40]:
Edisl=AGb2ρ ρmln(
1 b ̅̅̅
√ ),ρ (3)
where ρ is the dislocation density, b is the magnitude of the Burgers vector (0.263 nm [15]), and G is the shear modulus (84 GPa for CoCr- FeNi MPEA [41]). Parameter A depends on the edge or screw character of dislocations. The values of A can be determined as (4π)−1 and (4π (1 - ν))−1 for pure screw and edge dislocations, respectively, where ν is the Poisson’s ratio (0.25 for CoCrFeNi MPEA [42]). For a general disloca- tion, A can be determined as the weighted average of A values of edge and screw dislocations using parameter q obtained by XLPA:
A= q− qedge
qscrew− qedge
1 4π+
qscrew− q qscrew− qedge
1
4π(1− ν), (4)
where qedge and qscrew are the q parameters for pure edge and screw dislocations, respectively. For CoCrFeNi MPEA, qedge =1.72 and qscrew
=2.49.
The energy stored in twin faults can be calculated using the following equation [43]:
Etwin=γtwinβ
d111ρm, (5)
where β is the twin fault probability, γtwin is the twin fault energy per unit area (taken as 10 mJ/m2, since for fcc materials the twin fault en- ergy is about half of its SFE and for CoCrFeNi SFE is about 20 mJ/m2 [44]). and d111 is the spacing between the neighbouring {111} planes, since in fcc CoCrFeNi MPEA twin faults appear on these crystal planes.
The energy stored in vacancies can be obtained as [40]:
Evac=evaccv
NA
M, (6)
where cv is the vacancy concentration, evac is the vacancy formation energy (~1.7 eV for CoCrFeNi [45,46]), M is the molar mass of CoCr- FeNi (56.37 g/mol), and NA is the Avogadro’s number (6 ×10²³ mol−1).
The energies stored in grain boundaries, dislocations, twin faults and vacancies can be calculated from the grain size, dislocation density, twin fault probability and vacancy concentration using eqs. (2)–(6). Since the vacancy concentration was not measured directly in this study, only the first three contributions to the released heat can be calculated. From the changes of the stored energies with increasing annealing temperature, the heat released in the studied temperature ranges can be determined.
In the present study, the parameters of the microstructure were deter- mined at 500, 750 and 1000 K. Therefore, the released heat values can be obtained for the temperature ranges 500–750 K and 750–1000 K. For
the majority of the investigated samples, these temperature ranges correspond to the first and second DSC peaks. Exceptions are the centers of the disks processed by 1, 5 and 10 turns, where the first DSC peak ends at a temperature slightly higher than 750 K. In these cases, for the comparison of the measured and calculated heats the areas under the DSC signal before and after 750 K were determined.
In the released heat analysis, the sum of the contributions of grain boundaries, dislocations and twin faults were determined individually for the first and second DSC peaks at the center and edge parts of the disks processed for ½, 1 and 10 turns. The grain size was not determined for 5 HPT turns, thus the total released heat cannot be calculated for this disk. Nevertheless, the sample processed for 5 turns behaved very similar to the disk deformed by 10 turns. The twelve calculated released heat values were plotted against the heats measured by DSC in Fig. 10. A good correlation between the calculated and the measured released heat values is revealed by Fig. 10, except the first peaks at edge parts for 1 and 10 turns. In these cases, the measured heats are considerably higher than the calculated values, suggesting that beside dislocations and twin faults other defects, such as vacancies have also significant contribution to the heat released during DSC experiments. The annihilated excess vacancy concentration was estimated from the difference between the measured and the calculated released heats, and (0.7 ±0.5) ×10−3 and (1.0 ± 0.7) ×10−3 were obtained for the edge parts of the disks processed for 1 and 10 turns, respectively. These values have the same order of Fig. 9. The FWHM of (a) the 1st peak on the XRD pattern (reflection 111) and (b) the 10th peak (reflection 333) versus the distance from the top surface at the center and the edge for the disks processed for ½ and 10 turns.
Fig. 10.The measured versus the calculated released heat values determined before and after 750 K on the DSC thermograms taken in the center and edge parts of the disks processed for different numbers of HPT turns.
magnitude as the excess vacancy concentrations determined in con- ventional HPT-processed metallic metals and alloys [47,48]. It is noted that for other samples investigated in this study the existence of signif- icant excess vacancy concentration cannot be excluded even if signifi- cant difference between the calculated and the measured released heats was not found. From the experimental error of the released heat, it is estimated that for other samples the vacancy concentration is lower than
~0.3 ×10⁻³. Thus, it can be concluded that in HPT-processed CoCrFeNi MPEA the vacancy concentration was enhanced for high imposed strains.
The main contributions to the released heat are plotted in Fig. 11 for N =½ turn and N ≥1 separately. The released fraction of the twin faults was below 5% for all studied samples, therefore that contribution was neglected in this representation. For the first DSC peak, the vast majority of the released heat was caused by the annihilation of dislocations at low strains, i.e., for the disk centers and also at the edge for N =½. For high strains, i.e., at the edge for N ≥1, the energy fraction of vacancies ex- ceeds the contribution of dislocations in the first DSC peak. For the second DSC peak, at very low strain (i.e., in the center of the disk pro- cessed for ½ turn) the dislocation annihilation caused most of the released heat (~85%). The rest can be attributed to the reduction of the grain boundary area, i.e., to grain growth. For other samples, the ma- jority of the heat released in the second exothermic DSC peak was caused by grain growth (65–75%) and the rest can be attributed to dislocation annihilation (see Fig. 11).
4.3. Stability of hardness
Fig. 7 revealed that the high hardness values of the HPT-processed CoCrFeNi disks (4000–5100 MPa) remained stable up to 750 K, i.e., to the end of the first DSC peak, irrespectively of the number of turns and the location along the disk radius. This is an extension of the similar result obtained only for the edge of the disk processed by 10 turns in a former paper [16]. It is an interesting observation since in the course of the first DSC peak the density of lattice defects (dislocations and twin faults) was reduced significantly. Hardness decrease was observed only when the grain size started to increase during the second exothermic peak. Thus, it seems that the hardness is sensitive to the grain growth and not to the annihilation of defects inside the grains during recovery in the course of the first DSC peak. This effect has been already observed for conventional nanocrystalline alloys processed by HPT, such as Ni–Mo alloys [23], so this is not a specific MPEA behavior. In our former
study on the edge part of the disk processed for 10 turns [16], this phenomenon was attributed to two different effects and these explana- tions can also be applied here. First, annealing at moderate homologous temperatures of 0.35–0.45 for short times (the duration is not longer than 1 h) can yield hardening in UFG and nanocrystalline materials due to the relaxation of grain boundaries which hinders the emission of dislocations from the boundaries [23]. This temperature range corre- sponds to 600–760 K in the case of CoCrFeNi alloy since its melting point is about 1700 K. The first DSC peak developed in this temperature regime, therefore the softening caused by the recovery inside the grains can be compensated by the hardening resulted from the more difficult dislocation emission from grain boundaries. The second effect which can explain the unchanged hardness during the first DSC peak is the hard- ening caused by the hardness measurement. It is well known that the penetration of the Vickers indenter into metals yields a plastic strain of 8% in the material under the tip [49]. This plastic strain can result in strain hardening in the recovered material, thereby increasing the hardness back to a similar level as measured in the HPT-processed state.
Nevertheless, the hardness stability held until grain coarsening occurred.
5. Summary and conclusions
In this study, the thermal stability of the nanostructure in CoCrFeNi MPEA processed by HPT for ½, 1, 5 and 10 turns was investigated. The following conclusions were drawn from the results:
1. Except for the center of the disk processed by ½ turn, at both the center and the periphery of the disks two exothermic peaks were observed in the DSC thermograms. The first peak was related to the recovery of the microstructure while in the course of the second peak recrystallization also occurred. For the center of the sample pro- cessed for ½ turn, only the second peak was detected which corre- sponds to recovery of the microstructure.
2. The area under the DSC peaks, i.e., the released heat, increased with increasing the shear strain imposed during HPT. The saturation released heat value for the first DSC peak was about 4 J/g that was achieved at the shear strain of ~200. For the second exothermic peak, the released heat saturated at the shear strain of about 20 with the value of about 6–7 J/g.
3. Synchrotron XRD experiments proved that the microstructure was fairly homogeneous throughout the depth of the HPT disks at both
Fig. 11. The contributions of dislocations, grain boundaries and vacancies to the heat released before and after 750 K for the center and edge parts of the disks processed by different numbers of HPT turns (denoted by N).
the center and the edge parts. The comparison between the measured released heats and the values calculated from the change of the defect structure during annealing yielded a good agreement, except for the edge parts of the disks processed for the numbers of turns between 1 and 10. The difference was interpreted by the annihilation of excess vacancies. The concentration of these vacancies was esti- mated as 10−3.
4. The HPT-processed CoCrFeNi MPEA samples exhibited very high hardness values between 4000 and 5100 MPa. The hardness at both the center and the edge parts of the disks processed for different numbers of HPT turns remained stable up to the beginning of the second DSC peak (~750 K), i.e., until grain growth started.
Author statement
Pham Tran Hung: Data curation, Formal analysis, Investigation, Writing - original draft; Megumi Kawasaki: Conceptualization, Investi- gation, Funding acquisition, Supervision, Writing - review & editing;
Jae-Kyung Han: Investigation; Abel Szab´ o: Formal analysis, Investiga-´ tion; J´anos L. L´ab´ar: Formal analysis, Investigation, Writing - review &
editing; Zolt´an Heged˝us: Data curation, Formal analysis, Investigation, Writing - review & editing; Jeno Gubicza: Conceptualization, Funding ˝ acquisition, Investigation, Supervision, Visualization, Writing - original draft.
Declaration of competing interest
The authors declare that they have no known competing financial interests or personal relationships that could have appeared to influence the work reported in this paper.
Data availability
The raw/processed data required to reproduce these findings cannot be shared at this time due to technical or time limitations.
Acknowledgement
This work was supported in part by the Ministry of Human Capacities of Hungary within the ELTE University Excellence program (1783-3/
2018/FEKUTSRAT); in part by the grant no. VEKOP-2.3.3-15-2016- 00002 of the European Structural and Investment Funds; and in part by the National Science Foundation of the United States under Grant No.
DMR-1810343. We acknowledge DESY (Hamburg, Germany), a member of the Helmholtz Association HGF, for the provision of experimental facilities. The preparation of the TEM lamellae by Levente Ill´es and Andrea Fenyvesi-Jakab is also acknowledged. The authors are grateful to Dr. Zolt´an Dankh´azi and Mr. G´abor Varga for their help in taking the EBSD images.
References
[1] B. Cantor, I. Chang, P. Knight, A. Vincent, Microstructural development in equiatomic multicomponent alloys, Mater. Sci. Eng. 375 (2004) 213–218.
[2] J.-W. Yeh, S.-K. Chen, S.-J. Lin, J.-Y. Gan, T.-S. Chin, T.-T. Shun, C.-H. Tsau, S.- Y. Chang, Nanostructured high-entropy alloys with multiple principal elements:
novel alloy design concepts and outcomes, Adv. Eng. Mater. 6 (2004) 299–303.
[3] Y. Zhou, Y. Zhang, Y. Wang, G. Chen, Solid solution alloys of AlCoCrFeNiTix with excellent room-temperature mechanical properties, Appl. Phys. Lett. 90 (2007) 181904.
[4] X. Wang, Y. Zhang, Y. Qiao, G. Chen, Novel microstructure and properties of multicomponent CoCrCuFeNiTix alloys, Intermetallics 15 (2007) 357–362.
[5] O. Senkov, J. Scott, S. Senkova, F. Meisenkothen, D. Miracle, C. Woodward, Microstructure and elevated temperature properties of a refractory TaNbHfZrTi alloy, J. Mater. Sci. 47 (2012) 4062–4074.
[6] Y. Chen, T. Duval, U. Hung, J. Yeh, H. Shih, Microstructure and electrochemical properties of high entropy alloys—a comparison with type-304 stainless steel, Corrosion Sci. 47 (2005) 2257–2279.
[7] M.-H. Chuang, M.-H. Tsai, W.-R. Wang, S.-J. Lin, J.-W. Yeh, Microstructure and wear behavior of AlxCo1. 5CrFeNi1. 5Tiy high-entropy alloys, Acta Mater. 59 (2011) 6308–6317.
[8] M.A. Hemphill, T. Yuan, G. Wang, J. Yeh, C. Tsai, A. Chuang, P. Liaw, Fatigue behavior of Al0. 5CoCrCuFeNi high entropy alloys, Acta Mater. 60 (2012) 5723–5734.
[9] Y. Zhang, T.T. Zuo, Z. Tang, M.C. Gao, K.A. Dahmen, P.K. Liaw, Z.P. Lu, Microstructures and properties of high-entropy alloys, Prog. Mater. Sci. 61 (2014) 1–93.
[10] E. Pickering, R. Mu˜noz-Moreno, H.J. Stone, N.G. Jones, Precipitation in the equiatomic high-entropy alloy CrMnFeCoNi, Scripta Mater. 113 (2016) 106–109.
[11] P.T. Hung, M. Kawasaki, J.-K. Han, J.L. L´ab´ar, J. Gubicza, Thermal stability of a nanocrystalline HfNbTiZr multi-principal element alloy processed by high-pressure torsion, Mater. Char. 168 (2020) 110550.
[12] F. He, Z. Wang, Q. Wu, S. Niu, J. Li, J. Wang, C. Liu, Solid solution island of the Co- Cr-Fe-Ni high entropy alloy system, Scripta Mater. 131 (2017) 42–46.
[13] W. Huo, H. Zhou, F. Fang, X. Hu, Z. Xie, J. Jiang, Strain-rate effect upon the tensile behavior of CoCrFeNi high-entropy alloys, Mater. Sci. Eng. 689 (2017) 366–369.
[14] M. Vaidya, G.M. Muralikrishna, S. Divinski, B. Murty, Experimental assessment of the thermodynamic factor for diffusion in CoCrFeNi and CoCrFeMnNi high entropy alloys, Scripta Mater. 157 (2018) 81–85.
[15] J. Gubicza, P.T. Hung, M. Kawasaki, J.-K. Han, Y. Zhao, Y. Xue, J.L. L´ab´ar, Influence of severe plastic deformation on the microstructure and hardness of a CoCrFeNi high-entropy alloy: a comparison with CoCrFeNiMn, Mater. Char. 154 (2019) 304–314.
[16] P.T. Hung, M. Kawasaki, J.-K. Han, J.L. L´abar, J. Gubicza, Microstructure evolution ´ in a nanocrystalline CoCrFeNi multi-principal element alloy during annealing, Mater. Char. 171 (2021) 110807.
[17] Y. Jien-Wei, Recent progress in high entropy alloys, Ann. Chim. Sci. Mater. 31 (2006) 633–648.
[18] Q. Tang, Y. Huang, Y. Huang, X. Liao, T. Langdon, P. Dai, Hardening of an Al0.
3CoCrFeNi high entropy alloy via high-pressure torsion and thermal annealing, Mater. Lett. 151 (2015) 126–129.
[19] A. Heczel, M. Kawasaki, J.L. L´ab´ar, J. Jang, T.G. Langdon, J. Gubicza, Defect structure and hardness in nanocrystalline CoCrFeMnNi high-entropy alloy processed by high-pressure torsion, J. Alloys Compd. 711 (2017) 143–154.
[20] C. Koch, Optimization of strength and ductility in nanocrystalline and ultrafine grained metals, Scripta Mater. 49 (2003) 657–662.
[21] Y.M. Wang, E. Ma, Three strategies to achieve uniform tensile deformation in a nanostructured metal, Acta Mater. 52 (2004) 1699–1709.
[22] Y.-H. Zhao, X.-Z. Liao, S. Cheng, E. Ma, Y.T. Zhu, Simultaneously increasing the ductility and strength of nanostructured alloys, Adv. Mater. 18 (2006) 2280–2283.
[23] J. Gubicza, Annealing-induced hardening in ultrafine-grained and nanocrystalline materials, Adv. Eng. Mater. 22 (2020) 1900507.
[24] B. Schuh, F. Mendez-Martin, B. V¨olker, E.P. George, H. Clemens, R. Pippan, A. Hohenwarter, Mechanical properties, microstructure and thermal stability of a nanocrystalline CoCrFeMnNi high-entropy alloy after severe plastic deformation, Acta Mater. 96 (2015) 258–268.
[25] F. Otto, A. Dlouhy, K.G. Pradeep, M. Kubˇenov´a, D. Raabe, G. Eggeler, E.P. George, Decomposition of the single-phase high-entropy alloy CrMnFeCoNi after prolonged anneals at intermediate temperatures, Acta Mater. 112 (2016) 40–52.
[26] F. He, Z. Wang, Q. Wu, J. Li, J. Wang, C. Liu, Phase separation of metastable CoCrFeNi high entropy alloy at intermediate temperatures, Scripta Mater. 126 (2017) 15–19.
[27] K. Christofidou, E. Pickering, P. Orsatti, P. Mignanelli, T. Slater, H. Stone, N. Jones, On the influence of Mn on the phase stability of the CrMnxFeCoNi high entropy alloys, Intermetallics 92 (2018) 84–92.
[28] M.E. Bloomfield, K.A. Christofidou, N.G. Jones, Effect of Co on the phase stability of CrMnFeCoxNi high entropy alloys following long-duration exposures at intermediate temperatures, Intermetallics 114 (2019) 106582.
[29] J. Gubicza, I. Schiller, N.Q. Chinh, J. Illy, Z. Horita, T. Langdon, The effect of severe plastic deformation on precipitation in supersaturated Al–Zn–Mg alloys, Mater. Sci.
Eng. 460 (2007) 77–85.
[30] W. Zhou, L. Fu, P. Liu, X. Xu, B. Chen, G. Zhu, X. Wang, A. Shan, M. Chen, Deformation stimulated precipitation of a single-phase CoCrFeMnNi high entropy alloy, Intermetallics 85 (2017) 90–97.
[31] R.B. Figueiredo, P.R. Cetlin, T.G. Langdon, Using finite element modeling to examine the flow processes in quasi-constrained high-pressure torsion, Mater. Sci.
Eng. 528 (2011) 8198–8204.
[32] G. Rib´arik, J. Gubicza, T. Ung´ar, Correlation between strength and microstructure of ball-milled Al–Mg alloys determined by X-ray diffraction, Mater. Sci. Eng. 387 (2004) 343–347.
[33] J. Kieffer, V. Valls, N. Blanc, C. Hennig, New tools for calibrating diffraction setups, J. Synchrotron Radiat. 27 (2020) 558–566.
[34] J. Gubicza, Defect Structure and Properties of Nanomaterials, Woodhead Publishing, 2017.
[35] J. Gubicza, X-ray Line Profile Analysis in Materials Science, IGI Global, 2014.
[36] F. Wetscher, A. Vorhauer, R. Pippan, Strain hardening during high pressure torsion deformation, Mater. Sci. Eng. 410 (2005) 213–216.
[37] F.J. Humphreys, M. Hatherly, Recrystallization and Related Annealing Phenomena, Elsevier, 2012.
[38] R.B. Mane, B.B. Panigrahi, Sintering mechanisms of mechanically alloyed CoCrFeNi high-entropy alloy powders, J. Mater. Res. 33 (2018) 3321–3329.
[39] M. Vaidya, K. Pradeep, B. Murty, G. Wilde, S. Divinski, Radioactive isotopes reveal a non sluggish kinetics of grain boundary diffusion in high entropy alloys, Sci. Rep.
7 (2017) 1–11.
[40] E. Schafler, G. Steiner, E. Korznikova, M. Kerber, M. Zehetbauer, Lattice defect investigation of ECAP-Cu by means of X-ray line profile analysis, calorimetry and electrical resistometry, Mater. Sci. Eng. 410 (2005) 169–173.
[41] Z. Wu, H. Bei, G.M. Pharr, E.P. George, Temperature dependence of the mechanical properties of equiatomic solid solution alloys with face-centered cubic crystal structures, Acta Mater. 81 (2014) 428–441.
[42] G. Laplanche, P. Gadaud, C. B¨arsch, K. Demtr¨oder, C. Reinhart, J. Schreuer, E.
P. George, Elastic moduli and thermal expansion coefficients of medium-entropy subsystems of the CrMnFeCoNi high-entropy alloy, J. Alloys Compd. 746 (2018) 244–255.
[43] Z. Hegedus, J. Gubicza, M. Kawasaki, N.Q. Chinh, K. Süvegh, Z. Fogarassy, T.
G. Langdon, High temperature thermal stability of ultrafine-grained silver processed by equal-channel angular pressing, J. Mater. Sci. 48 (2013) 1675–1684.
[44] A. Zaddach, C. Niu, C. Koch, D. Irving, Mechanical properties and stacking fault energies of nifecrcomn high-entropy alloy, JOM (J. Occup. Med.) 65 (2013) 1780–1789.
[45] W. Chen, X. Ding, Y. Feng, X. Liu, K. Liu, Z. Lu, D. Li, Y. Li, C. Liu, X.-Q. Chen, Vacancy formation enthalpies of high-entropy FeCoCrNi alloy via first-principles calculations and possible implications to its superior radiation tolerance, J. Mater.
Sci. Technol. 34 (2018) 355–364.
[46] K. Sugita, N. Matsuoka, M. Mizuno, H. Araki, Vacancy formation enthalpy in CoCrFeMnNi high-entropy alloy, Scripta Mater. 176 (2020) 32–35.
[47] J. Cíˇzek, M. Janecek, O. Srba, R. Kuˇzel, Z. Barnovsk´a, I. Proch´azka, S. Dobatkin, Evolution of defects in copper deformed by high-pressure torsion, Acta Mater. 59 (2011) 2322–2329.
[48] G. Kapoor, L. P´eter, E. Fekete, J.L. L´ ´ab´ar, J. Gubicza, Stored energy in nanocrystalline Ni-Mo films processed by electrodeposition, J. Alloys Compd. 796 (2019) 307–313.
[49] D. Tabor, The hardness and strength of metals, J. Inst. Met. 79 (1951) 1.