Ph.D. Thesis
Study of complex nanostructures by infrared spectroscopy
Zsolt Szekr´ enyes
Doctoral School on Materials Sciences and Technologies
Supervisor: Prof. Katalin Kamar´ as Wigner Research Centre for Physics
Hungarian Academy of Sciences
Budapest, 2015
This PhD work was performed as an individual doctorate. However, this work would not have been possible without the help of those who supervised my work during the years. I would like to thank Katalin Kamar´as for her constant support and never ending optimism when challenging events made my way difficult. I would also like to thank ´Ad´am Gali for the opportunity of participating in the activity related to the synthesis and characterization of silicon carbide quantum dots. We started our work as a casual collaboration but it evolved into a strong joint project. Considering that Katalin Kamar´as is an experimental scientist while ´Ad´am Gali is a theorist, special thanks go to both of them as they could combine their expertise for common objects in problematical questions, this was of great importance for me and helped my progress.
I would like to thank the PRAIRIES1 community for the great opportunity to work in this project. I would like to thank the people from Trieste and Namur (Maurizio Prato, Davide Bonifazi, Anna Llanes-Pallas, Laura Maggini, Tomas Marangoni) who provided the chemical compounds. Special thanks for the theoretical work of the people from Liverpool (Mats Persson, Felix Hanke, and Jonas Bjork). I would like to acknowledge Gy¨orgy Tarczay from E¨otv¨os Lor´and University, Budapest for the possibility of performing matrix isolation measurements in his laboratory. P´eter Nagy and B´alint Somogyi have accomplished the- oretical calculations, their enthusiasm is highly acknowledged. Thanks to D´avid Beke for his dedication and work. The discussions we daily had has represented a great source of motivation.
Special thanks also for the support of the people from our research group: P´eter Matus, Hajnalka M´aria T´oh´ati, ´Eva Kov´ats, Katalin N´emeth, ´Aron Pekker, Gy¨ongyi Klupp, S´andor Pekker, Gyula Faigel, G´abor Bortel, and G´abor Oszl´anyi.
Finally I would like to thank my family (Ildik´o, N´ora, and Laura). Your help and support has been invaluable.
1”PRAIRIES” - SuPRAmolecular hIeraRchIcal self-assembly of organic molecules onto surfaces towards bottom-up nanodevicES - FP6 Marie Curie Research Training Network
1. General introduction . . . 1
2. Fundamentals . . . 5
2.1 Light-matter interaction . . . 5
2.1.1 Basic considerations . . . 5
2.1.2 Interfaces . . . 7
2.1.3 Optical properties of solids . . . 9
2.1.4 Molecular vibrations . . . 11
2.2 Introduction to hydrogen bonding . . . 13
2.2.1 Definitions . . . 13
2.2.2 Theoretical background . . . 14
3. Materials and Methods . . . 17
3.1 Hydrogen bonded supramolecular systems . . . 17
3.1.1 Synthesis . . . 17
3.1.2 Methods . . . 18
3.1.3 Infrared spectra of hydrogen bonds . . . 21
3.2 Silicon carbide quantum dots . . . 23
3.2.1 Synthesis . . . 23
3.2.2 Surface sensitive infrared spectroscopy . . . 24
3.2.3 Photoluminescence spectroscopy . . . 29
4. Infrared spectroscopy of hydrogen bonded supramolecular systems . . 31
4.1 Introduction . . . 31
4.2 Hydrogen bonded networks . . . 32
4.3 Study of solids with homomolecular association . . . 37
4.3.3 Bis-uracil linear molecular unit . . . 60
4.4 Heteromolecular ordering in the solid state . . . 67
4.5 Summary . . . 72
5. Characterization of silicon carbide quantum dots . . . 75
5.1 Introduction . . . 75
5.2 Optical and vibrational properties of silicon carbide . . . 77
5.2.1 Luminescence of bulk and microstructured silicon carbide . . . 77
5.2.2 Evidence for quantum confinement photoluminescence of silicon car- bide quantum dots . . . 79
5.2.3 Vibrational modes of crystalline silicon carbide . . . 81
5.3 Basic photoluminescent properties and surface structure of silicon carbide quantum dots . . . 84
5.4 Chemical transformation of carboxylic groups on the surface of silicon car- bide quantum dots . . . 89
5.5 Summary . . . 96
6. Conclusions and outlook . . . 99
7. Thesis points . . . 101
Symbol Physical Quantity
E electric field
B magnetic induction
P polarization
F Force
c velocity of light in vacuum 0, µ0 vacuum constants
q wave vector
ˆ
q complex wave vector
˜
q unit vector
ω frequency of light
σ conductivity
dielectric constant
n refractive index
κ extinction coefficient η complex refractive index α absorption coefficient
p dipole moment
e∗ effective ionic charge v velocity of the moving charges
k force constant
r displacement
Γ damping constant
µ reduced mass
ν phase velocity of the wave
d sample thickness
MI matrix isolation ATR attenuated total reflection
This PhD work is focused around infrared spectroscopy of organic (self-assemled supramolecular networks) and inorganic (functionalized silicon carbide quantum dots) com- plex nano- and microstructures. The novelty of the present work is due to the joint appli- cation of standard infrared spectroscopic methods (i.e. absorption spectroscopy) with more special methods (i.e matrix isolation infrared spectroscopy and attenuated total internal re- flection infrared spectroscopy) [1–7]. Both self-assembled systems and silicon carbide (SiC) surface functional groups are structures assembled on surfaces. In the first case the three- dimensional analogue molecular crystals were studied using the results obtained by surface characterization techniques (scanning tunneling microscopy). In the second case the surface itself was investigated by special infrared techniques.
To study the structure and dynamics of the supramolecular networks, temperature de- pendent absorption spectroscopy and matrix isolation were applied. The studied systems were formed from different uracil and piridyne based molecular constituents, which form self-assembled networks through hydrogen bonds. The recognition between the different molecular modules is mediated via multiple hydrogen bonding donor and acceptor sites.
Hydrogen bonds can be sensitively detected by infrared spectroscopy by measuring their effect in the affected N-H and C=O vibrational regions of the spectra. To reveal the exact dimeric or multimeric character of the hydrogen bonded structures, different infrared spec- troscopic methods are needed. The temperature dependent measurements give a full picture about the melting of hydrogen bonds while matrix isolation infrared spectroscopy offers the possibility to study the molecular modules in their monomeric state when no interaction between them is possible. The obtained experimental results were probed by comparison with temperature dependent ab initio molecular dynamics calculations (in collaboration with the University of Liverpool and E¨otv¨os Lor´and University, Budapest). The results of
these calculations yield excellent agreement with the hydrogen bond melting temperature observed by experiment [1–3].
The study of inorganic based hybrid nanostructures requires special, surface sensitive methods of infrared spectroscopy. These methods permit the identification of atomic mono- layers and surface functional molecular groups. One of the methods used and implemented during my PhD work in our laboratory is attenuated total internal reflection (ATR) infrared spectroscopy. ATR proved its sensitivity in detecting the surface related Si-H vibrations on hydrogenated silicon crystal where conventional methods of infrared spectroscopy yield no results. The main activity in surface sensitive infrared spectroscopy during my PhD work was the study of the surface structure of SiC quantum dots. SiC quantum dots show very interesting and promising luminescent properties which are related to quantum confine- ment effects. At the same time they show a complex surface structure, which together with the revealed bioinert and biocompatibility properties, make them very promising materials for different biological applications. ATR revealed the presence of carboxyl and carboxi- late groups on the surface of quantum dots, opening the possibility for further biological functionalization [4–6].
Chapter 2.1 describes some basic properties related to the light-matter interaction. Laws of reflection and refraction are introduced as a starting point for the description of surface sensitive infrared spectroscopy. The chapter continues with the treatment of optical prop- erties of solids. As the experimental results obtained during my work are mainly related to the infrared spectroscopy of molecular groups, section 2.1.4 presents a short introduc- tion to molecular vibrations. In the second part of the chapter (section 2.2) the concept of hydrogen bonding is treated starting with some general definitions and ending up with a brief theoretical background.
Chapter 3 is divided in two main parts: in the first part I introduce the studied molecular library followed by the description of the experimental techniques. At the end of this section I present what kind of information is available about hydrogen bonds through infrared spectroscopy. In the second section I describe basic principles of surface sensitive infrared spectroscopy followed by a short presentation of the photoluminescence spectroscopy, both methods being very powerful in the characterization of SiC quantum dots.
Chapter 4 starts with a short literature survey about different hydrogen bonded net- works. Next I present my results measured on the constituents of the molecular library (sections 4.3 and 4.4). Homomolecular association (intermolecular hydrogen bonds between the same type of molecules) and heteromolecular ordering (intermolecular hydrogen bonds between different type of molecules) were studied during my PhD work. The joint appli- cation of different techniques demonstrates that the information which can be obtained from the vibrational spectra is vast and very useful in the chemical engineering of different supramolecular systems .
In chapter 5 first I introduce, based on literature data, optical and vibrational properties of bulk and nanostructured SiC. Then I present my results on basic photoluminescent behavior and surface structure of SiC quantum dots (section 5.3). Chemical transformation of carboxylic groups on the surface of SiC quantum dots to acid anhydride groups is possible at elevated temperatures, opening new possibilities for surface modifications (section 5.4).
In chapter 6 I present a short summary and formulate a very concise outlook of the thesis, while chapter 7 presents the thesis points and my publication list.
The investigation of solid state systems using electromagnetic radiation provides a multi- tude of information about the electronic and lattice excitations and their dynamics. Elec- tromagnetic radiation affects the particles that make up the medium, and the medium affects the electromagnetic radiation. This chapter starts with a short overview about how the electromagnetic field affects the solid state systems, and material parameters which characterize the medium are also introduced (2.1.1). Laws of reflection and refraction at an interface between two media are introduced in section 2.1.2. This part is important for the description of the attenuated total internal reflection infrared spectroscopy in chapter 3.
Sections 2.1.3 and 2.1.4 are related to molecular vibrations and some basic considerations of normal modes and infrared active dipole modes. The second part of the chapter is an introduction to hydrogen bonding describing some basic definitions and theoretical insights (sections 2.2.1 and 2.2.2).
2.1 Light-matter interaction [8–14]
2.1.1 Basic considerations
In order to describe the propagation of electromagnetic waves in a medium wave equations are needed that describe the behavior of the electric fieldEfor a given dipole moment den- sity or polarizationP, or the medium responsePfor a givenE. From Maxwell’s equations it is straightforward to derive the wave equation by using the two curl equations. The wave equation for the electric field is:
−∇(∇ ·E) +∇2E = c12
∂2E
∂t2 + 1
0c2
∂2P
∂t2 , (2.1)
where
c= 1
õ00, (2.2)
is the velocity of light in vacuum and 0 and µ0 are the vacuum constants.
The harmonic plane wave solution of the wave equation for monochromatic light at frequency, ω, is:
E(r, t) =E0exp i (q·r−ωt). (2.3) In homogeneous, isotropic, and nonmagnetic solids the plane wave equation results in a complex wave vector ˆq,
ˆ q = ωc h
0 + iσ
0ω
i1/2
, (2.4)
where is the dielectric constant andσ is the conductivity and both are material parame- ters. A complex refractive index, η, can be defined by
ˆ
q= ωcη˜q (2.5)
whereq˜ is a unit vector and
η=n+ iκ, (2.6)
with n and κ being the refractive index and extinction coefficient, respectively. The plane wave field in equation 2.3 can be rewritten for absorbing media using equations 2.5 and 2.6.
E(r, t) = E0exp −ωcκ˜q·r exp
i ωcn˜q·r−ωt
. (2.7)
The solution of the wave equation in a medium is an oscillating wave that decays during propagation; the first exponential in equation 2.7 stands for absorption, the decay of the propagating wave is characterized by the extinction coefficient, κ. The attenuation of the wave can also be described by Beer’s law:
I =I0exp (−αz) (2.8)
whereI0 is the intensity of the source, α is the absorption coefficient describing the atten- uation of the intensity, I, with distance, z.
α= 2ωκc = σ
0cn (2.9)
From equation 2.9 results that the attenuation is governed by the imaginary part of the complex refractive index. The second exponential in equation 2.7 is oscillatory and repre- sents the phase velocity of the wave, ν =c/n.
2.1.2 Interfaces [9–11, 13, 15]
Applying boundary conditions at an interface between two media with different refractive indices leads to the laws of reflection and refraction. Light striking an interface is partially reflected and partially refracted. The angle of refraction and the angle of incidence are interrelated by Snell’s law:
n1sinθ1 =n2sinθ2, (2.10)
In equation 2.10 n1 is the refractive index of the incident material, θ1 is the angle of incidence,n2 is the refractive index of the second material, andθ2 is the angle of refraction into the second medium (figure 2.1 (a)). Snell’s law holds in general: electromagnetic waves, sound waves, water waves. If the refractive indexn1 of the medium from which the light is incident onto the interface is higher than the refractive indexn2 of the second medium, the reflection is called internal. In the opposite case, whenn1 is lower thann2, the reflection is called external.
The field amplitude ratios of reflected and refracted rays (r and t) to the incident ray (i) are described by the Fresnel equations. For parallel (k) polarization (E parallel to the plane of incidence) and perpendicular (⊥) polarization (E perpendicular to the plane of incidence) (figure 2.1 (b)):
rk = Erk
Eik
= η1cosθ2 −η2cosθ1
η1cosθ2+η2cosθ1 =−tan (θ1−θ2)
tan (θ1+θ2) (2.11)
r⊥= Er⊥
Ei⊥ = η1cosθ1−η2cosθ2
η1cosθ1+η2cosθ2 =−sin (θ1−θ2)
sin (θ1+θ2) (2.12)
Fig. 2.1: (a) Light reflection and refraction across a boundary illustrated for internal re- flection (n1>n2). (b) Illustration of the electric field as a function of polarization for the discussion of Fresnel equations (general case of external reflection,n1<n2).
tk = Etk
Eik
= 2η1cosθ1
η2cosθ1+η1cosθ2 = 2 sinθ2cosθ1
sin (θ1+θ2) cos (θ1−θ2) (2.13)
t⊥= Et⊥
Ei⊥
= 2η1cosθ1
η1cosθ1+η2cosθ2 = 2 sinθ2cosθ1
sin (θ1+θ2) (2.14) Fresnel equations are the result of Maxwell’s equations where θ1 and θ2 are connected through Snell’s law. Different polarizations of light reflect and refract differently (eq. 2.11 - 2.14). The Fresnel amplitude coefficients give the amplitudes and phases of the reflected and refracted electric field as a function of incident angle, polarization, amplitude of the incident electric field, and the complex refractive indices of the two media. At normal incidence, the reflectance, R, and transmittance, T, across a boundary (as in figure 2.1) are
R=
Er Ei
2
=
η2−η1 η2+η1
2
(2.15)
T =
Et Ei
2
= 4η12
|η2+η1|2 (2.16)
2.1.3 Optical properties of solids [8, 13, 14, 16–18]
We assume that the solid has no net macroscopic charge. However, it is composed of positively and negatively charged entities. Applying an electric field E these entities move in opposite directions producing a dipole moment p=e∗r. The quantitye∗ is the effective ionic charge andr is the displacement of the charge due toE. Assuming that the charges are elastically bound with a force constant k the restoring force is described by Hooke’s law (F=−kr). By equating these forces, we have
e∗E=−kr. (2.17)
Using Newton’s second law, the differential equation of motion for a charged mass is:
µddt2r2 +µΓdrdt +kr=e∗E (2.18) whereµis the reduced mass and Γ is a damping constant. For the diatomic molecule with massesm1 andm2, presented in figure 2.2,µ= mm1m2
1+m2. We assume that the applied electric field has the form E =E0exp(−iωt). For low intensities of the electromagnetic wave, the
Fig. 2.2: Model for a diatomic molecule with re being the equilibrium distance between the atoms, and r being the relative displacement from the equilibrium position (adapted from ref. [8]).
charge motion will have the same time dependence;r =r0exp(−iωt). Solving the equation of motion for fields of frequency ω and introducing the eigenfrequency of the oscillator ω0 =
k µ
1/2
a relation for the complex refractive index and complex dielectric constant will be obtained:
η2 = ˆ
0 = 1 +Nµ(e∗)2
0
1
ω20−ω2−iΓω. (2.19)
The resonant frequencyω0 and the damping constant Γ are strictly related to the medium, and N is the number of charges. From equation 2.19 it follows that the dipole oscillators in a material absorb most efficiently at a frequency of ω0. The value ofω0 is influenced by the force constant k (for molecules the force constant k is related to the bond strength) and the value of the reduced mass µ (it means that isotopic substitution of an atom will also affectω0).
A typical dispersion curve for n and κ as a function of frequency is presented in figure 2.3. The value ofκ goes through a maximum at the resonance frequencyω0. From equation 2.9 (α ∼ κ) it follows that the absorption coefficient α also goes through a maximum at ω0. From this relation also follows that in a dielectric medium there are regions which show no absorption if the frequency ω is not near the resonance frequency ω0. The plot of n versus ω shows that n is gradually increasing with ω, reaching a maximum, then rapidly decreasing to a minimum as it passes throughω0.
Fig. 2.3: Typical dispersion curves for the real part η and the imaginary part κ of the refractive index as a function of frequency [17].
In practice the material parameters (,η,α) are not measured directly. Assuming a light beam with known intensity (I ) incident on the sample, it is possible to measure either the
reflected light (IR) or the transmitted light (IT). The intensity of the reflected light is determined by the reflectanceR (defined in equation 2.15) through the relation: IR=RI0. The light which enters the sample may be transmitted through the sample or some part may be absorbed (IA) by the sample. The intensityI0 must equal the sum of the intensities of the transmitted, absorbed, and reflected light:
I0 =IR+IA+IT, (2.20)
Equation 2.20 can be rewritten:
1 = IIR
0 + IIA
0 + IIT
0 =R+IIA
0 +IIT
0, (2.21)
whereIA/I0represents the absorptivity, andIT/I0represents the transmissivity. The trans- mittanceT is given by the ratio of the transmitted light (IT) to the light that enters at the front face of the sample (i0 =I0 −IR). The transmittance of a pure sample of thickness d is given by Beer’s law:
T = IiT
0 =e−αd. (2.22)
The absorbance of the sample is given by:
A=−lnT =αd−ln(1−R). (2.23)
If the reflectanceR is considered zero, the absorbance will become:
A=−lnT =αd. (2.24)
2.1.4 Molecular vibrations [14, 16, 18]
The frequencies of molecular vibrations in solids are typically in the 20 to 3500 cm−1 range.
When describing optical interactions with molecular vibrations the basic assumptions are that each atom is located at an equilibrium position in the solid and it can oscillate about this equilibrium position with an amplitude which is small compared to the internuclear distance. Also it is assumed that the response of the outer shell electrons of the atoms
to an electric field is much faster than the response of the core together with its inner electron shells (adiabatic approximation). From these assumptions it follows that the force in Newton’s equation depends linearly on the displacements and the system behaves as if all the particles are joined by harmonic springs (figure 2.4). Thus, vibrations can be treated classically and the solution of the equation of motion for atoms in a solid, for small oscillations, can be described in terms of normal modes. A normal mode is a correlated motion of the atoms that has a characteristic wave vector (q) and frequency (ω). The resonant frequency of a normal mode depends on the crystal symmetry, atomic separation, interatomic and intermolecular forces. Molecules withN atoms have 3N degrees of freedom.
Three degrees of freedom are translational motion in mutually perpendicular directions and three are rotational motion. The remaining degrees of freedom are vibrational modes (3N −6 for nonlinear molecules and 3N −5 for linear molecules). The path of a normal mode of vibration is described in terms of the normal coordinate Qi. Every normal mode has a certain type of symmetry associated with it. Normal modes depicted in the normal coordinate system corresponds to bond stretches, bends, and torsions. The normal mode frequenciesω0 are characteristic of a specific functional group and can be used for material identification.
Fig. 2.4: Classical model for molecular vibrations: springs (representing the chemical bonds) and spheres (representing the atoms and ions in a solid) (adapted from ref. [8]).
For a material to show infrared absorption its dipole moment should change during the vibration (∂p/∂Qi 6= 0). The larger this change, the more intense the absorption band will be. For the molecules studied during my work (presented in chapter 4), two molecular groups are important: the carbonyl group (C=O) and the amine group (N-H). Because of the difference in electronegativity between the constituents, both groups are permanently polarized. The C=O stretching shows an intense absorption band in the region 1670− 1740 cm−1. The amine stretching is observed between 3150−3450 cm−1. In the particular situation of this thesis the exact position of the absorption bands is a function of other intermolecular interactions like hydrogen bonding, van der Waals or stacking forces.
2.2 Introduction to hydrogen bonding
2.2.1 Definitions
”A hydrogen bond exists between a functional group X-H and an atom or a group of atoms Y in the same or a different molecule when (a) there is evidence of bond formation (association or chelation), (b) there is evidence that this new bond linking X-H and Y specifically involves the hydrogen atom already bonded to X.” [19]
The above is the definition of the hydrogen bond given by Pimentel and McClellan in 1960. Since then the hydrogen bond field has increased its impact to the research com- munity by the multitude of colors shown in fundamental processes in chemistry, biology, and materials science. This statement is evident if we consider that approximately one new paper is indexed in SciFinder per hour on hydrogen bonding [20]. The tremendous increase in the hydrogen bond related research fields leads scientists from time to time to come out with new, more general definitions in order to cover the whole spectrum of the field.
There is a variety of conditions under which hydrogen bonding can occur. The interaction requires two functional groups, one of them must serve as a proton donor (D) and the other as a proton acceptor (A). Usually the proton is donated by a carboxyl, hydroxyl, amine or amide group . Later it was found that protons can be donated by S-H and C-H groups also, but these hydrogen bonds are weaker (1-2 kJ/mol) [19]. At the opposite end extremely strong hydrogen bonds are present in the ion HF−2 (161.5 kJ/mol) [21]. The
International Union of Pure and Applied Chemistry (IUPAC) defined the hydrogen bond in 1997 as
”... a form of association between an electronegative atom and a hydrogen atom attached to a second, relatively electronegative atom. It is best considered as an electrostatic interac- tion, heightened by the small size of hydrogen, which permits proximity of the interacting dipoles or charges. Both electronegative atoms are usually (but not necessarily) from the first row of the Periodic Table, i.e., N, O or F. Hydrogen bonds may be intermolecular or intramolecular. With a few exceptions, usually involving fluorine, the associated energies are less than 20-25 kJ/mol (5-6 kcal/mol)...”[20, 22]
Since the IUPAC definition for hydrogen bonds was considered not embracing enough, in 2005 IUPAC set up a core group of 14 crystallographers, spectroscopists, and theoreticians to examine this definition and recommend changes. The final task of their work was a podium discussion on the new definition of the hydrogen bond during the XIX. International Conference on ”Horizons in Hydrogen Bond Research” (G¨ottingen, Germany, September 11 - 17, 2011). Even if the mutual agreement between the core group and the present research community was not full, the new definition was accepted and states:
”A typical hydrogen bond may be depicted as X-H · · · Y-Z, where the three dots denote the bond. X-H represents the hydrogen-bond donor. The acceptor may be an atom or an anion Y, or a fragment or a molecule Y-Z, where Y is bonded to Z. In specific cases X and Y can be the same with both X-H and Y-H bonds being equal. In any event, the acceptor is an electron-rich region such as, but not limited to, a lone pair in Y or a π-bonded pair in Y-Z.”[20, 23]
2.2.2 Theoretical background [24]
The concept of the hydrogen bond evolves from consideration of Pauling’s atomic elec- tronegativities (the tendency for an atom to attract a pair of electrons that it shares with another atom). A consequence of the greater electronegativity of X relative to H in an X-H bond is that the hydrogen proton is descreened (it is stripped of some of its electron density). This results in a dipole at the terminus of the X-H bond which inter- acts with the dipole of the lone pairs on the acceptor atom. Consequently hydrogen bond donor strengths are qualitatively proportional to these differences in electronegativities:
F −H > O−H > N −H > C−H. The hydrogen bond has also a directional property, being strongest whenX−H· · ·Y = 180◦. Beyond the electrostatic part other components of the hydrogen bond energy were identified as delocalization, repulsion, and dispersion.
The electron distribution of the molecules is disturbed by the close approaches due to the hydrogen bonding. This gives rise to polarization and the quantum mechanical interactions, exchange repulsion, charge transfer, and dispersion. The polarization is the effect of the distortion of the electron distributions of X-H by Y and Y by X-H. This is a stabilizing interaction. The exchange repulsion is the short-range repulsion of the electron distribu- tions of the donor and acceptor groups and accounts for the overlap of charges in occupied orbitals of both donor and acceptor. With the application of the Pauli principle, it is re- pulsive and is the major destabilizing term. Charge transfer is the result of the transfer of electrons between occupied orbitals on the donor to vacant orbitals on the acceptor and vice versa. The electrostatic, polarization, and charge transfer components are attractive at equilibrium distances while the exchange repulsion is the balancing term.
As an example for O-H · · · O bonds at O · · · O = 2.8 ˚A, the electrostatic component contributes about 65% of the hydrogen bond energy. As the O · · · O distance becomes closer, the quantum mechanical charge transfer contributions become more important. For longer weak bonds, the interaction becomes more electrostatic.
3.1 Hydrogen bonded supramolecular systems
3.1.1 Synthesis
Details regarding the synthesis of molecular modules are beyond the scope of this thesis.
Molecules presented in figure 3.1 were prepared by collaborators at the University of Tri- este, Italy, and at the University of Namur, Belgium, according to previously published procedures[1, 25–27].
Fig. 3.1: Synthesis steps of the different molecules. Notation of the molecules: (A) - DIB - 1,4-diiodobenzene, 1 - 1-hexyl-6-ethynyl uracil, 3 - 1,4-bis[(1-hexylurac- 6-yl)ethynyl]benzene; (B) - TBB - 1,3,5-tribromobenzene, 5 - 4-ethynyl- 2,6-di(acetylamino)pyridine, 6 - 1,3,5-Tris-[(2,6-Di(acetylamino)pyridine-4-yl- )ethynyl]benzene; (C) - EA - 9-Ethynyl-anthracene, 2 - 1-hexyl-6-iodouracil, 4 - 1-hexyl-6-[(anthracen-9-yl)ethynyl]uracil; (D) - BTDB - 1-Bromo-3,4,5- tri(dodecyloxy)benzene, 5 - 4-ethynyl-2,6-di(acetylamino)pyridine, 7 - 2,6- Di(acetylamino)-4-{[3,4,5-tri(dodecyloxy)phenyl]ethynyl}pyridine.
3.1.2 Methods
Fourier transform infrared spectroscopy [28]
Fourier transform infrared spectroscopy (in the rest of the thesis just infrared spectroscopy) has found wide applications in the last decades. The design of an infrared spectrometer is based on that of the two-beam interferometer (designed by Michelson). The main advan- tage is that the whole spectrum is recorded during the measurement time (not just a region limited by resolution as in double-beam grating infrared spectrometers). The Michelson in- terferometer represented in figure 3.2 consists of a fixed mirror, a moving mirror and a beamsplitter. Light from a source is separated into two parts by the beamsplitter. After reflection by the two mirrors the two beams recombines at the beamsplitter. The output beam of the interferometer is recorded as a function of path difference, and is an interfero- gram. The infrared spectrum can be obtained by calculating the Fourier transform of the interferogram. Assuming a light source with intensity, I0(ω), the electric fields of the two interfering beams are
E1 =p
I0(ω)sinωt; E2 =p
I0(ω)sin
ωt+2ωx c
(3.1) wherex is the mirror displacement. The time-averaged intensity measured by the detector has anx dependence
dI(ω, x)∝ |E1+E2|2
dω. (3.2)
As all light frequencies are simultaneously processed, the detector measures the following intensity as a function of mirror position x:
I(x) = Z
dI = Z ∞
0
I0(ω)dω+ Z ∞
0
I0(ω) cos2ωx
c dω. (3.3)
The first term gives a constant (independent of x) while the second term represents the Fourier transform of the spectrum I0(ω). An infrared spectrum measurement has the fol- lowing steps: intensity I(x) is measured as a function of the mirror position x, then by Fourier transformation the single-beam spectrum I0(ω) is obtained. I0(ω) is composed of the spectrum of the source and the frequency-dependent response of the detector. The res- olution ∆ω is a function of the maximum mirror movement: ∆ω/c'1/x . To measure
the transmission of the sample, the single-beam spectrum of the reference and the sample has to be recorded (Ir and Is),
T = Is
Ir. (3.4)
Fig. 3.2: Schematic illustration of a Bruker IFS 66v Fourier transform infrared spectrom- eter.
Infrared spectra in the solid state were recorded in powders ground in potassium bro- mide (KBr) pellets. Reference pellets were pure KBr. Mixing the sample with KBr dilutes the material so it becomes transparent to infrared light, but the grain size in the pellets (∼ 1 µm) ensures that they still can be regarded as solids, preserving the structure. The sample:KBr mass ratio was approximately 1:400 (around 1 mg sample mixed with 400 mg of KBr powder). Prior starting an experiment the KBr powder was kept in a drying oven at 350 K for five hours to assure the anhydrous state of the powder. The size of the KBr/sample pellet was 13 mm and a load of 6 to 7 tons on the press gauge produced a disc of approximately 1 to 1.5 mm thickness. Temperature dependent measurements were performed in an optical cryostat (Advanced Research Systems) under dynamic vacuum conditions (10−3 mbar) starting from room temperature up to a temperature value charac- teristic to each sample (typically up to 370 - 550 K). Two different infrared spectrometers were used, a Bruker Tensor 37 and an IFS66v for the temperature dependence with 2 cm−1 resolution. All spectra were taken in the 400 - 4000 cm−1 range with a Ge/KBr beamsplitter and mercury-cadmium-telluride (MCT) detector. The light source was a Globar (SiC rod) which is a thermal light source. For some samples far-infrared spectra in the 50-400 cm−1 range were also measured in polyethylene discs. Far-infrared beamsplitters are made of
Mylar thin films while the detector is deuterated tri-glycine sulfate (DTGS). The baseline was corrected by an adjusted polynomial function.
Matrix isolation infrared spectroscopy
The matrix isolation (MI) technique has been developed by Pimentel and collaborators and represents a powerful technique in investigation of hydrogen bonds [19]. A gaseous mixture of the studied material is quickly frozen in a large amount of inert gas (e.g. argon, nitrogen, neon, krypton or xenon). Under such circumstances no diffusion can occur and the inert gas forms a rigid matrix that isolates the molecular constituents of the substance (figure 3.3). Isolated molecules are devoid of collisions and rotations and the infrared band linewidths are almost one order of magnitude narrower than that observed in condensed phase.
Fig. 3.3: Matrix isolation scheme. The rigid matrix of inert gas (shown as open circles) isolates molecules from each other preventing the formation of hydrogen bonds.
In my experiments I used a home made matrix isolation setup in the Laboratory of Molecular Spectroscopy, E¨otv¨os Lor´and University, Budapest. The setup is described in details elsewhere [29, 30]. Briefly, the evaporated sample was mixed with argon (Messer, 99.9997%) before deposition onto an 8-10 K CsI window. The gas flow was kept at 0.07 mmol min−1, while the evaporation temperature was optimized to get the shortest possi- ble deposition time and keep the concentration low enough to minimize the formation of dimers during deposition. MI spectra were recorded using a Bruker IFS 55 spectrometer with 1 cm−1 resolution and DTGS detector. Under these circumstances, the sample con- sists predominantly of isolated molecules, with only a small amount of aggregated species
present. Therefore, comparing MI spectra with solid-state KBr pellet spectra allows us to study the effect of aggregation.
Ab initio molecular dynamics calculations
Theoretical calculations presented in my thesis were done in collaboration with Dr. Jonas Bjork, Dr. Felix Hanke and Prof. Mats Persson from University of Liverpool and with P´eter Nagy from E¨otv¨os Lor´and University, Budapest. The theoretical results are presented in combination with the experimental data in chapters 4.3.2 [2] and 4.3.3 [3].
3.1.3 Infrared spectra of hydrogen bonds
Considering now the infrared spectra of a hydrogen bonded species X-H · · · Y-Z we will find very characteristic changes in the X-H and Y-Z stretching region [19, 31]. In particular the formation of the hydrogen bond introduces a very unusual change in the frequency and intensity distribution in the IR absorption spectrum. The disturbances are so distinctive that infrared spectra provide one of the most powerful methods to reveal the presence of hydrogen bonds [19].
Vibrational modes affected by the presence of hydrogen bonds are presented in figure 3.4. The main effect related to the presence of hydrogen bonds is a spectral shift of the absorption of the X-H stretching vibrational mode to lower wavenumbers [19]. Another important effect related to the stretching mode is the broadening of the bands and increase in the intensity of the vibrational bands. The bending modes X-H show different char- acteristics: spectral shift in the presence of hydrogen bonds is in the direction of higher wavenumbers and the magnitude of the shift is usually smaller than that of the stretching mode [19]. In the mid-infrared region isotopic substitution of hydrogen to deuterium shows important modifications in the spectrum. The spectral shift caused by the mass number changing is proportional to the square root of the isotopic masses. In the case of hydrogen to deuterium change the isotopic shift is approximately √12.
The far-infrared region is defined as the region between 20-400 cm−1 and usually provides information regarding the vibrations of molecules containing heavy atoms and molecular skeleton vibrations. However, another aspect related to the far-infrared region is the pos- sibility of direct observation of the vibration of hydrogen bonds [32]. The stretching (νσ)
Fig. 3.4: Vibrational modes of a hydrogen bonded complex. Subscripts s, b and t are assigned to stretching, bending and torsion vibrations, respectively while sub- scripts σ and β represents the stretching and bending vibrational modes in the far-infrared region created by the formation of the hydrogen bonded complex.
(adapted form ref. [19])
and bending (νβ) vibration of a hydrogen bond in the far-infrared region is illustrated in figure 3.4. The values ofνσ reported in the literature fall in the spectral range 75-250 cm−1 [32–34]. In contrast to the mid-infrared region, in the far-infrared part of the spectrum conventional isotopic substitution is of little value in confirming the presence of hydro- gen bonds [32]. Since the entire masses of both molecules are involved in the vibration of hydrogen bonds the frequency shift is only 2-3 cm−1. Such a spectral shift is within the experimental uncertainty of the location of band centers [32].
In this thesis, instead of isotopic substitution, hydrogen bonds were studied by their temperature dependence.
3.2 Silicon carbide quantum dots
3.2.1 Synthesis
SiC quantum dots were prepared by D´avid Beke and Istv´an Balogh at the Wigner Re- search Centre for Physics according to previously published procedures [4, 35, 36]. The term quantum dot is used because the size reduction induces a shift of the electronic exci- tations to higher energies in comparison to the starting bulk material. Another effect of the size confinement is a large surface to volume ratio which yields a complex surface struc- ture conferring unique vibrational, photonic and electronic properties. Figure 3.5 shows a typical high-resolution transmission electron microscopy (HRTEM) image of SiC quantum dots. The HRTEM image reveals that SiC quantum dots are nearly spherical, and the typical lattice spacing of 0.25 nm corresponds to the (111) plane of 3C-SiC. Though the detectability of oxide or carbon contaminants is limited by the presence of the carbon film substrate, the sharp contrast of the quantum dots indicates that there is no significant contamination on the surface of SiC quantum dots.
Fig. 3.5: HRTEM image and size distribution of SiC quantum dots. The average size is 4.8 nm [4], while the lattice spacing is 0.25 nm (HRTEM measurements per- formed by Zsolt Czig´any).
3.2.2 Surface sensitive infrared spectroscopy [9–11, 15]
Due to the broad range of the potential samples a multitude of spectroscopic techniques is necessary for a proper investigation. Usually, liquids are analyzed by transmission or attenuated total reflection (ATR), gaseous samples are best investigated by transmission, powders by ATR or diffuse reflectance (DRIFT). In the past transmission spectroscopy was the dominant technique, however, the special requirements for infrared spectroscopy to detect very weak signals of thin film layers or surface termination sites lead to an increase of using surface sensitive techniques like ATR or reflection-absorption spectroscopy (RAIRS).
Here I will provide a short description about the connection between ATR spectroscopy and the physical phenomena of internal reflection, and the role of the evanescent wave is also reviewed.
The main difference between normal transmission spectroscopy and surface sensitive methods (ATR, RAIRS) relies on the presence of a substrate for surface sensitive methods (silicon (Si), germanium (Ge), zinc sulfide (ZnS), zinc selenide (ZnSe), thallium bromoio- dide (KRS5) or diamond for ATR and metallic surfaces like gold (Au), silver (Ag) or copper (Cu) for RAIRS).
The basic physical phenomena of ATR is related to the reflectance of an interface (in- troduced in chapter 2.2), which is a well-understood phenomenon [9–11, 15].
In the case of internal reflection (n1>n2, figure 2.1 (a)) at incident angles corresponding to angles of refraction less than 900 the light is refracted through the interface. For the case of internal reflection (and only for this case) the incident angle can be increased beyond the maximum angle of refraction resulting in the total reflection of the incident radiation within the higher refractive index medium (optically denser medium). The angle at which the incident radiation is no longer refracted through the interface is called the critical angle.
From Snell’s law it follows that the critical angle is:
θc= arcsin n2
n1
, (3.5)
In order to eliminate the refraction angle from Fresnel equations and to obtain amplitude coefficients containing only sample parameters and incident geometry Snell’s law 2.10 is substituted in equations 2.11 and 2.12:
rk =−
η22
η1 cosθ1 −p
η22−η12sin2θ1
η22
η1 cosθ1+p
η22−η12sin2θ1
(3.6)
r⊥ = η1cosθ1−p
η22−η12sin2θ1 η1cosθ1+p
η22 −η12sin2θ1 (3.7) This new form of Fresnel equations is meaningful for the case of internal reflection, but also for complex refractive indices. For reasons of practical interest only the case of non- absorbing incident medium (η1 = n1 and is real) is treated. The complex refractive index of the second medium η2 is:
η2 =n2+iκ2, (3.8)
n2 and κ2 are the refractive index and extinction coefficient of the second medium, re- spectively. If the angle of incidence is greater than the critical angle, the value under the square root becomes negative and the square root becomes imaginary. Thus the Fresnel re- flection coefficients 3.6 and 3.7 become complex numbers and the reflectance of the interface is total. This is an indication that there is no electromagnetic field beyond the interface.
However, a very special kind of electromagnetic field, the evanescent field is established near the interface.
The evanescent field
To a first approximation the evanescent wave can be taken as a remnant of the transmitted wave. Following the electric field of the transmitted wave (according to the geometry of figure 2.1 (a)):
Et(r, t) = Et(0, t)eiη2ktr (3.9) where kt is the wave vector of the transmitted wave, r is the position vector in which we are observing the field, and the interface is in the x-y plane. The scalar product in the exponential term can be written as:
ktr =ktxx+ktyy+ktzz (3.10)
The x and y terms in 3.10 represents the propagation in the x-y plane. Thez term can be written as:
η2ktz =η2kcosθ2 =k q
η22−η12sin2θ1 (3.11) The term cosθ2 is meaningful in internal reflection only in the situation when the angle of incidence is smaller than the critical angle. The use of Snell’s law permits the extension of equation 3.11 to the region where the angle of incidence exceeds the critical angle (region of ATR spectroscopy). The square root in equation 3.11 is positive and real whenθ1<θc. In this situation the propagation along the z axis is oscillatory and the expression describes the refracted radiation. When the angle of incidence reaches the critical value, the value of the square root becomes negative and the term becomes imaginary. Equation 3.9 becomes:
E(x, y, z, t) = E(0,0,0, t)ei(kxx+kyy)e−kz
√
η12sin2θ1−η22
(3.12) Equation 3.12 describes the evanescent wave that propagates in the x-y plane, while the magnitude of the electric and magnetic field is attenuated exponentially in the z direction away from the interface. This is called an inhomogeneous plane wave and has a peculiar property: the wave is not transverse but has a component of the field parallel to the wave vectork (figure 3.6).
Fig. 3.6: Evanescent wave intensity at the interface surface is a function of both the inci- dent angle and the polarization components of the light beam. The incident light ray is total internal reflected at a glass/water interface having refractive indices of 1.518 and 1.333, respectively. The electric and magnetic field components of the evanescent waves for s- (a) and p polarization (b) of the incident radiation [37].
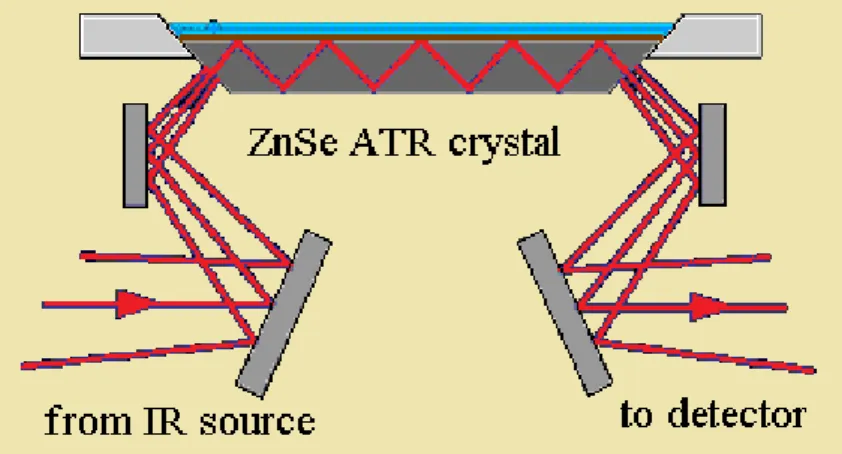
Attenuated total internal reflection spectroscopy
An ATR spectrum is obtained by measuring the interaction of the evanescent wave with the sample. Figure 3.7 shows a schematic representation of the horizontal ATR setup used in my work. Placing an absorbing material on the surface of an ATR crystal, the evanescent wave will be absorbed by the sample and its intensity will be attenuated in those regions where the sample absorbs. An ATR spectrum is produced by the attenuated radiation as
Fig. 3.7: Schematic representation of the horizontal ATR setup for liquids used during my work (adapted from ref. [38]).
a function of wavenumber and is similar to the conventional absorption spectrum. There are some differences related to band intensities at lower wavenumbers. The reason is due to the dependency of the penetration depth of the evanescent field on wavenumber. The penetration depth can be calculated from the wavelength of the incident radiation,λ, the refractive index of the internal reflection element (IRE), n1, the refractive index of the sample,n2, and the angle of incidence,θ1 [18]:
dp = λ
2πn1 r
sin2θ1−
n2
n1
2. (3.13)
The penetration depth can be controlled with the refractive index of the IRE element and the angle of incidence [18]. Table 4.1 presents this dependence for two ATR crystals used during my work.
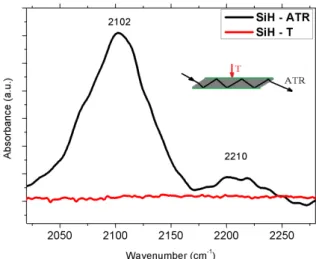
I will end this part with an experiment presenting a comparison between ATR and trans- mission spectroscopy. Figure 3.8 presents the spectrum of a hydrogenated silicon (Si) ATR crystal measured both in ATR and transmission mode (the geometry of the measurement
Tab. 3.1: Penetration depths (in µm) as a function of angle of incidence at 1000 cm−1 forn2 = 1.5
IRE material 300 450 600
Ge 1.2 0.66 0.51
ZnSe - 2.0 1.1
is presented in the figure 3.8). The size of the Si ATR crystal was 50x20x2 mm (LxWxT), the number of internal reflections 45. The hydrogenation of the Si surface was performed according to a procedure described elsewhere [39]. We consider the hydrogenated surface of the Si ATR crystal as a model for an atomic monolayer. The two bands seen in the
Fig. 3.8: Hydrogenated Si ATR crystal measured in ATR (black curve) and transmission mode (red curve). The measurement technique is visualized in the figure.
ATR spectrum in figure 3.8 are assigned to the Si-H vibrations of SiH and SiH2 groups.
Measuring the same surface in transmission mode the spectrum is empty, the transmis- sion technique is not sensitive enough to detect such weak signals. These results prove the potential of ATR in detecting surface related signals. An accurate measurement of the surface structure of SiC quantum dots has represented a central issue during my work as surface terminations play an important role in its physical and chemical properties. During synthesis procedures SiC quantum dots are suspended in different solvents (water, ethanol or methanol) and form colloidal solutions (a colloidal solution is a liquid mixture in which the particles do not dissolve, but rather become equally dispersed throughout the solvent).
For the ATR measurements drop drying method was used to cover the surface of the IRE
element with SiC quantum dots. ATR spectra were measured after solvent evaporation.
These results are described in chapter 5.3.
3.2.3 Photoluminescence spectroscopy [40, 41]
Fig. 3.9: The Jablonski diagram for photoluminescence.S0 is the ground singlet electronic state,S1 andS2 are the higher energy excited singlet electronic states. 0,1,2 are vibrational energy levels (adapted from ref. [40]).
Photoluminescence (PL) is a photon emission process that occurs during relaxation from electronic excited states. Such processes involve transitions between electronic and vibrational states of the fluorescent materials. Processes that occur between the absorption and emission of light are usually illustrated by Jablonski diagrams. Figure 3.9 shows a typical Jablonski diagram for fluorescence.
The transitions between states are depicted as vertical lines to illustrate the instan- taneous nature of light absorption (Frank-Condon principle). Transitions occur in about 10−15 s, a time too short for significant displacement of nuclei. At room temperature the thermal energy is not enough to considerably populate the excited vibrational states. Ab- sorption and emission occur mostly from the lowest vibrational energy states. Following light absorption, a fluorophore is usually excited to some higher vibrational level of S1 or S2. Fluorophores in condensed phases relax rapidly to the lowest vibrational energy level
ofS1 (internal conversion). Generally, such relaxation processes are complete prior to emis- sion (internal conversion occurs within 10−12 s while fluorescent lifetimes are much longer, in the order of 10−8 s). Return to the ground state typically occurs to a higher excited vibrational level, which then quickly reaches thermal equilibrium.
Fig. 3.10: Schematic representation of a Horiba Jobin Yvon Nanolog spectrofluorometer (adapted from ref. [41]).
During my work I have used photoluminescence spectroscopy to study the emission prop- erties of the SiC quantum dots. Photoluminescence spectra were recorded with a HORIBA Jobin Yvon Fluorolog-3 spectrofluorometer (Nanolog) presented in figure 3.10. The samples were measured in colloidal aqueous solution (concentration approx. 0.5 mg/ml).
supramolecular systems
4.1 Introduction
The formation and breaking of hydrogen bonds is one of the most fundamental processes in biology, chemistry, and materials science. For example, hydrogen bonding is responsible for the formation of the DNA double helix and for the highly unusual phase diagram of water or the secondary and tertiary structures in proteins; it is therefore at the very heart of life sciences. Furthermore, with the continuous down-scaling of technology in mind, the self-assembly and molecular recognition properties of hydrogen bonds have found their way into the fabrication of nanoscale materials and devices [42]. It is therefore imperative to understand the microscopic mechanisms that lead to the formation and dissolution of hydrogen bonds, in particular their temperature dependence. These processes are primarily driven by thermal fluctuations, which are particularly large in hydrogen bonded systems as they include very light atoms, and a relatively shallow and anharmonic potential energy well.
To study this process in a simple and controlled manner, numerous different systems have been suggested - for example short polypeptide segments [43, 44] or custom-designed molecular modules [45–48]. In this context, it is crucial to have detailed information from both experiment and theory so that the observed thermal fluctuation effects can be properly assigned. Systems that are particularly suited for the controlled study of hydrogen bond formation are small cyclically bonded nucleic base pairs, which play an important role as basic building blocks in both biology and nanotechnology [42]. Due to the many functional groups of such purines and pyrimidines taking part in hydrogen bonds, there are many ways
that both homomolecular [49] and heteromolecular pairing can be exploited, for instance in defect-free 2D supramolecular network formation with long range order [1, 50, 51].
The main requirement and at the same time the main challenge in molecular-based devices is the control of the materials at the nanoscopic level [52]. This control can be made through self-organization or self-assembly by non-covalent interactions ending up with controlled formation of higher order architectures from small building blocks. Even though extensive work has been published on the study of self-organization of molecular building blocks over an extended length scale [53–56], the preparation of self-assembled macroscopic materials is still far from the fabrication of supramolecular systems usable for applications in industry. On the other hand there are clear advantages for the ”bottom-up”
approach through weak supramolecular interactions (hydrogen bonds, dipole-dipole inter- actions, dispersion forces) as they include the simultaneous assembly of the predetermined molecular units, long-range order and the possibility of defect-free structures. Also the en- ergy of these weak interactions between the supramolecular constituents is comparable to the thermal energy slightly above room temperature so such systems are very dynamic:
weak interactions can be broken and formed back again within very short time scales [57].
The main structural characterization method of hydrogen bonded systems is scanning tunneling microscopy (STM) as it permits the visualization of the self-assembled two- dimensional (2D) structures. In contrast, my work was performed in solid-state (powder) samples, but as I will present later, my results also proved the supramolecular ordering of the molecular constituents.
This chapter is organized as follows: section 4.2 starts with the description of a supramolecular approach for the preparation of hydrogen bonded porous nanostructures followed by a brief literature overview of formation of supramolecular networks. Section 4.3 and 4.4 presents my work on the study of solids with homo- and heteromolecular ordering through formation of hydrogen bonds.
4.2 Hydrogen bonded networks
The formation of supramolecular networks through hydrogen bonding interaction between the components represents one of the main strategies to form two dimensional molecu-
lar structures [1, 25, 26, 42, 46, 47, 58–65]. An important possibility of forming hydrogen bonded networks is the design and synthesis of multivalent molecular modules which ex- pose at their peripheries complementary recognition sites [27]. It is possible to assemble supramolecular networks from different shaped building units: linear units with the reac- tive sites positioned at 1800 relative to each other, and angular units with either two-fold or higher symmetry axes. The geometry of each assembled system will be therefore dic- tated by the angularity of the non-linear components, while the size of the domains will be determined by the linear units (figure 4.1) [27].
Fig. 4.1: Supramolecular approach for the preparation of hydrogen bonded porous nanos- tructures [27].
One of the first examples of the formation of a mesophase through hydrogen bonding was reported by Yang et al. [66]. They present evidence of self-assembly between a barbituric acid derivative molecule (B) and a melamine derivative molecule (M) (figure 4.2 (a)). The supramolecular assembly (B·M) is possible through triple hydrogen bonds and possible applications in liquid crystals are expected.
The temperature dependent infrared spectra of the (B·M) complex are shown in figure 4.2 (b) and (c). The N-H stretching bands of (B·M) (3402, 3351, and 3310 cm−1) are differ- ent from those of the self associated constituents (B) and (M) (3198 cm−1, and 3360 and 3268 cm−1, respectively). Such changes suggest the presence of triple complementary hy- drogen bonds between (B) and (M). Analysis of the spectra between 1100 - 1800 cm−1 also
Fig. 4.2: (a) photoactive barbituric acid derivative, 5-[4-dodecyloxybenzylidene]-2, 4, 6,-(1H, 3H)-pyriminidinetrione (B) and melamine derivative, 4-amino-2, 6- didodecylamino- 1, 3, 5-triazine (M). (b) and (c) present the temperature de- pendent infrared spectra of (B·M) between 3100 - 3500 cm−1 and between 1100 - 1800 cm−1 (adapted from ref. [66]).
supports this conclusion. At elevated temperatures the molecular self-assembly is destroyed as a consequence of the melting of hydrogen bonds.
Other examples of supramolecular ordering involve the formation of honeycomb net- works from the co-deposition of perylene tetra-carboxylic di-imide (PTCDI) and melamine (1,3,5-triazine-2,4,6-triamine) on a silver terminated silicon surface [60], or from the co- deposition of a bis-functionalised uracyl-bearing linear molecule (1- left part of figure 4.3) and melamine (MEL) at the solid-liquid interface on highly oriented pyrolytic graphite (HOPG) surface [46]. Such empty hexagonal lattices are able to host different types of molecular guests such as fullerenes [60].
The right part of figure 4.3 presents the self-recognition of complementary molecules via triple hydrogen bonds. Several aspects were found to be crucial in the formation of highly ordered and preprogrammed porous networks at the solid-liquid interface: at high concentration only melamine molecules were physisorbed on HOPG and honeycomb as- semblies were obtained only with rather diluted solutions. Another aspect is related to the peripheral functionalization of the linear molecule which is needed to avoid strong side- to-side interactions between the molecules. Such bicomponent self-assembled monolayers
were used to gain detailed insights into phase segregation and polymorphism in two dimen- sional supramolecular systems by exploring the contribution of hydrogen-bond energy and periodicity, molecular flexibility, concentration and ratio of the components in solution as well as the effect of annealing via time-dependent and temperature-modulated experiments [46].
Fig. 4.3: STM images recorded at the solid-liquid interface of bicomponent nanoporous networks [46].
An interesting temperature-induced phase transition was observed on a linear molecular module of a 2D hydrogen bonded assembly by STM on Ag(111) surface. The phase tran- sition proceeds from a hexagonal porous network (left part of figure 4.4) to a close-packed rhombic arrangement (right part of figure 4.4). The two terminal groups of the bis-2,6- di(acetylamino)pyridine module are known to be involved in hydrogen bonding interaction showing a donor-acceptor-donor (DAD) conformation (the meaning of DAD is indicated in figure 4.5). STM measurements performed at 77 K in ultrahigh vacuum (UHV) found that for samples prepared before the annealing process the molecules arrange in a hexagonal porous network. In the proposed model, each unit interacts via two weak hydrogen bonds with two neighboring modules, while after annealing the sample at 420 K, the hexagonal network transforms into a close-packed 2D rhombic pattern shown in the right part of figure 4.4. Matenaet al. also found that the difference in intensity for the two acetyl units reveals a conformational difference between the two acetyl groups (indicated with two white arrows in the right part of figure 4.4 - panel (a)).
Fig. 4.4: STM images and the proposed model of the bis-2,6-di(acetylamino)pyridine mod- ule before and after annealing at 420 K (left part: a: scan range 34 x 34 nm2, b:
7 x 7 nm2; right part: a: 10 x 10 nm2, b: 39 x 39 nm2; adapted from ref. [63]).
Such an intermolecular interaction is equivalent to atrans-cis conformation change lead- ing to a (DADA)x2 dimer structure (as in figure 4.5). The cis conformation adopted by two of the four amidic bonds strongly promotes quadruple hydrogen bonding interactions favoring an unidirectional anisotropy. The amide unit in thecis conformation displays some flexibility due to a balance between attractive (hydrogen bonds) and repulsive (steric de- mands) interactions. In this situation the formation of the hexagonal network is kinetically controlled while the rhombic assembly represents the thermodynamically stable phase and the control over the conformational state of adsorbed molecules play an important role in the design of writeable organic-based nanostructures.
Fig. 4.5: Influence of the cis and trans conformers on the dimerisation processes [63].
4.3 Study of solids with homomolecular association
The materials I investigated were members of an extended molecular library with molec- ular units containing hydrogen bond-forming functional groups, which makes possible the self-recognition and self-organization of them in a predictable manner [27]. In particular, molecular modules featuring 2,6-di(acetylamino)pyridine moieties able to selectively recog- nise uracil-bearing modules were engineered. The components of the molecular library are presented in figure 4.6.
Fig. 4.6: Molecular library
Figure 4.7 shows the homomolecular self-organization of two uracil based modules (a) and di(acetylamino)-pyridine based modules (c) while the heteromolecular recognition is mediated via triple hydrogen bonds established between the NH-N-NH (DAD) terminations of the 2,6-di(acetylamino)pyridine and the CO-NH-CO (ADA) imidic groups of the uracil based modules (b) [27]. These molecules come from a collaboration with Prof. Davide Bonifazi’s laboratory at the University of Trieste, Italy.
![Fig. 2.3: Typical dispersion curves for the real part η and the imaginary part κ of the refractive index as a function of frequency [17].](https://thumb-eu.123doks.com/thumbv2/9dokorg/513871.24/18.892.255.671.593.1027/typical-dispersion-curves-imaginary-refractive-index-function-frequency.webp)
![Fig. 3.1: Synthesis steps of the different molecules. Notation of the molecules: (A) - -DIB - 1,4-diiodobenzene, 1 - 1-hexyl-6-ethynyl uracil, 3 - 1,4-bis[(1-hexylurac-6-yl)ethynyl]benzene; (B) - TBB - 1,3,5-tribromobenzene, 5 - 4-ethynyl-2,6-di(acetylam](https://thumb-eu.123doks.com/thumbv2/9dokorg/513871.24/25.892.222.691.596.970/synthesis-different-molecules-notation-molecules-diiodobenzene-hexylurac-tribromobenzene.webp)

![Fig. 3.5: HRTEM image and size distribution of SiC quantum dots. The average size is 4.8 nm [4], while the lattice spacing is 0.25 nm (HRTEM measurements per-formed by Zsolt Czig´ any).](https://thumb-eu.123doks.com/thumbv2/9dokorg/513871.24/31.892.309.606.639.1070/hrtem-distribution-quantum-average-lattice-spacing-hrtem-measurements.webp)

![Fig. 4.1: Supramolecular approach for the preparation of hydrogen bonded porous nanos- nanos-tructures [27].](https://thumb-eu.123doks.com/thumbv2/9dokorg/513871.24/41.892.245.665.422.712/supramolecular-approach-preparation-hydrogen-bonded-porous-nanos-tructures.webp)
![Fig. 4.3: STM images recorded at the solid-liquid interface of bicomponent nanoporous networks [46].](https://thumb-eu.123doks.com/thumbv2/9dokorg/513871.24/43.892.250.669.328.615/images-recorded-solid-liquid-interface-bicomponent-nanoporous-networks.webp)

