Experimental verification platform for connected vehicle networks
Sergei S. Avedisov, Gaurav Bansal, Adam K. Kiss, and G´abor Orosz
Abstract— In this paper we propose a framework for ex- perimentally evaluating the dynamics of connected vehicle networks using production vehicles. Connected vehicle networks contain human-driven connected vehicles which use wireless vehicle-to-vehicle (V2V) communication to transmit and receive messages, and connected automated vehicles that may use the received information to control their longitudinal motion. We use the developed framework to perform experiments on a connected vehicle network featuring two connected vehicles and one connected automated vehicle on public roads. The experiments show that by letting the connected automated vehicle utilize long-range connections we can benefit the traffic flow in connected vehicle networks. Lastly, we demonstrate that an analytical model of the connected vehicle network with matched parameters is able to reproduce the experimental results.
I. INTRODUCTION
Wireless vehicle-to-everything (V2X) communication has the potential to enhance the environmental perception of automated vehicles, giving them information beyond-line- of-sight of sensors such as cameras, lidars, or radars. For example, connected vehicles in traffic are able to send and receive wireless messages over hundreds of meters [1]. An automated vehicle equipped with wireless V2X communica- tion can then receive information from remote vehicles and thus be cognizant of large-scale traffic fluctuations. These so- called connected automated vehicles can then be designed to respond to these traffic fluctuations and improve congestion.
The merits of wireless connectivity in improving traffic flow have been extensively explored using analytical tech- niques and numerical simulations. In particular strategies using vehicle-to-vehicle (V2V) communication such as coop- erative adaptive cruise control (CACC) [2]–[4] and connected cruise control (CCC) [5]–[8] were proposed and analyzed using rigorous analytical methods, simulations, and small- scale experiments. The latter usually involved platoons of several vehicles on the road. Such experiments are not convenient for analyzing traffic patterns such as traveling waves, as these patterns emerge on a large scale.
A common technique employed to analyze traffic patterns is to put vehicle networks on a single-lane ring road [9]–
[11]. This configuration allows traffic patterns to develop and then propagate around the ring for relatively small numbers of vehicles. Experiments with vehicles driving on ring roads
Sergei S. Avedisov and G´abor Orosz are with the Department of Me- chanical Engineering, University of Michigan, Ann Arbor, MI 48109, USA {hchaozhe,orosz}@umich.edu
Gaurav Bansal is with the Toyota InfoTechnology Center, Mountain View, CA 94043, USAgbansal@us.toyota-itc.com
Adam K. Kiss is with the Department of Applied Mechanics, Budapest University of of Technology and Economics, Budapest 1111, Hungary kiss a@mm.bme.hu
also demonstrate that traffic patterns such as uniform flow and congestion waves can be recreated [12], [13]. However, due to the fact that the vehicles are driving on a ring, the vehicle speeds in these experiments are not representative of typical freeway speed. Driving on a ring road at high speed introduces significant lateral dynamics, and drivers become focused on turning rather than following the car ahead.
In this paper we introduce an experimental framework for evaluating vehicle networks which allows for traffic pattern propagation but does not require vehicles to travel on a physical ring. We demonstrate via experiments on public roads that this framework can be implemented at realistic speed and we demonstrate the benefits of long-range V2V communication for connected vehicle networks. We also show that the experimental results agree with those obtained from simulating analytical models when the human parame- ters are matched to those of real drivers in the experiments.
The experimental setup that allows us to evaluate traf- fic patterns in connected vehicle networks without placing vehicles on a circular road is developed in Section II.
The dynamical models of the human-driven and connected automated vehicles used in this experiment are presented in Section III. The experimental results are described and com- pared to model-matched simulations in Section IV. Finally, we summarize our findings and make remarks in Section V.
II. EXPERIMENTALSETUP
Since our goal is to study experimentally how long-range V2V communication may be utilized to change traffic patters we are interested in how vehicle velocity fluctuations propa- gate along vehicle chains. A common way in the literature to study such problems is to placeNvehicles on a circular road of lengthL[10], [14], [15]. This leads to a periodic boundary condition as the N + 1-st and the 1-st vehicle become the same. Moreover, the average spacing of vehicles
h∗avg= 1 N
L−
N
X
i=1
`i
(1) can be controlled by adjusting the ring lengthL and/or the number of vehiclesN.
This setup may allow one to study traffic patterns such as uniform flow or traveling waves depending on parameters of the longitudinal dynamics and the average spacing (1).
This setup was used in [12] to demonstrate the formation on traffic jams with human-driven vehicles while in [13] and automated vehicle was placed among human-driven cars and it was shown that it can mitigate congestion by keeping a large distance to its predecessor. However the speeds and 2018 21st International Conference on Intelligent Transportation Systems (ITSC)
Maui, Hawaii, USA, November 4-7, 2018
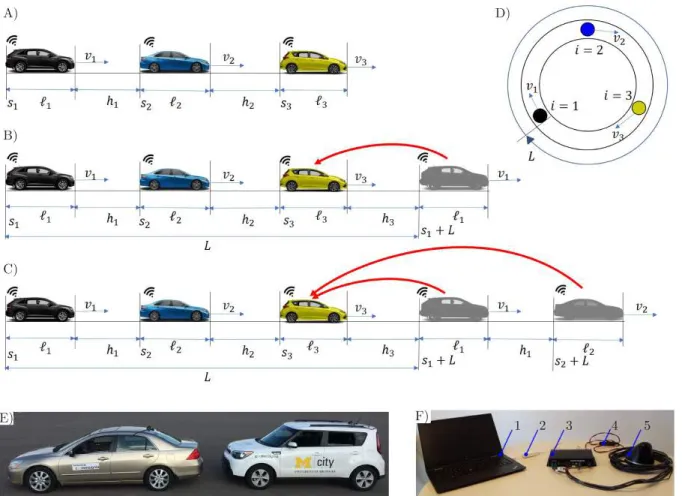
Fig. 1: A): Connected vehicle network consisting of human-driven connected vehicles (black and blue) and a connected automated vehicle (yellow). B): The tail vehicle is projected in front of the head vehicle to provide a periodic boundary condition. C): Both connected vehicles are projected in front of the head vehicle. D): Representation of the connected vehicle network on a ring road. E): Actual vehicles used in the experiment with a human-driven connected vehicle on the left and a connected automated vehicle on the right. F): V2V devices for connected vehicles – 1: an upper level computer,
2: an ethernet cable, 3: electronic control unit, 4: power cable, 5: antennae.
vehicle spacings achieved in these experiments had to be kept low (below10 [m/s]) in order to keep the lateral acceleration within a comfortable limit and allow drivers to focus on car following rather than steering. That is, this setup does not allow one to evaluate the traffic patterns for realistic speeds.
In order to solve this problem we propose to use V2V con- nectivity in order to establish a periodic boundary condition without having vehicles to drive on a ring. The key idea is to allow the head vehicle of an open chain to observe the motion of the tail vehicle of the chain. Then by adding the ring length Lto the longitudinal coordinate of the tail vehicle it can be virtually placed ahead of the head vehicle as illustrated in Figure 1 A,B for a three-vehicle chain. In this case, the head vehicle (yellow) is a connected automated vehicle which is followed by two human-driven connected vehicles (blue and black). Then usings1+Lin the controllers of the connected automated vehicle the black car can be ”placed” in front of it. This setup allows the human drivers of the blue and black vehicles to drive at realistic speed ranges while ”closing the
ring” via V2V communication.
Moreover, the established periodic boundary condition allows one to evaluate the impact of an automated vehicle in traffic flow for different ring lengths (as connectivity is only used to respond to the motion of one vehicle ”ahead”).
Indeed, this idea can be extended to multiple vehicles in the chain as shown in Figure 1 C wheres2+Lis also used in the controllers of the connected automated vehicle. This provides the simplest setup to evaluate the impact of a connected automated vehicle using beyond-line-of-sight information in traffic flow (as connectivity is used to respond to the motion of multiple vehicles ”ahead”).
In the forthcoming experiments wireless vehicle-to-vehicle (V2V) communication is realized using the devices shown in Figure 1 F. They consist of an electronic control unit and an antennae which transmits basic safety messages (BSM) using standardized Dedicated Short Range Communication protocol [16], [17]. The information broadcasted includes position and velocity. The devices are powered through a 12
Volt power outlet and can be retrofitted to any conventional vehicle. The vehicles shown in Figure 1 E are equipped with such V2V devices. Moreover, the vehicle on the right is also capable of automated driving. In particular, the throttle and the brakes can be commanded based on the data received from the other vehicles via V2V communication.
III. LONGITUDINALVEHICLEDYNAMICS
In this section we develop a model to describe human car following behavior. Then we showcase a controller for the connected automated vehicle (CAV) that is based on human car following but is able to respond to the motion of multiple vehicles ahead based on vehicle-to-vehicle communication.
Let us denote the position of the rear bumper of vehicleiby si and its velocity byvi; see Figure 1 A. We neglect effects of air drag, rolling resistance, and grade. Thus, for vehiclei the longitudinal dynamics are given by
˙
si(t) =vi(t),
˙
vi(t) =fsat(ui(t)), (2) where the dot represents differentiation with respect to time t, ui represents the scaled driving force commanded by the vehicle operator, and the saturation function fsat represents the limits of the engine and brakes of the vehicle. In particular, we use
fsat(u) =
umin, if u≤umin,
u, if umin< u < umax, umin, if u≥umax,
(3)
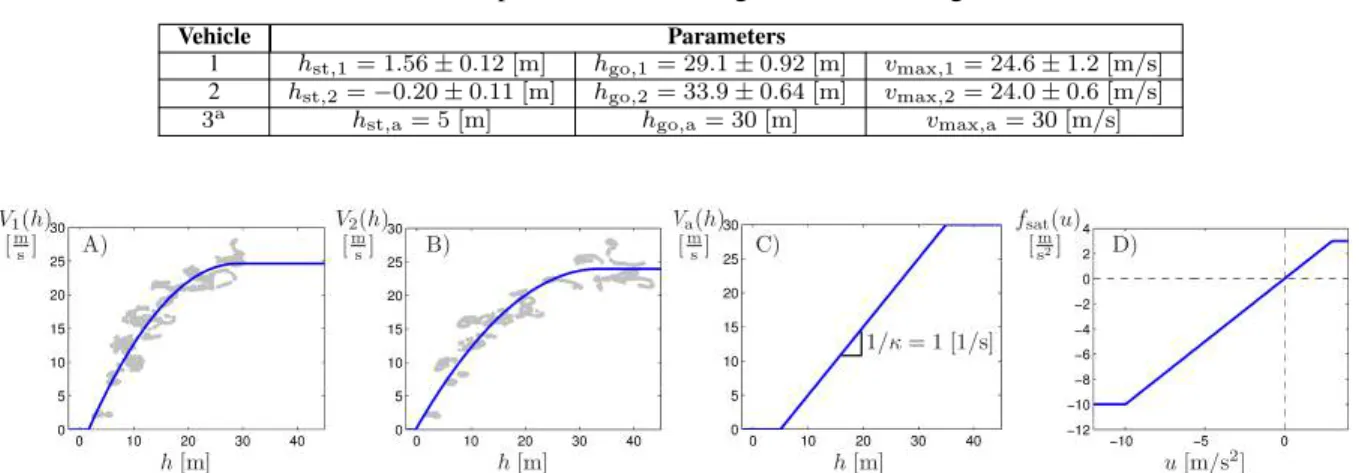
shown in Figure 2 D with limits umax = 3 [m/s2] and umin = −10 [m/s2] that were physically observed in the experiments performed with the vehicles in Figure 1 E.
A. Human Drivers
For human driven connected vehicles (black and blue vehicles in Figure 1 A) the driver observes the motion of the vehicle ahead and chooses the acceleration based on the headway (distance from its front bumper to the rear bumper of the preceding vehicle) and the relative velocity to the vehicle ahead. We use a model adopted from [9], [15] and assume that the driver of vehicle i responds to the motion of the preceding vehicle using the nonlinear controller
ui(t) =αi
Vi hi(t−τi)
−vi(t−τi)
+βi vi+1(t−τi)−vi(t−τi) (4) whereτi represents the sum of the driver reaction time and the actuation delay while theαiandβi are control gains for the headway and relative velocity feedbacks, respectively.
The headway feedback term in (4) involves the nonlinear functionVi(h), called range policy or optimal velocity func- tion [15], which satisfies the following properties:
1) Vi(h)is continuous and monotonically increasing (the more sparse the traffic is, the faster the vehicles want to travel).
2) Vi(h)≡0forh≤hst,i(in dense traffic vehicles intend to stop).
3) Vi(h)≡vmax,iforh≥hgo,i(in sparse traffic vehicles intend to travel with the maximum speed).
These properties are satisfied by the function Vi(h)
=
0, if h≤hst,i,
vmax,i
1− h
go,i−h hgo,i−hst,i
2
, if hst,i< h < hgo,i,
vmax,i, if h≥hgo,i.
(5) Examples of this range policy function are given by the blue curves in Figure 2 A and B. The corresponding parameters are given as the mean values in the first two rows of Table I.
These were determined from experiments by model matching as detailed in Section IV.
B. Connected Automated Vehicle
Here we consider a connected automated vehicle (CAV) using a controller inspired by human car following but extended so that it is able to utilize wireless information coming from beyond-line-of-sight. The feedback structure of the CAV controller is designed to reflect (4) in order to make it readily acceptable by its passengers and other road users [8]. The CAV responds to the connected vehicles in the network using the nonlinear controller
u3(t) =a
Va h3(t−τa)
−v3(t−τa) +b1 v1(t−τa)−v3(t−τa) +b2 v2(t−τa)−v3(t−τa)
(6)
where τa is the sum of the communication and actuation delays while the a, b1, and b2 are control gains for the headway feedback term and relative velocity feedback terms according to configuration in Figure 1 D. Also, we design the piecewise linear range policy
Va(h) =
0, if h≤hst,a,
vmax,a h−hst,a
hgo,a−hst,a, if hst,a< h < hgo,a, vmax,a, if h≥hgo,a,
(7)
with the parameters provided in the third row of Table I.
The corresponding function is plotted in Figure 2 C. Such a design gives an intuitive interpretation to the middle section of the range policy. The reciprocal of the slope of the middle portion is given byκ= h vmax,a
go,a−hst,a has a unit of [1/s], and can be adjusted to tune the ”aggressiveness” of the CAV’s controller. In our case, the slope is set toκ= 1 [1/s]. The headway feedback gain is tuned toa = 0.4 [1/s] based on safety considerations, and τa = 0.6 [s] was extablished in prior experiments with this CAV. Again, notice the similarity between (6) and (4). In the next section we look at two scenarios: the one car look ahead scenario where b1 = 0.5 [1/s], b1 = 0, and the two car look ahead scenario whereb1= 0.2 [1/s], b1= 0.3 [1/s].
TABLE I: Range policy parameters for vehicles in connected vehicle network.
a Since CAV parameters are designed, no error is given.
Vehicle Parameters
1 hst,1= 1.56±0.12 [m] hgo,1= 29.1±0.92 [m] vmax,1= 24.6±1.2 [m/s]
2 hst,2=−0.20±0.11 [m] hgo,2= 33.9±0.64 [m] vmax,2= 24.0±0.6 [m/s]
3a hst,a= 5 [m] hgo,a= 30 [m] vmax,a= 30 [m/s]
Fig. 2: A): Experimentally fitted range policy for vehiclei= 1. B): Experimentally fitted range policy for vehiclei= 2.
C): Designed range policy for the connected automated vehicle. D): Saturation function for the acceleration of vehicles used in simulation.
IV. EXPERIMENTALRESULTS
In this section we show the experimental results of evalu- ating the benefits of long-range wireless communication on traffic patterns in the connected vehicle network using the framework detailed in Section II. We also demonstrate that the collected experimental data can be used to obtain specific parameters for the human car following model (4,5), and that dynamical models with these parameters replicate the experimental results.
We performed experiments on a straight public road where the connected automated vehicle was set up in a one car look ahead configuration (Figure 1 C) and a two car look ahead configuration (Figure 1 D). For the first configuration we used gains b1 = 0.5 [1/s], b2= 0.0 [1/s] for the connected automated vehicle while in the second configuration we used b1 = 0.2 [1/s], b2 = 0.3 [1/s]. In both configurations the ring length L was varied between 15 [m] and 105 [m] in 15 [m]increments, which corresponds to varying the average vehicle spacingh∗from0 [m]to30 [m]in5 [m]increments.
This range of spacings between vehicles was chosen based on intuition from prior experiments where human-driven vehicles were observed to stop within 0-5 [m] and travel 30-40 [m] away from each other at free flow speed. For each L the vehicles started from a stationary configuration and then were given some time to approach either a steady state where they traveled close to uniform flow or reached steady oscillatory behavior where they periodically slowed down and speeded up.
The first and third rows of Figure 3 show time profiles of the headways and velocities of the three vehicles for average spacings of15 [m]and25 [m], with the first column corresponding to the one car look ahead configuration, and the third column to the two car look ahead configuration.
The experimental results forh∗avg= 15 [m]show that the one car look ahead configuration results in oscillations in
the vehicles’ headways and velocities, whereas in the two car look ahead configuration, the vehicles approach uniform flow, where they keep constant headways and have constant velocity. This difference in traffic behavior was observed for several trials at this vehicle spacing when the network started from different initial conditions and was provided with different disturbances (which involved human driven car1 performing a braking maneuver).
For h∗avg = 25 [m], the oscillations in the one car look ahead configuration are less significant than for h∗avg = 15 [m], while the two car look ahead configuration approach- es a uniform flow similar to theh∗avg= 15 [m]case. Again, such results we observed consistently for different initial conditions and different disturbances. In general the one car look ahead configuration was more prone to developing steady oscillations that the two-car-look ahead configuration, where oscillations were not as significant and only appeared as transients.
A. Model Matching and Simulations
To show that the traffic patterns observed in the experiment correspond to the ones observed in car following models, we select the parameters for the human car-following model (4,5) via a two-step model matching process.
In the first step we fit the range policy (5) to the experi- mental data to findhst,i,hgo,i, andvmax,iin the range policy (5). To do this we select segments in the experimental data where the system was close to a uniform flow with vehicles traveling at roughly constant speed while maintaining con- stant headways (for example, see the third column Figure 3).
The headways and velocities corresponding to these steady states are plotted as grey dots in Figure 2 A and B for vehicles 1 and 2, respectively. The blue curves correspond to the fitted range policies, with the parameters given in the first two rows of Table I.
Fig. 3: Time profiles of vehicle headways and vehicle velocities obtained experimentally and via a model-matched simulation for the connected vehicle network in one car look ahead configuration Figure 1 C and two car look ahead configuration for average vehicle spacingsh∗= 15 [m]andh∗= 25 [m]. Black curves correspond to vehicle i= 1, blue
curves correspond to vehiclei= 2, and green curves correspond to the CAV.
In the second step of the model-matching we select the appropriate gains αi, βi and time delay τi for the human drivers in (4). For simplicity, we assume both human drives have similar gains and delays, i.e., αi =αh, βi =βh, τi = τh, but, indeed, this step can be generalized to the scenario when these parameters are different for each driver. We select the gains and delays by minimizing two cost functions over a range ofαh, βh andτh.
The first cost function calculates the sum of squared differences between the measured and simulated headways
and velocities for all cars:
Jcar(αh, βh, τh) = 1 tend−tst
3
X
i=1
Z tend tst
hmi (t)−hi(t)2
+C vim(t)−vi(t)2 dt.
(8) This cost was averaged for all runs (14 total). The su- perscript ”m” indicates measured quantities, whereas the unsubscripted headways and velocities denote data obtained by simulating the network Figure 1 B starting from the same initial condition. HereCis a constant, which we set to1[s2].
The second cost function seeks to match the traffic patterns
between the measurements and simulations:
Jtrf(αh, βh, τh) = ∆vm−∆v2
, (9)
where
∆v= 1 tset
Z
tset
max
i,j=1,2,3|vi(t)−vj(t)|dt, (10) gives the average speed difference between the fastest and the slowest moving vehicle in the connected vehicle network taken over a period of time tset when the network settled down to either uniform flow or steady oscillations. More specifically, for the experiments this period of time is taken as a time segment of at least 20 seconds where the trajectories either approach uniform flow, or exhibit constant amplitude oscillations. For the simulation results this segment is taken as the last 20 seconds of the simulation. Again, this cost was averaged for all 14 runs. Intuitively small ∆v correspond to the network being close to uniform flow, whereas large
∆v correspond to traffic congestion [10], [14], [15]. Again, the superscripts are used to distinguish experimental and simulated quantities as in (8).
We select the gainsαh,βhand the delayτhfor which the values of both of the above cost functions are sufficient- ly small. For the 14 runs considered we obtained αh = 0.1 [1/s], βh = 0.6 [1/s] and τh = 0.8 [s]. We show the simulation results with these parameters for h∗avg = 15 [m]
and h∗avg = 25 [m] in the second and fourth columns of Figure 3. Indeed, the simulations reproduce the experiments with high accuracy in both the one car look ahead and the two car look ahead scenarios. The simulations confirm that the two car look ahead configuration tends to uniform flow more so than the one car look ahead configuration. This highlights the benefits of long-range wireless communication in stabilizing traffic flow.
V. CONCLUSION
In this paper we proposed an experimental evaluation framework for traffic patterns in connected vehicle networks at real-world vehicle speed ranges. We used this framework to demonstrate that connected automated vehicles utilizing long-range V2V connections may improve traffic flow. Lastly we showed that the results of these experiments can be re- produced by mathematical models. The established and val- idated experimental framework shown in this paper provides us with multiple new opportunities in studying connected vehicle networks. We seek to use the established experi- mental framework in subsequent experiments where we can study the effects of multiple connected automated vehicles on traffic patterns in larger connected vehicle networks. Also, results obtained from such experiments may yield realistic human driver models for large-scale simulations, which can be used to study the impact of connected and connected automated vehicles on traffic flow.
ACKNOWLEDGMENT
The authors would like to thank Chaozhe He and Jin Ge for helping to design and execute the experiments. The
research reported in this paper was supported by the Higher Education Excellence Program of the Ministry of Human Capacities in the frame of TOPIC research area of Budapest University of Technology and Economics (BME FIKP-MI)
REFERENCES
[1] T. Mangel, M. Michl, O. Klemp, and H. Hartenstein, “Real-world measurements of non-line-of-sight reception quality for 5.9 ghz ieee 802.11p at intersections,” inCommunication Technologies for Vehicles.
Springer, 2011, pp. 189–202.
[2] S. E. Shladover, D. Su, and X.-Y. Lu, “Impacts of cooperative adap- tive cruise control on freeway traffic flow,”Transportation Research Record: Journal of the Transportation Research Board, vol. 2324, pp.
63–70, 2012.
[3] J. Ploeg, N. van de Wouw, and H. Nijmeijer, “Fault tolerance of cooperative vehicle platoons subject to communication delay,” in Proceedings of the 12th IFAC Workshop on Time-Delay Systems.
IFAC, 2015, pp. 352–357.
[4] V. Milan´es and S. E. Shladover, “Handling cut-in vehicles in strings of cooperative adaptive cruise control vehicles,”Journal of Intelligent Transportation Systems, vol. 20, no. 2, pp. 178–191, 2016.
[5] L. Zhang and G. Orosz, “Motif-based design for forward-looking delayed networks with applications to connected vehicle systems,”
IEEE Transactions on Intelligent Transportation Systems, vol. 17, no. 6, pp. 1638–1651, 2016.
[6] G. Orosz, “Connected cruise control: modelling, delay effects, and nonlinear behaviour,” Vehicle System Dynamics, vol. 54, no. 8, pp.
1147–1176, 2016.
[7] D. Hajdu, J. I. Ge, T. Insperger, and G. Orosz, “Robust design of connected cruise control among human-driven vehicles,” p. submitted, 2018.
[8] J. I. Ge, S. S. Avedisov, C. R. He, W. B. Qin, M. Sadeghpour, and G. Orosz, “Experimental validation of connected automated vehicle design among human-driven vehicles impacts on traffic safety and effciency,” Transportation Research Part C, vol. 91, pp. 335–352, 2018.
[9] M. Bando, K. Hasebe, K. Nakanishi, and A. Nakayama, “Analysis of optimal velocity model with explicit delay,”Physical Review E., vol. 58, no. 5, pp. 5429–5435, 1998.
[10] G. Orosz, R. E. Wilson, and G. St´ep´an, “Traffic jams: dynamics and control,”Philosophical Transactions of the Royal Society A, vol. 368, no. 1928, pp. 4455–4479, 2010.
[11] S. S. Avedisov and G. Orosz, “Analysis of connected vehicle systems using network-based perturbation techniques,”Nonlinear Dynamics, vol. 89, no. 3, pp. 1651–1672, 2017.
[12] Y. Sugiyama, M. Fukui, M. Kikuchi, K. Hasebe, A. Nakayama, K. Nishinari, S. ichi Tadaki, and S. Yukawa, “Traffic jams without bottlenecks experimental evidence for the physical mechanism of the formation of a jam,”New Journal of Physics, vol. 10, no. 3, p. 033001, 2008.
[13] R. E. Stern, S. Cui, M. L. D. Monache, R. Bhadani, M. Bunting, M. Churchill, N. Hamilton, R. Haulcy, H. Pohlmann, F. Wu, B. Piccoli, B. Seibold, J. Sprinkle, and D. B. Work, “Dissipation of stop-and- go waves via control of autonomous vehicles: Field experiments,”
Transportation Research Part C, vol. 89, pp. 205–221, 2018.
[14] I. Gasser, G. Sirito, and B. Werner, “Bifurcation analysis of a class of ’car following’ traffic models,” Physica D, vol. 197, no. 3-4, pp.
222–241, 2004.
[15] S. S. Avedisov and G. Orosz, “Nonlinear network modes in cyclic systems with applications to connected vehicles,”Journal of Nonlinear Science, vol. 25, no. 4, pp. 1015–1049, 2015.
[16] G. Orosz, J. Ge, C. R. He, S. S. Avedisov, W. B. Qin, and L. Zhang,
“Seeing beyond the line of sight - controlling connected automated vehicles.” ASME Dynamic Systems and Control Magazine, vol. 5, no. 4, pp. 8–12, 2017.
[17] SAE, “Dedicated Short Range Communications (DSRC) Message Set Dictionary Set,” SAE International, SAE J2735SET 201603, 2016.