The role of matrix substrate-level phosphorylation during anoxia
PhD thesis
Gergely Kiss
Semmelweis University
János Szentágothai Doctoral School of Neurosciences Functional Neurosciences Program
Supervisor: Christos Chinopoulos, PhD
Official reviewers: Ferenc Gallyas Jr, DSc Tamás Kardon, PhD Chairman of
the final examination board: József Mandl, DSc Members of
the final examination board: Erzsébet Ligeti, DSc Olivér Ozohanics, PhD
Budapest
2014
TABLE O F CONTE NTS
1. ABBREVIATIONS ... 4
2. INTRODUCTION ... 7
2.1 The mitochondrial proton circuit ... 7
2.2 Defining the mitochondrial respiratory steady states ... 9
2.3 The FO-F1 ATP synthase ... 14
2.4 The adenine nucleotide translocase ... 16
2.5 Directional asynchrony in the operation of FO-F1 ATP synthase and ANT ... 17
2.6 Computational estimations of Erev_ATPase and Erev_ANT ... 20
2.7 Contribution of matrix substrate-level phosphorylation ... 23
2.8 Barriers preventing mitochondrial consumption of cytosolic ATP ... 25
2.9 What is the actual value of [ATP4-]freein/[ADP3-]freein ratio? ... 28
2.10 The critical role of α-ketoglutarate dehydrogenase complex in maintaining mitochondrial phosphorylation potential during respiratory arrest ... 29
2.11 Provision of NAD+ to KGDHC is essential for the uninterrupted generation of matrix ATP by substrate-level phosphorylation ... 31
3. AIMS AND OBJECTIVES ... 33
4. MATERIALS AND METHODS ... 35
4.1 Animals ... 35
4.2 Isolation of mitochondria from mouse and pigeon liver, mouse heart and brain ... 36
4.3 Isolation of synaptosomes from mouse brain ... 36
4.4 Neuronal cultures ... 37
4.5 Determination of membrane potential in isolated liver, heart, brain, in situ synaptic and in situ neuronal somal mitochondria ... 37
4.6 Fluorescence imaging ... 39
4.7 [Mg2+]free determination from Magnesium GreenTM (MgG) fluorescence in the extramitochondrial volume of isolated mitochondria and conversion to ADP- ATP exchange rate ... 39
4.8 Mitochondrial respiration ... 41
4.9 Determination of extramitochondrial pH changes ... 42
4.10 Mitochondrial matrix pH (pHi) determination ... 42
4.11 Determination of NADH fluorescence in isolated liver mitochondria... 43
4.12 Determination of KGDHC activity ... 43
4.13 Determination of SUCL activity ... 43
4.14 Cross-linking, co-precipitation and western blotting ... 44
4.15 Statistical analysis ... 45
4.16 Reagents ... 45
5. RESULTS ... 46
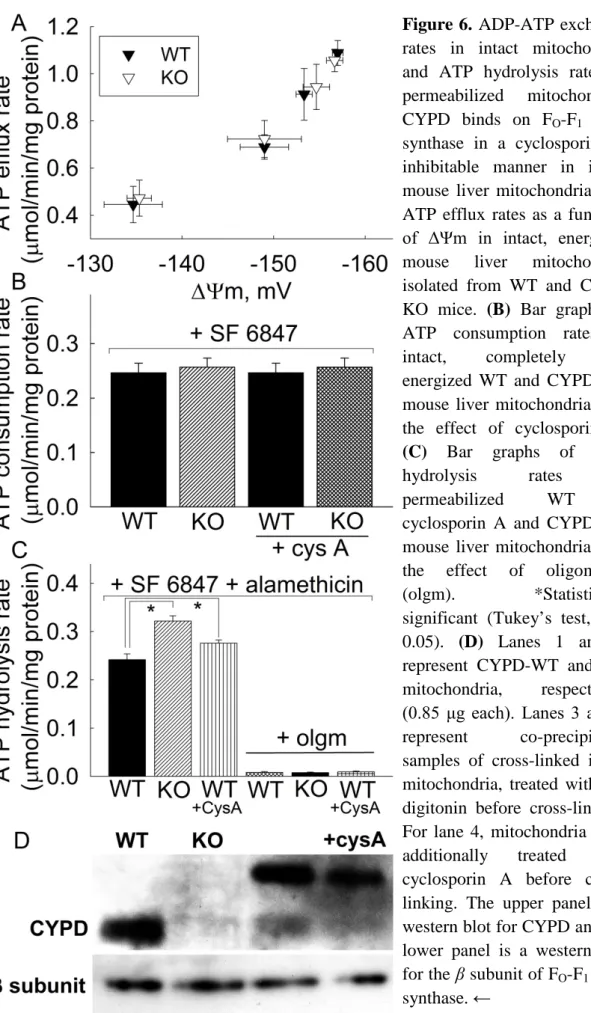
5.1 Modulation of FO-F1 ATP synthase activity by cyclophilin D regulates matrix adenine nucleotide levels... 46
5.1.1 ADP-ATP exchange rates in intact mitochondria and ATP hydrolysis rates in permeabilized mitochondria ... 46
5.1.2 Prediction of alterations in ANT-mediated ADP-ATP exchange rate caused by changing matrix ATP and ADP levels by kinetic modeling ... 49
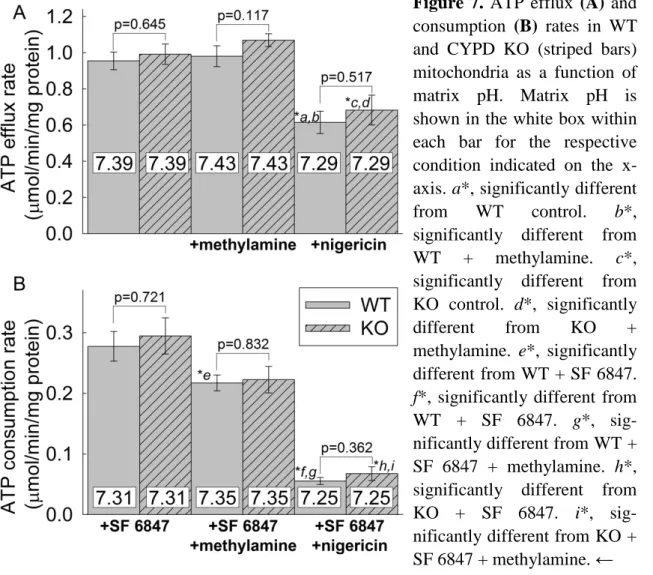
5.1.3 Effect of altering matrix pH on adenine nucleotide exchange rates ... 50
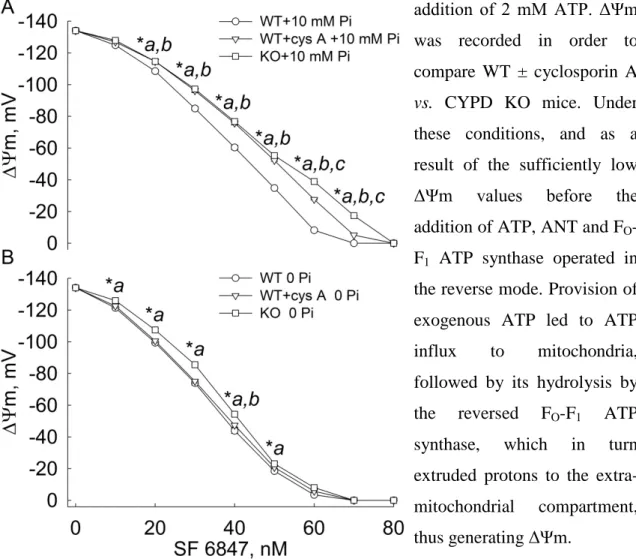
5.1.4 CYPD decreases reverse H+ pumping rate through the F1-ATPase in partially energized intact mitochondria ... 51
5.2 The negative impact of α-ketoglutarate dehydrogenase complex deficiency on matrix substrate-level phosphorylation ... 53
5.2.1 Identifying mitochondria as extramitochondrial ATP consumers ... 53
5.2.2 Categorization of substrates used for isolated mitochondria ... 55
5.2.3 Effect of cATR on ΔΨm during respiratory inhibition in isolated mitochondria from WT, DLD+/-, DLST+/- and DLD+/-/DLST+/- mice ... 57
5.2.4 ATP efflux rates in isolated mitochondria from WT, DLD+/-, DLST+/- and DLD+/-/DLST+/- mice ... 66
5.2.5 Respiration rates in isolated mitochondria from WT, DLD+/-, DLST+/- and DLD+/-/DLST+/- mice ... 68
5.2.6 Effect of BKA during respiratory inhibition of in situ synaptic and in situ neuronal somal mitochondria from WT and KGDHC-deficient mice ... 72
5.2.7 KGDHC and SUCL maximal activities in tissues from WT and KGDHC- deficient mice ... 76
5.3 Mitochondrial diaphorases as NAD+ donors to segments of the citric acid cycle that support substrate-level phosphorylation yielding ATP during respiratory arrest ... 78
5.3.1 Identifying mitochondria as extramitochondrial ATP consumers during anoxia
... 78
5.3.2 The importance of NAD+ for a maintained operation of KGDHC during anoxia or respiratory chain inhibition ... 82
5.3.3 The effect of diaphorase inhibitors on bioenergetic parameters ... 84
5.3.4 The effect of diaphorase inhibitors on ANT directionality in anoxic or rotenone-treated mitochondria ... 87
5.3.5 The effect of diaphorase substrates on ANT directionality of respiration- impaired mitochondria due to anoxia or rotenone... 88
5.3.6 The role of complex III in re-oxidizing diaphorase substrates ... 91
5.3.7 Lack of the role of diaphorase in the regeneration of NAD+ during anoxia in mitochondria from pigeon liver ... 94
5.3.8 Alternative sources for NAD+ provision in mitochondria during respiratory arrest ... 95
6. DISCUSSION ... 99
6.1 Implications of CYPD-FO-F1 ATP synthase interaction in intact mitochondria ... 99
6.2 The role of IF1 in the preservation of the cytosolic ATP pool in anoxia ... 101
6.3 KGDHC-deficiency jeopardizes adequate SUCL operation during respiratory inhibition ... 102
6.4 The oxidation of matrix NADH in view of impaired mitochondrial respiration ... 104
6.5 On which ATP pool do depolarized in situ mitochondria rely? ... 108
6.6 Closing remarks ... 109
7. CONCLUSION ... 110
8.1 SUMMARY ... 111
8.2 ÖSSZEFOGLALÁS ... 112
9. REFERENCES ... 113
10. LIST OF PUBLICATIONS... 147
11. ACKNOWLEDGEMENTS ... 149
1. ABBREVIATIONS
β-OHBDH: β-hydroxybutyrate dehydrogenase ΔΨm: transmembrane potential difference
ΔG: change in Gibbs free energy (ΔG = 0 means equilibrium) ΔG0’: change in standard Gibbs free energy
ΔGp: mitochondrial phosphorylation potential ΔpH: transmembrane proton concentration gradient 1,2/1,4-NQ: 1,2- or 1,4-naphthoquinone
AC: aconitase AcAc: acetoacetate
ADP: adenosine 5’-(trihydrogen diphosphate) a-Kg: α-ketoglutarate
ANOVA: analysis of variance
ANT: adenine nucleotide translocase
Ap5A: P1,P5-di(adenosine-5’) pentaphosphate ASAT: aspartate aminotransferase
asp: aspartate
A-SUCL: ADP-forming succinate-CoA ligase ATP: adenosine 5’-(tetrahydrogen triphosphate)
BCECF-AM: 2’,7’-bis-(2-carboxyethyl)-5-(and-6)-carboxyfluorescein, acetoxymethyl ester
BKA: bongkrekic acid bOH: β-hydroxybutyrate
BQ: p-benzoquinone
BSA: bovine serum albumin cATR: carboxyatractyloside CBQ: 2-chloro-1,4-benzoquinone
CHAPS: 3-[(3-cholamidopropyl)dimethylammonio]-1-propanesulfonate CO2: carbon dioxide
CoASH: coenzyme A
complex I: NADH-ubiquinone oxidoreductase complex II: succinate dehydrogenase
complex III: ubiquinone-cytochrome c oxidoreductase complex IV: cytochrome c oxidase
complex V: FO-F1 ATP synthase
CoQ1: coenzyme Q1 = ubiquinone 5
CoQ10: coenzyme Q10 = ubiquinone 50 = ubidecarenone CS: citrate synthase
Cyb5r2: NADH:cytochrome b5 reductase isoform 2 CYPD: cyclophilin D
CysA: cyclosporin A
DCBQ: 2,6-dichloro-1,4-benzoquinone DCIP: 2,6-dichloroindophenol
DDM: n-Dodecyl-β-D-maltopyranoside DMBQ: 2,6-dimethylbenzoquinone DNP: 2,4-dinitrophenol
DLD: dihydrolipoyl dehydrogenase DLST: dihydrolipoyl succinyltransferase DQ: duroquinone
DSP: 3,3’-dithiobis(sulfosuccinimidyl propionate) DTNB: 5,5’-dithiobis(2-nitrobenzoic acid)
EGTA: ethylene glycol-bis(2-aminoethylether)-N,N,N’,N’-tetraacetic acid Erev_ANT: reversal potential of the adenine nucleotide translocase
Erev_ATPase: reversal potential of the FO-F1 ATP synthase F: Faraday constant = 9.64 × 10⁴ C × mol-1
FCCP: carbonyl cyanide 4-(trifluoromethoxy)phenylhydrazone FerrCyan: ferricyanide = hexacyanoferrate(III), K3[Fe(CN)6] FSE: fumarase
GDH: glutamate dehydrogenase glut: glutamate
GPD2: mitochondrial glycerol-3-phosphate dehydrogenase G-SUCL: GDP-forming succinate-CoA ligase
GTP: guanosine 5’-(tetrahydrogen triphosphate)
HEPES: 2-[4-(2-hydroxyethyl)piperazin-1-yl]ethanesulfonic acid IDH: isocitrate dehydrogenase
IDH(2 or 3): isocitrate dehydrogenase, isoform 2 or 3, respectively IF1: mitochondrial ATPase inhibitory factor 1
KGDH(C): α-ketoglutarate dehydrogenase (complex) KM: affinity constant
KO: knock-out
LED: light-emitting diode
mal: malate
MBQ: methyl-p-benzoquinone MDH: malate dehydrogenase
MgG: Magnesium GreenTM, pentapotassium salt
MIRTD: mitochondrial respiration generator of truncated DLST mitoQ: mitoquinone mesylate
MnSOD: manganese superoxide dismutase n: coupling ratio (H+/ATP)
NaASO2: sodium arsenite
NAD+: nicotinamide adenine dinucleotide (oxidized form) NADH: nicotinamide adenine dinucleotide (reduced form)
NQO: NAD(P)H dehydrogenase = NAD(P)H:quinone oxidoreductase NQO(1 or 2): NAD(P)H dehydrogenase, quinone 1 or 2, respectively
OCR: oxygen consumption rate olgm: oligomycin
PAGE: polyacrylamide gel electrophoresis PC: pyruvate carboxylase
PEPCK: phosphoenolpyruvate carboxykinase PDH(C): pyruvate dehydrogenase (complex) Pi: inorganic phosphate
pmf: protonmotive force/electrochemical gradient PTP: mitochondrial permeability transition pore PVDF: polyvinylidene difluoride
pyr: pyruvate
R: universal gas constant = 8.31 J mol-1 × K-1 RCR: respiratory control ratio
ROS: reactive oxygen species rot: rotenone
SDH: succinate dehydrogenase SDS: sodium dodecyl sulfate SEM: standard error of the mean
SF 6847: 3,5-di-tert-butyl-4-hydroxybenzylidenemalononitrile
State 1: mitochondria in a Pi containing buffer without substrates and adenylates State 2: State 1 + ADP; depletion of endogenous substrates, no respiration State 2’: State 1 + substrates; low respiration and high ΔΨm due to lack of ADP State 3: State 1 + ADP + substrates; high respiration and phosphorylation State 4: all ADP has been converted to ATP; low respiration and high ΔΨm State 5: anoxia
stigm: stigmatellin
STK, SUCL: succinyl-CoA synthetase = succinate-CoA ligase = succinate thiokinase T: absolute temperature in Kelvin
TMRM: tetramethylrhodamine methyl ester TPP: tetraphenylphosphonium
UCP: uncoupling protein WT: wild-type
2. INTRODUCTION
In 1957 Philip Siekevitz termed mitochondria the “powerhouses of the cell” [1] as the most important function of these organelles is ATP provision. However they contribute to cellular homeostasis in many other ways: mitochondria modulate intracellular Ca2+ levels, generate and eliminate reactive oxygen species (ROS), serve as metabolic hubs and participate in thermoregulation. In addition, mitochondria could integrate and release signals leading to cell demise. Substantial body of evidence has accumulated over the past two decades pointing out that impaired mitochondrial function is involved in cellular deterioration associated with pathological conditions such as ischemia/reperfusion, excitotoxicity, neurodegenerative diseases or trauma (see [2] and references within). Dysfunction of these organelles is characterized by depolarization, energy deficit, impaired Ca2+ handling, oxidative stress and changes in the permeability of the inner membrane [3]. Depolarized mitochondria are thought to precipitate cell death by avidly depleting cytosolic ATP pools [2, 4, 5]. In several pathological settings, mitochondria indeed revert to ATP consumption, aggravating an existing cellular pathology [6-10]. However, for as long as the inner mitochondrial membrane remains intact and ATP production is substantiated by a segment of the citric acid cycle without eliciting the need of oxidative phosphorylation, mitochondrial consumption of cytosolic ATP is hindered by an endogenous fail safe mechanism dedicated to increase the survival chances of the cell. The aim of my thesis is to elaborate on this mechanism, focusing on its main features and the implications in aforementioned pathologies.
2.1 The mitochondrial proton circuit
In intact mitochondria as part of the proton circuit [9, 11], respiratory complexes I (NADH-ubiquinone oxidoreductase, EC 1.6.5.3), III (ubiquinone-cytochrome c oxidoreductase, EC 1.10.2.2) and IV (cytochrome c oxidase, EC 1.9.3.1) comprise the energy-conserving core of the respiratory chain residing within the inner membrane (Fig. 1). As electrons flow through, a drop in redox potential – a measure of the tendency of a chemical species to acquire electrons and thereby be reduced [12] – at each complex is coupled to the extrusion of protons across the membrane; from the matrix to the intermembrane space. Complex II (succinate dehydrogenase, EC 1.3.5.1), the mitochondrial glycerol-3-phosphate dehydrogenase (GPD2, EC 1.1.5.3) and the
electron-transferring-flavoprotein dehydrogenase of β-oxidation (EC 1.5.5.1) also contribute to the electron flow through the respiratory chain, however these enzymes energetically and mechanistically incapable of proton translocation [13]. The total redox potential difference across the entire respiratory chain is approximately 1100 mV, and the maximal protonmotive force (pmf) across the inner membrane is 180-220 mV [14].
The pmf consists of a transmembrane potential difference (ΔΨm, inside negative) and a transmembrane proton concentration gradient (ΔpH):
𝑝𝑚𝑓= ∆𝛹𝑚 − �2.3𝑅𝑇
𝐹 � ∆𝑝𝐻 (1)
where “R”, “T” and “F” refer to the universal gas constant, the absolute temperature, and the Faraday constant, respectively (for values, see Chapter 1). At the same time, in the presence of sufficiently high concentration of inorganic phosphate (Pi), as it is the case in vivo [15], ΔpH is very small (< 0.15) [16], [Vajda et al. 2009: publication not closely related to this thesis]. Therefore, under most conditions, the major component of pmf is the ΔΨm, accounting for 150-180 mV of the total gradient [9].
The outward (extrusion) and inward (re-entry) proton currents balance under steady-state conditions. The dominant pathway of proton re-entry in intact mitochondria is the FO-F1 ATP synthase (Chapter 2.3); yet uncoupling proteins (UCPs) and the endogenous proton leak as parallel channels are also in place ([17, 18] and references in Chapter 2.2). In the absence of oxidative phosphorylation, the proton circuit is mostly discharged via these channels, limiting the pmf in order to prevent electrical breakdown of the membrane as well as restrict single-electron leakage from the respiratory chain to form superoxide [19]. Ca2+-cycling, metabolite transport and proton-translocating transhydrogenase (EC 1.6.1.1) all use the proton current (Fig. 1). The proton pumps of the respiratory chain together with the FO-F1 ATP synthase and other pmf-consuming processes thus create a proton circuit across the inner membrane, which is fundamental to mitochondrial bioenergetics.
Figure 1. The mitochondrial proton circuit. The primary, ATP-generating proton pathway is depicted as bold, while the flow of electrons as dashed lines/arrows.
Metabolite transport via the phosphate carrier, the proton-translocating trans- hydrogenase reaction and endogenous/UCP-mediated proton leaks as secondary pathways of proton re-entry are shown by thin lines/arrows. Ca2+ cycles between the uniporter and the Na+/Ca2+ exchanger. The Na+ circuit integrates the proton and Ca2+
circuits. Figure modified from [14], by permission. ↓
2.2 Defining the mitochondrial respiratory steady states
In oxidative phosphorylation, the endergonic process of phosphorylating ADP to ATP is coupled to the exergonic process of electron transfer to oxygen. As explained above, coupling is achieved through outward currents generating and inward currents utilizing the pmf in the proton circuit across the inner membrane (Fig. 1). However, this coupling is not complete, as protons can return to the matrix independently of FO-F1
ATP synthase. [20-22]. Uncoupling is the induction of proton permeability in the inner mitochondrial membrane without affecting the respiratory chain and FO-F1 ATP synthase. Different means of uncoupling can be distinguished: i) intrinsic uncoupling under physiological conditions is a property of the inner membrane (endogenous proton leak) [20], proton pumps (proton slip) [21, 22], and molecular uncouplers (UCPs) [23- 26] (Chapter 2.1); ii) defective respiration under pathological and toxicological
conditions is related to mitochondrial dysfunction [14], [Kiss et al. 2013: thesis-related publication No. 3]; iii) fully uncoupled state is induced experimentally by application of established uncouplers (protonophores, such as FCCP, DNP or SF 6847) [27], with the aim of obtaining a reference state with collapsed pmf, for the evaluation of the respiratory capacity through the respiratory chain [28]. The coupling (or uncoupling) state of mitochondria is a key bioenergetic parameter; a component of the mitochondrial respiratory control [28, 29] (Fig. 2).
Respiratory steady states have been originally defined by Chance and Williams [30- 37] according to a protocol for measuring the oxygen consumption of isolated mitochondria, summarized in Table 1. The protocol starts with State 1, where mitochondria are suspended in an isosmotic experimental medium with Pi but without adenylates and respiratory substrates. It proceeds to State 2 after the addition of ADP, inducing a transient activation to effectively exhaust endogenous substrates, after which State 2 is a substrate-depleted state of residual oxygen consumption. ADP- and substrate activation is achieved in State 3 by adding respiratory substrates to the medium, e.g. in the classical protocol β-hydroxybutyrate was used. In this state, respiration is high and ADP is gradually depleted by conversion to ATP. Respiration drops in the transition to State 4, which is an ADP-limited resting state. Finally, respiration becomes oxygen- limited after the aerobic-anoxic transition in the closed chamber (State 5).
Table 1. Original definition of respiratory steady states by Chance and Williams [33]. ↓ State [O2] ADP level Substrate
level
Respiration
rate Rate-limiting substance
1 > 0 Low Low Slow ADP
2 > 0 High ~0 Slow Respiratory substrates 3 > 0 High High Fast Respiratory chain
4 > 0 Low High Slow ADP
5 < 0 Low High 0 Oxygen
Table 2. Definition of mitochondrial respiratory states in Bioenergetics 3 textbook.
“Chance and Williams proposed a convention following the typical order of addition of agents during an experiment:” (Nicholls and Ferguson) [11]. ↓
State 1 mitochondria alone (in the presence of Pi)
State 2 substrate added, respiration low due to lack of ADP
State 3 a limited amount of ADP added, allowing rapid respiration State 4 all ADP converted to ATP, respiration slows
State 5 anoxia
In an alternative, conventional protocol introduced by Estabrook [38], the sequence starts with the above defined State 1 (mitochondrial suspension in a Pi containing buffer without adenylates and respiratory substrates), but continues with the addition of respiratory substrates to reach State 2’. Since adenylates are absent, in this state respiration merely compensates for the proton leaks. Addition of ADP initiates State 3.
Without further addition of reactants, State 4 is attained upon exhaustion of ADP. States 3 and 4 here are identical to the ones defined by Chance and Williams [30-37].
The original definition of State 2 [30-37] (Table 1) is opposite to the State 2’
obtained in the absence of ADP but presence of respiratory substrates (Table 2), because they are functionally different states of residual oxygen consumption and compensatory respiration, respectively. “We have sought independent controls on whether State 2 corresponds to complete oxidation of the system. It is logical that this be so, for respiration is zero in State 2 because substrate, not phosphate acceptor, is limiting.”
(Chance and Williams) [33]. On the contrary, State 2’ and 4 represent ADP-limited steady states with well-defined oxygen consumption by the respiratory chain to compensate for the proton leaks, in the absence or presence of ATP, respectively.
Despite the clear definitions elaborated above, State 2, 2’ and 4 terminologies have become confusing even among the scientists of the field: “Also, the controlled respiration prior to addition of ADP, which is strictly termed “state 2”, is functionally the same as state 4, and the latter term is usually used for both states.” (Nicholls and Ferguson) [11] (see also Table 2). Since “Bioenergetics” is one of the most fundamental textbooks of mitochondriology, misinterpretation of the terminology became widespread, giving rise to an endless debate among mitochondria-related scientists.
Certainly, this state of terminology urges reconsideration for clarification, particularly for extending bioenergetics to the oxygen consumption kinetics of the living cell [28, 39].
The respiratory control ratio (RCR) is defined as State 3 / State 4. Ever since it has been established by Chance and Williams [40], it is widely used as a measure to describe the degree of coupling, respiratory control and intactness of the mitochondrial preparation.
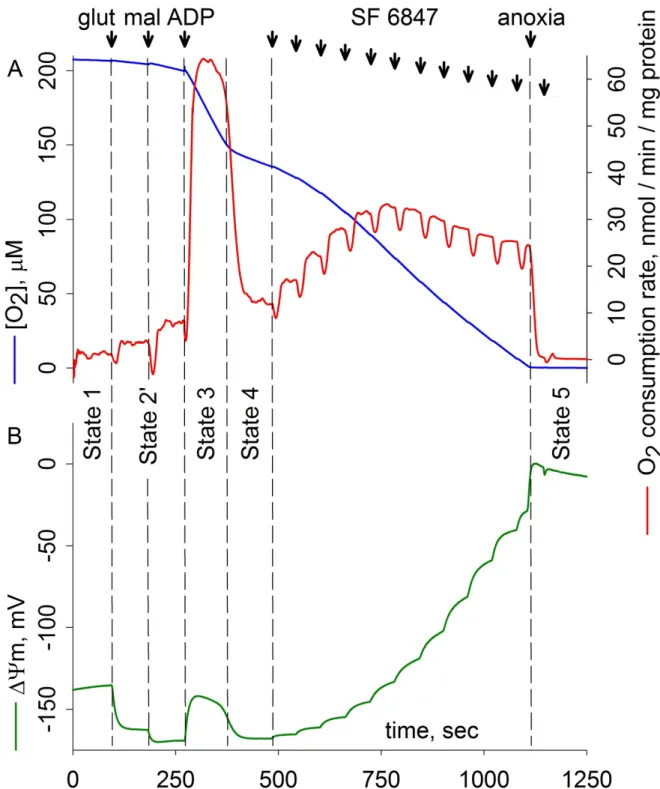
Figure 2. Parallel measurements of oxygen consumption (A) and membrane potential (ΔΨm) (B) of isolated mouse liver mitochondria. The experiment was performed in an OROBOROS Oxygraph-2k equipped with the O2k-Fluorescence LED2-Module to monitor ΔΨm with the cationic dye safranin O (2.5 μM); at 37°C. 1 mg mitochondria were suspended in 4 ml incubation medium (0.25 mg/ml; the composition is given in Chapter 4.5) before the closure of the chamber. Oxygen concentration, flux (negative time derivative of oxygen concentration) and fluorescence were recorded using DatLab software provided by Oroboros Instruments GmbH. Additions: glutamate (glut), 5 mM;
malate (mal), 5 mM; ADP, 0.25 mM; SF 6847, 10 nM steps (12) where indicated. ΔΨm was calculated from safranin O fluorescence signal as it is described in Chapter 4.5. ↑
The rate of respiration is mostly controlled by the thermodynamic disequilibrium between the redox potential difference across the respiratory chain and ΔΨm. In the absence of ATP synthesis, respiration is regulated so that the rate of proton extrusion balances the rate of proton leak across the inner mitochondrial membrane. If proton extrusion exceeds the rate of re-entry, ΔΨm increases, resulting in an increase in the disequilibrium between the respiratory chain and ΔΨm. The outcome is the decrease of respiratory chain activity and restoration of the steady state. In Fig. 2, respiration is initiated by respiratory substrates glutamate plus malate (State 2’), and then disturbed by the addition of ADP (State 3). The added ADP exchanges with matrix ATP via the adenine nucleotide translocase (ANT), and as a result, the phosphorylation potential (ΔGp) [29, 41] for the ATP synthesis reaction in the matrix is lowered, disturbing the FO-F1 ATP synthase equilibrium:
∆𝐺𝑝 =∆𝐺0′+ 1.36 log [𝐴𝑇𝑃]
[𝐴𝐷𝑃][𝑃𝑖] (2)
where ΔG0’ is the standard free energy of ATP hydrolysis at a given pH, and [ATP], [ADP] and [Pi] refer to concentrations in the medium. The FO-F1 ATP synthase starts operating in the direction of ATP synthesis at the expense of proton re-entry to the matrix in order to restore ΔGp. The proton re-entry decreases ΔΨm, thus the thermodynamic disequilibrium between the respiratory chain and ΔΨm increases.
Adherent increase of proton current and respiration restores the balance. This accelerated State 3 respiration is self-regulating in a way that the rate of proton extrusion matches the increased rate of proton re-entry. Since under these circumstances ΔΨm is dissipated by both the FO-F1 ATP synthase and ANT (see Chapters 2.3, 2.4 and 2.8), it is set in a new steady state lower than that of State 2’; its actual value depending on the respiratory substrates provided [42]. As it is visible in Fig. 2, energy transduction is well regulated: ΔΨm drops by less than 20% upon ADP addition. ATP synthesis, and hence State 3 respiration can be terminated in the following ways: i) when all the added ADP is phosphorylated to ATP, respiration slows down as it becomes ADP-limited (State 3 - State 4 transition in Fig. 2A and 18); ii) by blocking ANT-mediated ADP- ATP exchange with its specific inhibitor carboxyatractyloside (cATR) or bongkrekic acid (BKA) (see Fig. 18 and 26F); iii) by inhibiting the FO-F1 ATP synthase e.g. with oligomycin (olgm).
Uncoupling agents like SF 6847 uncouple oxidative phosphorylation by increasing the proton permeability of the inner membrane. Therefore, they override the inhibition of proton re-entry, creating a futile cycle wherein protons are extruded by the respiratory chain but shuttled back right away into the matrix; impeding the ΔΨm to build up. As a consequence, uncouplers induce rapid respiration (regardless of the presence of FO-F1 ATP synthase and ANT inhibitors, or the absence of ADP) but hinder ATP synthesis. Uncoupling agents thus can be used to i) create a zero reference point for ΔΨm calibration (Chapter 5.2.1), ii) establish open-circuit operation of the proton circuit in order to evaluate the maximal flux through the respiratory chain [28], iii) set the ΔΨm to any preferred value with careful titration (Chapter 5.1).
2.3 The FO-F1 ATP synthase
The FO-F1 ATP synthase (EC 3.6.3.14) consists of two coupled rotary molecular motors, called FO and F1 (or F1-ATPase); the former being membrane-bound and the latter solvent exposed. When F1 is coupled to FO embedded in a membrane across which there is sufficient pmf, the complex generates ATP from ADP and Pi. The energy- requiring step is not the chemical step in ATP synthesis, but the binding of Pi and the release of tightly bound ATP from FO-F1 ATP synthase [43]. It seems as though mitochondria are built around this molecular rotary engine to keep it operating in the direction of ATP synthesis by providing the necessary pmf. Nevertheless, if respiration or the integrity of the inner membrane becomes compromised and pmf dissipates, the FO-F1 ATP synthase switches to reverse mode generating a suboptimal ΔΨm at the expense of ATP hydrolysis by pumping protons out of the matrix [44].
Regulatory mechanisms of FO-F1 ATP synthase activity can be divided upon whether they are affecting ATP synthesis or ATP hydrolysis rates, or both. ATP synthesis activity by the FO-F1 ATP synthase can be modulated by changing the magnitude of pmf. This can be achieved by either modulating the complexes of the respiratory chain [45] or the components of the citric acid cycle that provide reducing equivalents to the complexes [46], or by changing the proton permeability of the inner membrane. Coupling factor B is a protein located in the inner mitochondrial membrane that facilitates ATP synthesis by blocking a proton leak [47]. Recently, mitochondrial ATPase inhibitory factor 1 (IF1) – discovered in 1963 by Pullman and Monroy [48] – has also been implicated in modulating ATP synthesis activity by a mechanism that
involves arrangement of FO-F1 ATP synthase in dimer formation, creating more efficient conditions for ATP synthesis by local biophysical factors [49-51]. Regarding the hydrolytic activity of the F1-ATPase, four mechanisms are in place aiming at blocking it upon decrease in pmf, mediated by i) a decrease in matrix ATP concentration, ii) a decrease in ATP/ADP ratio, iii) an increase in matrix Pi, and iv) the endogenous factor IF1 [44, 48]. The first two mechanisms converge on the inhibition of the F1-ATPase by MgADP, reviewed in [44], however, it is not established if this regulation is operational on fully assembled FO-F1 ATP synthase within intact mitochondria. The most important regulatory mechanism is sustained by IF1, a protein that is expressed in some tissues of some organisms exhibiting the ability to block the ATP hydrolytic activity of F1-ATPase [52-54]; however, it must be stressed that IF1 does not operate in an all-or-none manner: the binding and release of this protein in F1- ATPase are governed by both matrix [ATP] and ΔΨm, independently from each other [55-57], apart from the effect of matrix pH [58]. Furthermore, inhibition of F1-ATPase by IF1 may not be complete; matrix ATP inhibits the unbinding of IF1 from F1-ATPase with a Ki of 0.14 mM [56]. According to Giorgio et al. [59, 60], cyclophilin D (CYPD, EC 5.2.1.8), a ubiquitous matrix-located protein binds to the oligomycin sensitivity- conferring protein subunit of the FO-F1 ATP synthase in a phosphate-dependent manner, resulting in a decrease in both ATP synthesis and hydrolysis rates. CYPD is a member of the cyclophilins family encoded by the PPIF gene [61], which exhibits peptidyl- prolyl cis/trans isomerase activity. Genetic ablation of the PPIF gene or inhibition of CYPD binding on FO-F1 ATP synthase by cyclosporin A led to disinhibition, resulting in accelerated ATP synthesis and hydrolysis rates. These effects however were demonstrated in either submitochondrial particles or mitochondria permeabilized by alamethicin, representing conditions under which there is direct access to the FO-F1 ATP synthase. As discussed in Chinopoulos et al. 2011 (thesis-related publication No. 2), in intact mitochondria, changes in ATP synthesis or hydrolysis rates by the FO-F1 ATP synthase do not necessarily translate to changes in ATP efflux or influx rates as a result of the presence of the ANT (further explained in Chapters 2.4 and 5.1.2). The molecular turnover numbers and the number of active ANT molecules may vary from those of FO-F1 ATP synthase molecules per mitochondrion [2, 42]. Furthermore, the steady-state ADP-ATP exchange rates (for ANT) or ADP-ATP conversion rates (for
FO-F1 ATP synthase) do not change in parallel as a function of the ΔΨm [62], [Chinopoulos et al. 2010: thesis-related publication No. 1]. It is therefore reasonable to assume that a change in matrix ADP-ATP conversion rate caused by a change in FO-F1
ATP synthase activity may not result in an altered rate of ADP influx (or ATP influx, in the case of sufficiently de-energized mitochondria) from the extramitochondrial compartment because of the imposing action of the ANT. Addressing the extent of contribution of CYPD on the rates of ADP and ATP fluxes towards the extramitochondrial compartment is one of the objectives of my thesis (Chapter 5.1).
Persistent reversal of FO-F1 ATP synthase could deplete the cellular ATP reserves, driving the cell into an energy deficit eventually leading to cell death [9]. Under these conditions, glycolysis can provide the ATP required to maintain ATP-dependent cellular functions and the reverse operation of FO-F1 ATP synthase; preventing total collapse of ΔΨm and counteracting the consumption of cytosolic ATP pools. Glycolytic ATP production indeed can be accelerated 10-fold when oxidative phosphorylation is abolished and as a result, ATP/ADP ratio decreases by ~70% but not collapses [63].
Survival of cells with impaired respiratory chain thus likely depends on the glycolytic capacity. However – on the basis of findings submitted in this thesis – a novel concept arises: matrix substrate-level phosphorylation could be a mean to preserve the cytosolic ATP reserves produced by glycolysis, which is crucial for survival due to maintaining the operations of vital ATP-dependent transporter such as Na+/K+- and Ca2+-ATPases.
Since ATP hydrolysis by the FO-F1 ATP synthase takes place on the matrix side, in case of an uncompromised inner membrane the directionality of the ANT will define weather cytosolic or matrical ATP pools will drive the reverse operating FO-F1 ATP synthase if the respiratory chain becomes defective.
2.4 The adenine nucleotide translocase
The adenine nucleotide translocase (ANT) is the most abundant member of the mitochondrial carrier family: it represents up to 10% of all proteins from the inner membrane of heart mitochondria [64, 65]. There are four known isoforms in humans [66, 67], all encoded by nuclear DNA [64, 68]. ANT assembles in multimeric translocating units [69] and catalyzes the electrogenic, reversible exchange of ADP3- for ATP4- with a 1:1 stoichiometry across the inner membrane [70]. Accordingly, the forward operation of the translocase (ATP export from the mitochondrial matrix in
exchange for extramitochondrial ADP) dissipates, while the reverse operation (ADP export from the mitochondrial matrix in exchange for extramitochondrial ATP) actually generates ΔΨm. The directionality of the ADP-ATP transport through the ANT is determined mostly by the magnitude of the ΔΨm; but influenced by many other parameters elaborated in [62]. In addition, ANT has other roles as well in both physiological and pathological conditions: it is i) thought to be a major conduit of the
“proton leak” [71], ii) a regulatory component of the mitochondrial permeability transition pore (PTP) [72, 73], iii) involved in mitochondria-mediated apoptosis [74].
In case of a respiratory chain failure, assuming that i) the inner mitochondrial membrane remains intact, ii) glycolytic ATP production is unhindered and upregulated due to Pasteur effect1 and iii) substrates are available to support matrix substrate-level phosphorylation, ATP supply for hydrolyzing FO-F1 ATP synthase could originate from either side of the inner membrane. Under these settings, the ANT will determine whether cytosolic or matrical ATP pools will be consumed, governed mainly by ΔΨm.
2.5 Directional asynchrony in the operation of FO-F1 ATP synthase and ANT Directionality of the reversible FO-F1 ATP synthase is mostly controlled by ΔΨm and its so called “reversal potential” set by the concentrations of the participating reactants. Reversal potential of an enzyme transporting across a membrane may be defined as the ΔΨm, where no net flux of substrates can be detected. In case of FO-F1 ATP synthase, its “reversal potential” (Erev_ATPase) gives the value of ΔΨm at which the complex shifts from an ATP-forming to an ATP-consuming entity. The values of Erev_ATPase are given by the following equation [Chinopoulos et al. 2010]:
𝐸𝑟𝑒𝑣𝐴𝑇𝑃𝑎𝑠𝑒 = − �316 𝑛 � − �
2.3𝑅𝑇
𝐹𝑛 �× log� [𝑀𝑔𝐴𝑇𝑃2−]𝑖𝑛 [𝑀𝑔𝐴𝐷𝑃−]𝑖𝑛× [𝑃𝑖]𝑖𝑛�
−2.3𝑅𝑇
𝐹 × (𝑝𝐻𝑜𝑢𝑡− 𝑝𝐻𝑖𝑛) and
(3)
[𝑃𝑖]𝑖𝑛 = �𝑃𝑖𝑡𝑜𝑡𝑎𝑙�𝑖𝑛
(1 + 10𝑝𝐻𝑖𝑛−𝑝𝐾𝑎2) (4)
1 During his studies on the fermentation of glucose by yeast, Louis Pasteur discovered that both the rate and the total amount of glucose consumption were many times greater under anaerobic than aerobic conditions.
where “in” and “out” signify inside and outside the mitochondrial matrix, respectively,
“n” is the H+/ATP coupling ratio [75] and “R”, “T” and “F” are the universal gas constant, the absolute temperature, and the Faraday constant, respectively (for values, see Chapter 1). KM(ADP) and KM(ATP) are the true affinity constants of Mg2+ for ADP and ATP valued 10-3.198 and 10-4.06, respectively, according to [76], and [Pi] is the free phosphate concentration (in Molar) given by Eq. (4), where pKa2 = 7.2 for phosphoric acid. The FO-F1 ATP synthase utilizes the Mg2+-bound forms, MgATP2- and MgADP- [76]. However, MgATP2- can be expressed as [ATP4-]free × [Mg2+]/KM(ATP), and MgADP- can be expressed as [ADP3-]free × [Mg2+]/KM(ADP). By incorporating these to Eq. (3), we obtain:
𝐸𝑟𝑒𝑣𝐴𝑇𝑃𝑎𝑠𝑒 =− �316 𝑛 � − �
2.3𝑅𝑇 𝐹𝑛 �
× log� [𝐴𝑇𝑃4−]𝑓𝑟𝑒𝑒𝑖𝑛 ×𝐾𝑀(𝐴𝐷𝑃)
[𝐴𝐷𝑃3−]𝑓𝑟𝑒𝑒𝑖𝑛×𝐾𝑀(𝐴𝑇𝑃)× [𝑃𝑖]𝑖𝑛�
−2.3𝑅𝑇
𝐹 × (𝑝𝐻𝑜𝑢𝑡− 𝑝𝐻𝑖𝑛)
(5)
Since nucleotide phosphorylation/dephosphorylation takes place on the matrix side of the FO-F1 ATP synthase, obviously only ADP and ATP present in the matrix participate in the production/consumption process. Extramitochondrial adenine nucleotides can contribute to the matrical adenine nucleotide pools only through the ANT. Therefore, if the FO-F1 ATP synthase hydrolyzes ATP originating not from matrix substrate-level phosphorylation [77, 78], but from cytosolic ATP reserves [2], it must be preceded by ANT reversal [Chinopoulos et al. 2010]. By a minor fraction, the ATP-Mg/Pi carrier could also transport extramitochondrial ATP into the matrix [79]. The ANT utilizes the free forms of ADP3- and ATP4-, and exhibits its own reversal potential (Erev_ANT), which is in turn governed by the participating reactants [62]:
𝐸𝑟𝑒𝑣_𝐴𝑁𝑇 =2.3𝑅𝑇
𝐹 ×𝑙𝑜𝑔 �[𝐴𝐷𝑃3−]𝑓𝑟𝑒𝑒𝑜𝑢𝑡× [𝐴𝑇𝑃4−]𝑓𝑟𝑒𝑒𝑖𝑛
[𝐴𝐷𝑃3−]𝑓𝑟𝑒𝑒𝑖𝑛× [𝐴𝑇𝑃4−]𝑓𝑟𝑒𝑒𝑜𝑢𝑡� (6) Eqs. (5) and (6) share the common reactants [ATP4-]freein and [ADP3-]freein (gray rectangles), therefore, the reversal potential of the FO-F1 ATP synthase and that of ANT can both be expressed as functions of matrix free ATP4- and ADP3-, see Fig. 3 from Chinopoulos et al. 2010 and Kiss et al. 2013 (thesis-related publications No. 1 and 3).
According to Fig. 3, alterations in [ATP4-]freein and [ADP3-]freein affect Erev_ATPase and Erev_ANT inversely; a decrease in [ATP4-]freein/[ADP3-]freein ratio would shift Erev_ATPase
toward more positive and Erev_ANT toward more negative values and vice versa. The realization that Erev_ATPase and Erev_ANT are inversely affected by [ATP4-]freein and [ADP3-]freein could also be derived intuitively: a forward-operating FO-F1 ATP synthase elevates matrix [ATP], which will favor its own reversal but also compel ANT to convey the generated ATP to the cytosol. Likewise, reversed FO-F1 ATP synthase will reduce [ATP], elevating [ADP] in the meantime, which will disfavor ATP hydrolysis but urge ANT to expel accumulated matrix ADP by operating in reverse mode [80].
The [ATP4-]freein/ [ADP3-]freein ratio is a dynamically altering variable, following the actual metabolic demand of the cell. However – as it is suggested in Chapter 2.9 –, real-time quantification of this valuable parameter is very difficult. The rest of the parameters also exhibit wide fluctuations: phosphate [81], the coupling ratio “n” [82, 83] and ΔΨm; “flickering” of the latter could be greater than 100 mV [84-86].
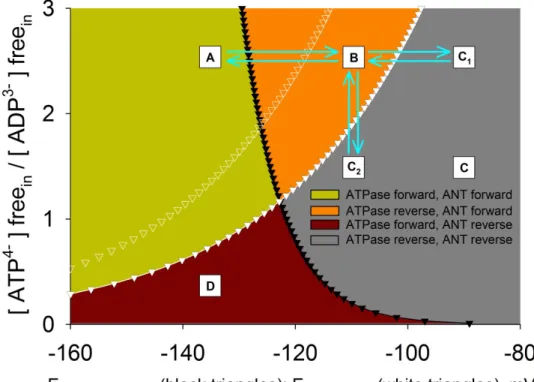
Figure 3. Computational estimation of Erev_ANT and Erev_ATPase. A: ATPase forward, ANT forward; B: ATP reverse, ANT forward; C, C1, C2: ATPase reverse, ANT reverse;
D: ATPase forward, ANT reverse. Black solid triangles represent Erev_ATPase; white solid triangles represent Erev_ANT. Values were computed for [ATP4-]freeout=1.2 mM, [ADP3- ]freeout=10 μM, [Pi]in=0.01 M, n=3.7 (2.7+1 for the electrogenic ATP4-/ADP3- exchange of the ANT), pHin=7.38, and pHout=7.25. White open triangles represent Erev_ANT values computed for [ATP4-]freeout=2.2 mM, and all other parameters as above. ↓
2.6 Computational estimations of Erev_ATPase and Erev_ANT
The concentration of free ATP4- ([L]) can be calculated by the following equation:
[𝐿] =⎩⎨
⎧ [𝐿]𝑡 1 +[𝑀𝑔2+]𝑓𝑟𝑒𝑒
𝑘𝑀,𝑎𝑝𝑝 ⎭⎬
⎫
�1 + 10𝑘−𝑝𝐻𝐻 �
(7)
where [L]t is the total ATP concentration, i.e., [ATP4-] + [ATP-H3-] + [ATP-Mg2-] + [ATP-H-Mg-]; “kH” is the dissociation constant for the reaction ATP-H3- ↔ ATP4- + H+; and “kM,app” is the apparent dissociation constant of MgATP2- measured at pH 7.25 and 37°C [42]. By the same token, [ADP3-]free can be calculated using Eq. (7): [L], [ADP3-]free; [L]t total ADP concentration, i.e., [ADP3-] + [ADP-H2-] + [ADP-Mg-] + [ADP-H-Mg]; kH is the dissociation constant for the reaction ADP-H2- ↔ ADP3- + H+; and kM,app is the apparent dissociation constant of MgADP- measured at pH 7.25 and 37°C [42]. Since kH and kM,app values for matrical conditions are difficult to determine, it is assumed that they do not differ notably from those found outside the matrix.
Because the matrix [Mg2+] and pHin are only slightly different from the extramitochondrial [Mg2+] and pHout [42], it is assumed that both ANT and FO-F1 ATP synthase handle the measured free [ATP] and [ADP]. Results of the computations using Eqs. (3-7) are depicted in Fig. 3: Erev_ATPase (black triangles) and Erev_ANT (white triangles) are plotted as functions of matrix ATP/ADP ratio. The two curves define four spaces: A, B, C, and D. Mitochondria exhibiting a free matrix ATP/ADP ratio for a given ΔΨm that would place them anywhere within the A space (green space) have their FO-F1 ATP synthase and ANT operating in forward mode; i.e., FO-F1 ATP synthase combines ADP and Pi to generate ATP and ANT brings that ATP into the extramitochondrial compartment in exchange for ADP. Mitochondria exhibiting values that would place them anywhere within the C space (gray space) have both their ANT and FO-F1 ATP synthase operate in reverse mode; i.e., ANT brings ATP into the matrix in exchange for ADP, and FO-F1 ATP synthase hydrolyzes that ATP to ADP and Pi. Mitochondria exhibiting values that would place them anywhere within the B space (orange space) have the FO-F1 ATP synthase of these organelles operating in reverse mode, whereas the ANT still operates in forward mode. Under these circumstances, mitochondria could i) either return to the A space or ii) proceed to the C space and gain
access to extramitochondrial ATP pools by one or more of the following 3 routes:
further change in ΔΨm toward more depolarizing values, so that they would reach point C1; further decrease in the matrix ATP/ADP ratio, so that they would reach point C2; or shift of Erev_ANT to the left (Fig. 3, white open triangles; i.e., by increasing [ATP4-]freeout
or decreasing [ADP3-]freeout or decreasing pHo), so that the existing ΔΨm and matrix ATP/ADP ratio pair values now fall within the C space. From Eq. (6), it is evident that because Erev_ANT encompasses the terms [ATP4-]freein and [ADP3-]freein, a change in matrix ATP/ADP ratio is bound to affect Erev_ANT as well. In other words, a change in matrix ATP/ADP ratio may not be the only reason for a mitochondrion becoming extramitochondrial ATP consumer; the accompanying shift in Erev_ANT will also contribute. It is unlikely for mitochondria to exhibit such a high ΔΨm but so low ATP/ADP ratio in vivo that would place them within the D space (red space), and therefore this part of the graph has presumably no biological representation. For the estimations, other parameters were assumed to be static, specifically those of [ATP4-]freeout, [ADP3-]freeout, [Pi]in, n, pHin and pHout. Some of these values have been chosen on the basis of reports on cytosolic estimations or computational predictions [87]. A Windows-based software has been generated by our group (Erev estimator), in which the user can enter any value for any parameter participating in Eqs. (4-6), and observe the changes in Erev_ATPase and Erev_ANT. The software and instructions on how to use it can be downloaded (http://www.tinyurl.com/Erev-estimator). These computer simulations have been verified by experimental results in isolated and in situ mitochondria, showing that Erev_ATPase is almost always more negative than Erev_ANT, implying that progressively depolarizing mitochondria will first exhibit reversal of the FO-F1 ATP synthase, followed by reversal of the ANT [Chinopoulos et al. 2010], thereby proving the existence of the B space.
It is worth mentioning here that from Fig. 3 only the directionalities but not the activities of the ANT and the FO-F1ATP synthase can be deduced. As ΔΨm approaches Erev_ATPase or Erev_ANT values, respective activities decrease indeed; still, the characteristics of ΔΨm-dependent activity changes require further clarification. The ADP-ATP exchange rate of intact mitochondria as a function of several physiological parameters including ΔΨm however, has been described [42], [Chinopoulos et al. 2010]
and modeled already [62], as well as FO-F1 ATP synthase activity [88, 89]. Fig. 4
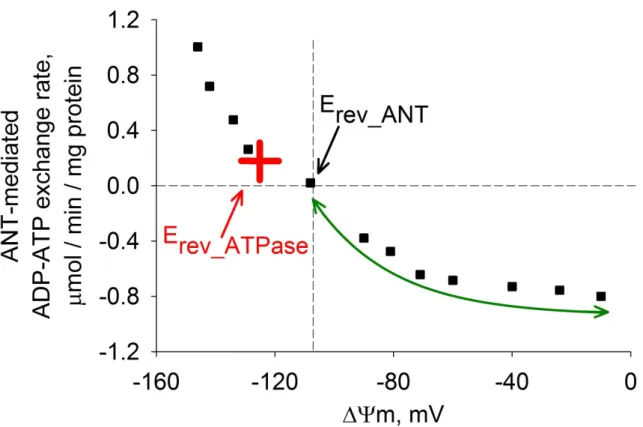
presents a typical ADP-ATP exchange rate profile of intact mitochondria as a function of ΔΨm: black squares are experimental data points obtained from parallel ADP-ATP exchange rate and ΔΨm measurements in isolated mitochondria titrated with an uncoupler [90]. The same experimental protocol performed on in situ mitochondria in permeabilized cells provided similar results [91]. Although predictions of thermodynamic vs. kinetic analyses cannot be used interchangeably, the ΔΨm values at which the FO-F1 ATP synthase and ANT yield a net rate of zero deduced by i) thermodynamic (at ΔG = 0) and ii) kinetic analysis [62], are identical [62, 88, 92], [Chinopoulos et al. 2010]. Along these lines, when ΔΨm matches or approximate Erev_ATPase or Erev_ANT values according to thermodynamic analysis, it can be assumed that respective ANT and FO-F1 ATP synthase activities are also minute.
Figure 4. Plot of the ADP-ATP exchange rate mediated by the ANT vs. ΔΨm in isolated rat liver mitochondria depolarized to various voltages by increasing amounts of an uncoupler. Black cross indicates Erev_ANT, red cross indicates Erev_ATPase. ↑
2.7 Contribution of matrix substrate-level phosphorylation
The FO-F1 ATP synthase is the major player in controlling matrix ATP and ADP levels, but it is itself controlled by ΔΨm [44], the variable that defines the x-axis of the graph in Fig. 3. However, ATP can also be generated by substrate-level phosphorylation, a pathway that is independent from pmf. In the mitochondrial matrix there are two reactions capable of substrate-level phosphorylation: the mitochondrial phosphoenolpyruvate carboxykinase (PEPCK, EC 4.1.1.32) and the succinate-CoA ligase (SUCL, or succinate thiokinase or succinyl-CoA synthetase). Mitochondrial PEPCK is thought to participate in the transfer of the phosphorylation potential from the matrix to cytosol and vice versa [93-96]. SUCL catalyzes the reversible conversion of succinyl-CoA and ADP or GDP to CoASH, succinate and ATP or GTP [97]. ΔG for this reaction is 0.07 kJ/mol, therefore, it is reversible [98]. It plays a key role in the citric acid cycle [99], ketone metabolism [100], and heme synthesis [101] as well as being a phosphate target for the activation of mitochondrial metabolism [102]. The enzyme is a heterodimer, being composed of an invariant α subunit encoded by the SUCLG1 gene and a substrate-specific β subunit encoded by either the SUCLA2 or SUCLG2 gene. This dimer combination results in either an ADP-forming succinate- CoA ligase (A-SUCL; EC 6.2.1.5) or a GDP-forming succinate-CoA ligase (G-SUCL;
EC 6.2.1.4). A-SUCL is mostly expressed in skeletal muscle, brain and heart, while G- SUCL is barely detected in brain and muscle, but strongly expressed in liver and kidney [96]. In the human brain, A-SUCL is expressed exclusively in the neurons [103]. The ADP-forming succinate-CoA ligase is potentially the only matrix enzyme generating ATP in the absence of pmf, capable of maintaining matrix ATP levels under energy- limited conditions, such as transient hypoxia [104-106]. However, GDP-forming succinate-CoA ligase may also support ATP formation in the matrix through the concerted action with a mitochondrial isoform of a nucleotide diphosphate kinase known as NM23-H4 (NDPK-D, EC 2.7.4.6); this kinase complexates with either ADP- or GDP-forming succinate-CoA ligase [107, 108].
How would ADP-forming succinate-CoA ligase mediated increase in matrix [ATP]
affect the reversal potentials of FO-F1 ATP synthase and that of ANT? As it is apparent from Fig. 3, an increase in matrix ATP/ADP ratio increases Erev_ATPase and decreases Erev_ANT. Along these lines, an increase in matrix ATP/ADP ratio carries a particularly
beneficial effect: assuming that a mitochondrion in a cell exhibits a ΔΨm of -100 mV, a matrix [ATP] = 4 mM, and a matrix [ADP] = 2 mM, that would make an ATP/ADP ratio of 2. Assuming that all other parameters are as for Fig. 3, this mitochondrion would reside in the C space; i.e., it would consume cytosolic ATP, because both the ANT and the FO-F1 ATP synthase operate in reverse mode. In this case, an increase in substrate-level phosphorylation by 25% (arbitrarily chosen) will elevate matrix ATP/ADP ratio to 3.3, and that will “relocate” this mitochondrion to the B space. This mitochondrion will still consume ATP because of a reversed FO-F1 ATP synthase, but this ATP cannot come from the cytosolic compartment, because the ANT operates in forward mode. In this case, the FO-F1 ATP synthase consumes the ATP that comes from substrate-level phosphorylation, sparing the cytosolic reserves.
From the work described in this thesis, which integrates the findings of all the thesis-related publications as well as earlier reports by the groups of Sanadi [109], Lambeth [97], Weinberg [105], Chinnery [110] and Balaban [102], the concept is being established that matrix substrate-level phosphorylation could be a mitochondrial endogenous fail safe mechanism supporting the reverse operation of FO-F1 ATP synthase, with the benefit of maintaining ΔΨm at a suboptimal level, when mitochondria are depolarized but not sufficiently for the ANT to reverse. This assists in preserving glycolytic ATP pools that could otherwise be suppressed during prolonged ischemia [111] but are evidently crucial for the survival chances of cells because of maintaining the function of vital ATP-dependent mechanisms, such as Na+/K+-ATPase and Ca2+-ATPases. The importance of SUCL can be better appreciated by the severe phenotype observed in patients suffering from SUCLA2 (or SUCLG1) deficiencies [112]. Mutations in the SUCLG2 gene have never been reported, as they are most probably incompatible with life. However, it would be difficult to attribute the phenotype exclusively to the provision of ATP by SUCL vs. other very important metabolic branches, such as the maintenance of the citric acid cycle [99], ketone metabolism [100], or heme synthesis [101]. It is also noteworthy that recent experiments by the group of Balaban [102] showed that SUCL is activated by matrix Pi. Support for a Pi-induced activation of SUCL is also lent by the study of Siess and colleagues [113], who determined the effects of Pi on matrix metabolite concentrations. In that study, Pi
was found to increase [malate] but to decrease [α-ketoglutarate] and [succinyl-CoA],
implying activation of SUCL. By the same token, during cardiac ischemia, succinate is known to accumulate [104, 114], a phenomenon that is consistent with an increase in SUCL activity, possibly as a result of activation by Pi. Activation of SUCL toward the formation of ATP and succinate would obviously have the implication of providing ATP for the consuming FO-F1ATP synthase, thereby maintaining a moderate ΔΨm that, if more negative than Erev_ANT, could contribute to sparing cytosolic ATP pools. A beneficial byproduct is the provision of matrix Pi from matrix ATP hydrolysis that could activate SUCL toward extra ATP formation. Finally, as the elevation of matrix [Pi] shifts Erev_ATPase toward more depolarizing ΔΨm values [80], an additional benefit would be the priming of mitochondria to reverse ATP hydrolysis at more positive potentials, thereby rendering them less prone to matrix ATP consumption.
Considering Eqs. (3-7) and the computer simulations in Chinopoulos et al. 2010 showing that the FO-F1 ATP synthase reverses at more negative potentials than the ANT, Erev_ATPase must be positioned in the proximity of the red cross in Fig. 4. This means if ΔΨm discharges to a value less negative than Erev_ATPase, FO-F1 ATP synthase will inevitably switch to reverse mode. The questions arise here though: how is it possible for respiration-impaired but still intact mitochondria generating membrane potential by a reverse-operating FO-F1 ATP synthase to hinder further cytosolic ATP import and consumption? What are the impediments of the transition from the B to the C space in Fig. 3?
2.8 Barriers preventing mitochondrial consumption of cytosolic ATP
The first barrier emerges when depolarization of the inner membrane reaches the potential of the Erev_ATPase, prompting reversal of FO-F1 ATP synthase. The reversal itself counters further depolarization since it implies ΔΨm generation by pumping protons out of the matrix at the expense of ATP hydrolysis. However, if the initial depolarization is robust enough to overcome the repolarization due to reversed-operating FO-F1 ATP synthase, ΔΨm will drop further to reach Erev_ANT.
Exceeding Erev_ANT causes ANT reversal and by virtue, gives rise to the second barrier: the electrogenic nucleotide exchange through the reverse-operating ANT (exchanging cytosolic ATP4- for matrix ADP3-) antagonizes the initial depolarization stimulus. Assuming the magnitude of the initial depolarization is severe enough to force further decrease in ΔΨm, a third barrier emerges: the more positive the ΔΨm value
becomes, the higher the reverse activity of the ANT will be, as indicated by the bidirectional green arrow in Fig. 4. Likewise, decreasing ΔΨm favors acceleration of the reverse-operating FO-F1 ATP synthase as well [Chinopoulos et al. 2010]. Isolated and in situ mitochondria treated with inhibitors of the respiratory chain, exhibited magnitudes of ΔΨm that were clamped very near to the predicted Erev_ANT values, which makes sense as the reverse operation of the ANT cannot increase ΔΨm higher than Erev_ANT. Accordingly, under these conditions reverse ATP-ADP exchange rates mediated by the ANT were either zero or very small, depending on the type of substrates provided to mitochondria. Substrates can be divided into two groups, whether they support or bypass substrate-level phosphorylation [Chinopoulos et al. 2010].
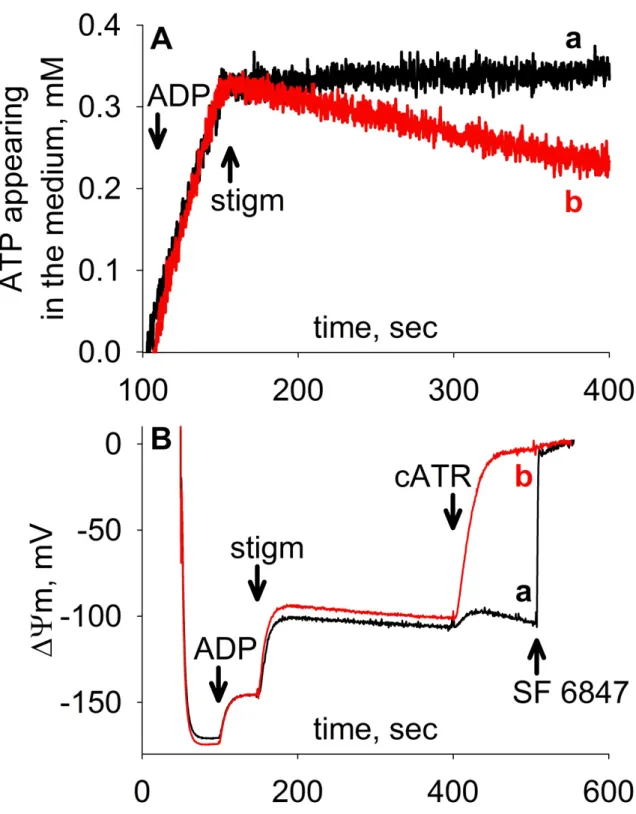
Glutamate and α-ketoglutarate are typical respiratory substrates that support ATP formation from substrate-level phosphorylation, while substrates such as succinate and β-hydroxybutyrate do not support this reaction (elaborated further in Chapters 2.7 and 5.2.2). As shown in Fig. 5A, when mitochondria respire on substrates supporting matrix substrate-level phosphorylation (black trace “a”), no cytosolic ATP consumption can be measured upon the addition of the complex III inhibitor stigmatellin (stigm). On the other hand, when mitochondria respire on succinate, stigmatellin not only ceases their ATP output, but it causes them to take up and hydrolyze the previously generated ATP.
Note, that even in case of an evidently reverse-operating ANT, consumption of ATP occurs 12-15 times slower than its production (red trace “b”). Even so, if mitochondria are provided with succinate, inhibition of ANT activity by carboxyatractyloside (cATR) still causes prompt and complete depolarization (Fig. 5B, trace “b”). These experimental results are in accordance with the above interpreted conclusion: in the absence of substrate-level phosphorylation ANT reverses indeed and by doing so it contributes to ΔΨm (maintained by the reversals of both ANT and FO-F1 ATP synthase); meanwhile, allowing only moderate mitochondrial ATP uptake. This is because ADP-ATP exchange generated membrane potential restricts the nucleotide exchange rates themselves (bidirectional green arrow in Fig. 4). Contrary to succinate, in the presence of substrate-level phosphorylation supportive respiratory substrates, carboxyatractyloside induces only a minor depolarization (Fig. 5B, trace “a”); implying that ANT is operating close to its thermodynamic equilibrium.
Figure 5. (A) Reconstructed time courses of ATP appearing in the medium after the addition of 1 mM ADP to isolated rat liver mitochondria respiring on 5-5 mM glutamate plus malate (a) or 5 mM succinate plus 1 μM rotenone (b), followed by addition of the complex III inhibitor, stigmatellin (stigm); 1.2 μM. (B) Time course of changes in safranin O fluorescence, calibrated to ΔΨm in isolated rat liver mitochondria respiring on 5-5 mM glutamate plus malate (a) or 5 mM succinate plus 1 μM rotenone (b). 1 mM ADP, 1.2 μM stigmatellin and 2 μM carboxyatractyloside (cATR) were added where indicated. At the end of the experiments, 200 nM of the uncoupler SF 6847 was added to achieve complete depolarization. ↑
This thesis builds on the concept soundly established according to argumentations above and in [2, 5, 80] and [Chinopoulos et al. 2010], postulating that if the reasons for mitochondrial depolarization are not great enough to overcome the membrane potential- generating actions of the reverse-operating ANT and FO-F1 ATP synthase (such as during inhibition of the four complexes of the respiratory chain by drugs or anoxia), mitochondria will consume cytosolic ATP at a very low rate, and only in the absence of matrix substrate-level phosphorylation. ATP uptake will be restricted by the extent of ΔΨm deviations from Erev_ANT towards more depolarizing values: greater deviation will entail greater opposition by the reversed ANT, as indicated by the green double arrow in Fig. 4. In the presence of sufficient matrix substrate-level phosphorylation, moderately depolarized mitochondria with an intact inner membrane cannot consume cytosolic ATP [Chinopoulos et al. 2010]. Nonetheless, accepting that the mechanism(s) causing the initial depolarization can be great enough to overcome the repolarization posed by the reversed FO-F1 ATP synthase and the ANT, mitochondria could become significant cytosolic ATP consumers. Such could be the case during activation of a low- conductance permeability or extensive uncoupling [115, 116], always assuming that the inner mitochondrial integrity is uncompromised. If there is no exogenous factor or endogenous molecular entity (see Chapter 2.3) to mediate a large decrease in ΔΨm, the barriers to overcome in order to force mitochondria to eventually consume cytosolic ATP are the potential-generating action(s) of the ANT and/or the FO-F1 ATP synthase.
2.9 What is the actual value of [ATP4-]freein/[ADP3-]freein ratio?
The determination of free matrix [ATP] and [ADP] is a challenging task, because of several limitations. First, in order to quantify matrix ATP and ADP values during phosphorylation, addition of ADP to the mitochondrial suspension is required, which will be converted to ATP. The fact that the matrix volume is likely several thousand times smaller than the experimental volume creates a technical challenge; as the matrix adenylate concentrations are many-fold lower than those appearing in the extramitochondrial compartment, therefore the smallest contamination from the experimental volume – which is inevitable – will lead to an overestimation of the matrix ATP/ADP ratio. This can be addressed by centrifuging phosphorylating mitochondria through lipid layers (e.g., silicon oil), thus excluding as much as possible the water- soluble extramitochondrial nucleotides. However, corrections still have to be made for
nucleotides residing in the intermembrane space that would be carried along the lipid layers. For isolated mitochondria, reports of matrix ATP/ADP ratios during phosphorylation range from 0.01 to 12 [94, 117-130]. For mitochondria in situ or in vivo, the consensus is in the 1-3 ratio range ([131-133] and y-axis of Fig. 3). Second, it is highly probable that results obtained after separation of intra- and extramitochondrial compartments are not relevant because of the time used for the separation process and possible interconversions of adenine nucleotides even in the presence of inhibitors [120, 127, 128, 134]. Third, matrix adenine nucleotides are bound to proteins [135], a notion supported by the fact that isolated mitochondria retain more than 50% of their total adenine nucleotide content after permeabilization by toluene [136]. Due to this potential binding of adenine nucleotides to intramitochondrial proteins [137-140], it is difficult if not impossible to estimate the relationship between the measured total ATP/ADP ratio to free intramitochondrial ATP/ADP ratio. Fourth, matrix micro-compartmentalization of adenine nucleotides has been reported by several groups independently from each other [123, 141-144], still this concept is yet to be accepted unequivocally [127, 145, 146]. It is perhaps better to predict free matrix ATP/ADP ratios using mathematical modeling, depending on parameters that can be reliably quantified [62].
Along these lines and for reasons elaborated in [62], predicting the concentration of free Pi in the mitochondrial matrix is also very challenging. Keeping in mind the uncertainty and fluctuation of the values that dictate Erev_ANT and Erev_ATPase, it cannot be overemphasized that the actual behavior of mitochondria in terms of ATP production or consumption and in terms of whether it is cytosolic or matrix in origin is the convergent result of many complex mechanisms.
2.10 The critical role of α-ketoglutarate dehydrogenase complex in maintaining mitochondrial phosphorylation potential during respiratory arrest
The α-ketoglutarate dehydrogenase complex (KGDHC) is an enzyme consisting of multiple copies of three subunits: α-ketoglutarate dehydrogenase (KGDH or E1k, EC 1.2.4.2), dihydrolipoyl succinyltransferase (DLST or E2k, EC 2.3.1.61) and dihydrolipoyl dehydrogenase (DLD or E3, EC 1.8.1.4). It participates in the citric acid cycle, where it irreversibly catalyzes the conversion of α-ketoglutarate, CoASH, and NAD+ to succinyl-CoA, NADH, and CO2. It may exhibit a high flux-control
![Table 1. Original definition of respiratory steady states by Chance and Williams [33]](https://thumb-eu.123doks.com/thumbv2/9dokorg/1383204.114223/11.892.120.771.765.926/table-original-definition-respiratory-steady-states-chance-williams.webp)