This manuscript contextually corresponds with the following paper:
1
Kertész, M., Ónodi, G., Botta-Dukát, Z., Lhotsky, B., Barabás, S., Bölöni, J., Csecserits, A., Molnár, C., 2
Nagy, J., Szitár, K., & Rédei, T. 2020. Different impacts of moderate human land use on the plant 3
biodiversity of the characteristic Pannonian habitat complexes. Flora 267: 151591.
4
https://doi.org/10.1016/j.flora.2020.151591 5
Availability of the original paper:
6
https://www.sciencedirect.com/science/article/abs/pii/S0367253020300554 7
8
Different impacts of moderate human land use on the plant biodiversity of the characteristic Pannonian 9
habitat complexes 10
Miklós Kertésza*, Gábor Ónodia, Zoltán Botta-Dukáta, Barbara Lhotskya, Sándor Barabása, János Bölönia, 11
Anikó Csecseritsa, Csaba Molnára, József Nagyb, Katalin Szitára, and Tamás Rédeia 12
aInstitute of Ecology and Botany, MTA Centre for Ecological Research, Alkotmány u. 2–4, 2163 Vácrátót, 13
Hungary 14
bThe Museum and Library of Hungarian Agriculture, Városliget, Vajdahunyadvár, 1146 Budapest, 15
Hungary 16
*corresponding author, e-mail address: kertesz.miklos@okologia.mta.hu 17
Abstract 18
Habitat complexes exhibit varying vulnerability to human land use and thus have different impacts on 19
biodiversity. In this study, we analyzed the effect of moderate land use on the plant species diversity in six 20
characteristic Pannonian habitat complexes: forest steppe complex on sand, on dolomite, and on loess, as 21
well as alkaline habitat complex, freshwater marsh complex, and zonal broadleaf colline forest. We chose 22
two regions for each complex, and in each region, we selected a 2 x 2 km “natural” study site in a mostly 23
protected area, and a moderately used “managed” site of the same size. We compared the alpha, beta, and 24
gamma diversities of the total and the specialist species pools of the natural-managed site pairs by 25
applying stratified random sampling and novel bootstrap statistics.
26
The gamma diversity of the specialist species pool was found to be the most sensitive indicator of 27
naturalness. It was higher in the natural sites of the loess and dolomite forest steppe and the freshwater 28
marshland complexes, while there were no significant diversity differences in the other complexes. The 29
diversity comparisons showed a consistent pattern: there were either no significant diversity differences in 30
any of the natural-managed pairs, or there were significant differences in the gamma diversities of the 31
specialist species pool in both the natural-managed pairs.
32
We concluded that the same differences in naturalness may represent different sensitivities to human 33
management as characterized by differences in diversity measures. Three habitat complexes, the loess and 34
dolomite forest steppe and the freshwater marshland, require more focused nature protection efforts in 35
order to preserve the habitat diversity, especially in maintaining the remnants of the natural woody patches 36
and the most inundated habitats of the marshlands. In the case of the other studied complexes, moderate 37
human land use can be harmonized by nature protection goals.
38
Keywords 39
Naturalness; Land use; Gamma diversity; Specialist species; Bootstrap method;
40
Nomenclature: Simon (2000) 41
Geographical names: Kocsis (2018), page 126 42
1. Introduction 43
The increase in human land use is causing a global decline of biodiversity (Butchart et al., 2010; Hoekstra 44
et al., 2005). Besides regional and global drivers, the consequences of local land use decisions are major 45
factors of this global decline (Foley et al., 2005). Studies on human land use and biodiversity relations are 46
important for both theoretical and practical reasons (Cardinale et al., 2012). A growing body of knowledge 47
on these relations is being generated from experiments, large scale research, and case studies (Hudson et 48
al., 2014). So far, the results are too diverse for general predictions concerning nature protection.
49
Moreover, different biotic communities of varying scales react differently to human impact (McGill et al., 50
2015).
51
On most parts of the Earth, especially in the temperate climate zones, only small patches with more or less 52
natural biotic communities are left in the matrix of areas that are exposed to variably intense land use. Out 53
of these areas, the wilderness that are often not strictly protected should be safeguarded as an important 54
element for maintaining biodiversity (Mittermeier et al., 2003). While the protection of the biodiversity 55
hotspots is particularly important, it may not be enough if the wilderness around the hotspots are 56
degrading (Mittermeier et al., 2011).
57
Low intensity land use does not necessarily lead to local decrease of biodiversity (Newbold et al., 2015).
58
In Central and Eastern Europe, the rural landscape is a major contributor to the regional biodiversity, more 59
so than in the more urbanized Western Europe (Palang et al., 2006). According to national mapping of 60
natural capital, the moderately altered rural landscapes have essentially contributed to the naturalness of 61
the country (Czúcz et al., 2008).
62
Human impact causes a decrease in the naturalness of various habitat complexes, which may result in a 63
loss in biodiversity (Dengler et al., 2014; Wallenius et al., 2010). We were interested in how the decrease 64
in naturalness and changes in biodiversity are related at the landscape level. Our aim was to study the 65
impact of moderate land use on the diversity of the most characteristic natural habitat complexes of the 66
Pannonian biogeographical region. However, no comparative studies exist on moderate human impact on 67
the major habitat complex types of high biodiversity value in Hungary. Although many studies deal with 68
the effect of human impact on certain components of biodiversity (e.g. Biró et al., 2008; Botta-Dukát, 69
2008; Csaba et al., 2015; Csontos et al., 2012; Deák et al., 2016; Molnár et al., 2012; Somodi et al., 2004;
70
Standovár et al., 2006; Tóth and Kertész, 1993), the scale of habitat complexes is beyond the scope of 71
these studies. We intend to provide a reliable estimation of the impact of the moderate intensity human 72
management to the most characteristic natural habitat complexes of Hungary. We chose the diversity of 73
the vascular plants as a biodiversity indicator and six habitat complexes to represent the major habitat 74
types of the Pannonian biogeographical region (Zólyomi, 1989). We also aim to compare the diversities of 75
the specialist species separately because we assume these would provide more relevant information on the 76
impact of human management (Clavel et al., 2011; Naaf and Wulf, 2010)..
77
In this paper, we put forward the following research questions: 1) Do the pairs of natural-managed habitat 78
complexes differ based on alpha, beta, and gamma diversity indices? 2) Do the diversity indices calculated 79
by specialist species respond differently to the level of human management than those of the total species?
80
In order to assess the impact of humans on landscape scale diversity, with regard to both the actual plot 81
scale diversity and the area of habitat types, we used a novel application of bootstrap on a stratified relevé 82
sample. Our general null hypothesis was that there was no difference between the natural and 83
corresponding managed pairs in the diversity estimations.
84
2. Materials and methods 85
2.1. Habitat complexes 86
We chose six characteristic habitat complexes of Hungary for our study (Zólyomi, 1989). Four of them 87
were edaphic variations of the forest-steppe biome, namely forest-steppe developed on loess, dolomite, 88
and sand substrate and on alkaline soils (Molnár et al., 2012), as well as the formerly much more extended 89
lowland marsh habitat complex (Zólyomi, 1989; Varga et al., 2013), and finally, the most widespread 90
quasi natural habitat type of the country, the low- and mid-range mountain forests (Bölöni et al., 2008).
91
For each habitat complex we selected two natural–managed site pairs to compare their alpha, beta, and 92
gamma plant species diversity.
93
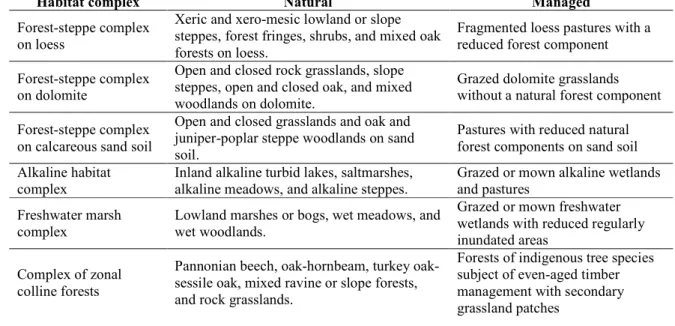
The major characteristics of the natural and managed sites (see 2.2) of the six selected habitat complexes 94
are summarized in Table 1.
95
Table 1. The six characteristic habitat complexes that represent a majority of the natural habitats in 96
Hungary.
97 98
Habitat complex Natural Managed
Forest-steppe complex on loess
Xeric and xero-mesic lowland or slope steppes, forest fringes, shrubs, and mixed oak forests on loess.
Fragmented loess pastures with a reduced forest component Forest-steppe complex
on dolomite
Open and closed rock grasslands, slope steppes, open and closed oak, and mixed woodlands on dolomite.
Grazed dolomite grasslands without a natural forest component Forest-steppe complex
on calcareous sand soil
Open and closed grasslands and oak and juniper-poplar steppe woodlands on sand soil.
Pastures with reduced natural forest components on sand soil Alkaline habitat
complex
Inland alkaline turbid lakes, saltmarshes, alkaline meadows, and alkaline steppes.
Grazed or mown alkaline wetlands and pastures
Freshwater marsh complex
Lowland marshes or bogs, wet meadows, and wet woodlands.
Grazed or mown freshwater wetlands with reduced regularly inundated areas
Complex of zonal colline forests
Pannonian beech, oak-hornbeam, turkey oak- sessile oak, mixed ravine or slope forests, and rock grasslands.
Forests of indigenous tree species subject of even-aged timber management with secondary grassland patches
99
2.1.1. Forest-steppe complex on loess 100
Fragments of the forest steppe on loess areas survived to larger extent on the southern slopes of the 101
Transdanubian Range and North Hungarian Range, where the relief limited the extent of intensive 102
agriculture (Erdős et al., 2014; Illyés and Bölöni, 2007). Several areas had been utilized as vineyards until 103
the end of the 19th century and then were grazed with varying intensity. In order to maintain the pastures, 104
woody vegetation in large areas were cut down. The slopes with deep soils were often covered by woody 105
vegetation, while on the heavily eroded surface rocks, grasslands formed. Such a complex can be 106
extremely rich in plant species and can serve as an important refuge for several endangered forest steppe 107
species of the Pannonian region (Molnár et al., 2012).
108
2.1.2 Forest-steppe complex on dolomite 109
This habitat complex appears in the largest extent on the Transdanubian Range. The rich relief and limited 110
soil formation result in a fine scale mosaic of edaphic habitats with considerable richness in endemic and 111
specialist species at the edge of their distribution range (Zólyomi, 1958; Debreczy, 1987). This mosaic 112
consists of open rock grasslands and slope steppes, closed rock grasslands on the top of the northern 113
slopes, and woody vegetation in the depressions and the lower parts of the slopes with deeper soils. In the 114
southern exposition and the northern slopes, termophilous dry open oak woodlands and mesic ravine 115
forest types are typical, respectively. Traditionally, the land is used for grazing sheep; therefore, the extent 116
of woody vegetation has reduced (Báldi et al., 2013).
117
2.1.3. Forest-steppe complex on calcareous sand 118
This habitat complex is mostly found in the Danube-Tisza Midland Ridge of the Kiskunság region in 119
Central Hungary. The extreme moisture regime of the coarse sand, the rich relief, and the transitional 120
forest-steppe climate of the region has resulted in a fine scale mosaic of dry sandy grasslands, open oak 121
and juniper-poplar woodlands, and closed oak or poplar forests (Kertész et al., 1993). Woody habitats are 122
relatively species poor in comparison to grasslands, which are rich in endemic species (Rédei et al., 2014).
123
The land was traditionally used mostly for grazing cattle and sheep. With the intensification of land use, 124
rich soils of the lowest elevation had been ploughed, and extended tree plantations had been established.
125
The Kiskunság region has suffered a significant decrease in the soil water table over the last decades, 126
which has led to significant degradation in the natural/semi-natural vegetation (Biró et al., 2008).
127
2.1.4. Alkaline habitat complex 128
Alkaline vegetation is widespread in the lowland areas of the Great Hungarian Plain (Molnár and Borhidi, 129
2003). The composition of vegetation is determined by the distance of the vegetation from the soil water 130
table. A few centimeters of difference can change the vegetation and result in a fine scale mosaic (Deák et 131
al., 2014; Tóth and Rajkai, 1994). In depressions with long-time yearly water cover, alkaline marshes and 132
alkaline wet meadows dominate. Near the soil water table, annual alkaline mud vegetation and Puccinellia 133
limosa swards appear. A few centimeters higher, alkaline steppe grasslands dominate. Their species pool 134
contains several Pontic and Pontic-Pannonian elements, which confirm the long-time presence of the 135
complex in the region. At the highest level, isolated steppe grassland patches mosaic with the alkaline 136
vegetation; their character is determined by the substrate. However, the abiotic stress strongly limits the 137
species pool (Török et al., 2012). When the soil water table decreases significantly, the alkaline character 138
disappears, and the species poor dry grassland substitutes the alkaline vegetation (Bagi, 1988).
139
Traditionally, the land is dominantly used for grazing by cattle on the deeper end and by sheep on higher 140
elevation (Báldi et al., 2013).
141
2.1.5. Freshwater marsh complex 142
Before the river regulations and artificial drainage campaigns in the 19th century, a large part of the Great 143
Hungarian Plain was covered by different wetland complexes (Biró et al., 2018; Schweitzer, 2009;
144
Verhoeven, 2014). The freshwater wetland types were either alluvial or groundwater based. On the 145
alluvial terrains of the large rivers, the continental types of the eutrophic wet meadows were dominated 146
with riverine willow scrubs, reed beds, and tall herb vegetation. Moreover, dryer areas are covered with 147
mesic pastures and hay meadows. The intensively changing water regime limits the plant species pool of 148
this region. On groundwater-based wetlands, rich fens and oligotrophic meadows dominate. Willow 149
scrubs and oligotrophic tall herb vegetation are found at lower elevations, while, on higher areas, steppe 150
grasslands substitute the meadows. The natural mosaic of wet and dry grasslands result in high species 151
diversity (Molnár et al., 2008). A main factor behind the degradation is the decrease in soil water table, 152
when secondary mesic and dry grasslands appear, with significantly less species richness (Biró et al., 153
2013). Traditionally, the land is use for mowing and grazing cattle along with controlling the woody 154
vegetation.
155
2.1.6. Complex of zonal colline forests 156
Deciduous forests constitute the zonal vegetation in the colline and mid-range regions of the Pannonian 157
basin (Trandanubian Range, Transdanubian Hills, and North Hungarian Range) (Zólyomi, 1989; Bölöni et 158
al., 2008). Sessile oak dominates the elevation between 200 and 500 m, while European beech prevail 159
above this level. Sessile oak is mixed with turkey oak on dryer plateaus and southern slopes and with 160
European hornbeam in more humid habitats. On shallow soils, mixed ravine and rock debris forests grow.
161
On peaks and ridges in the southern exposition, small patches of rock grasslands, slope steppes, and 162
scrublands increase the diversity of the habitats. In smaller areas where drainage is poor, fens and 163
meadows may appear. Furthermore, small watercourses are tied with thin gallery forest belts. In the whole 164
region, even-aged timber management is the norm (Lett et al., 2016); thus, more or less natural stands with 165
a mixed age structure and tree species composition are very rare. Locally, alien spruce, black pine, and 166
Scots pine may have been planted to a considerable extent.
167
2.2. Selection of study sites 168
We used the database of the MÉTA habitat mapping project (Molnár et al., 2007) for selecting the location 169
of the study sites. The database is the result of a national habitat mapping project, a collaborative effort of 170
more than 200 botanists who spent more than 7,000 workdays on the field. The surveyors recorded the 171
natural and semi-natural vegetation types in 260,000 hexagons of 0.35 km2 by applying the MÉTA habitat 172
classification system (Bölöni et al., 2011) with the help of satellite images, airborne photographs, as well 173
as actual and historical topographical maps. Beyond vegetation types, naturalness was also estimated on a 174
1–5 point scale (1 – totally degraded state; 5 – natural state) as well as some additional variables, such as 175
the presence of alien invasive plants species.
176
Although the database consisted of habitat records from hexagons of 0.35 km2, which limited the spatial 177
resolution, the area ratios of different habitats, characterized by vegetation types and naturalness indices, 178
were provided for each hexagon. The aim of the study site selection process was to represent the diversity 179
of the habitat complexes in the region. We intended to apply the criteria as follows: a) 80% of the area of 180
“natural” site should be covered by vegetation types that belong to the studied habitat complex and are 181
characterized by a high naturalness index (4 – semi-natural state; 5 – natural state); b) 80% of the area of 182
“managed” sites should be covered by vegetation types that belong to the studied habitat complex and are 183
characterized by a medium naturalness index (3 – moderately degraded state); c) the study sites should 184
contain as many suitable habitat types as possible; d) the members of the natural–managed pairs should be 185
share similarities in basic geographic features and should be close to each other.
186
However, all the selection criteria could not be accommodated; the 2 x 2 km size of the study sites was the 187
largest one where a majority of the requirements could be met. A reason for the difficulties in selecting 188
and positioning the study sites was that the patches of the “natural” quality habitat complexes were small 189
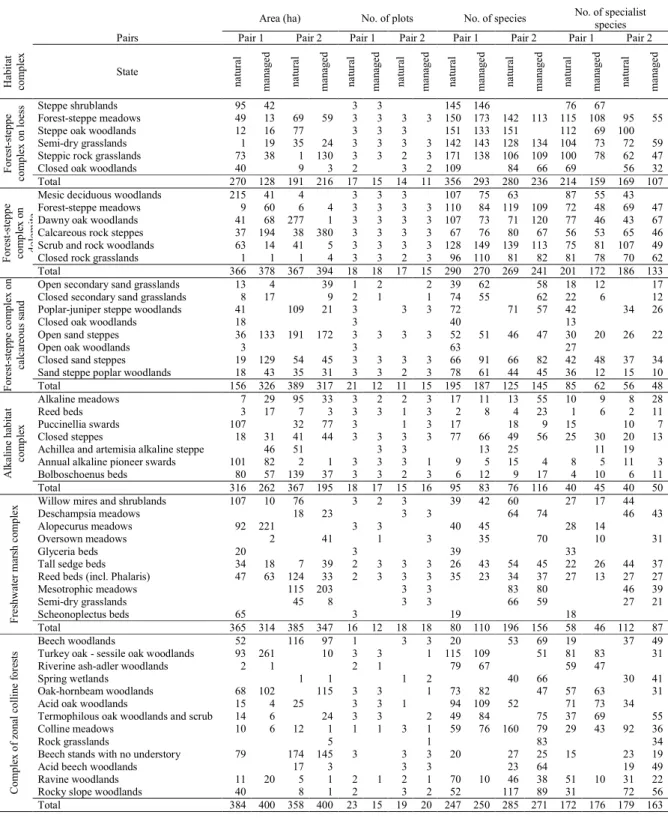
and isolated. In the case of the forest-steppe complex on loess, the cover varied between 32% and 68%. As 190
for the forest-steppe complex on dolomite (see Table A1), the members of one of the natural–managed 191
pairs (Csákvár-Zalahaláp) were close to the opposite ends of the Transdanubian Range. (Fig. 1, pair D2).
192
For choosing between appropriate sites and for exact positioning, expert decisions were sought.
193
194
Figure 1.
195 196
2.3. Determination of habitat type areas 197
We also used the database of the MÉTA habitat mapping project for assessing the proportion of each 198
sampled habitat that is relative to the 2 x 2 km study sites. For this purpose, we chose 13 hexagons of 0.35 199
km2 from the MÉTA database that occupied the largest parts of the study sites. These hexagons provided 200
information on the extent of the habitats that covered 90 percent of the sites on average without covering 201
considerable areas of the surroundings, and we extrapolated the summarized habitat ratios of the hexagons 202
to the whole sites. The application of more hexagons that covered areas beyond the sites was not a viable 203
option because of the careful positioning of the borders of the sites.
204
2.4. Selection of plots 205
For recording relevés, we chose a 20 x 20 m plot size. The first step of the selection of plots was to 206
compile a concise list of habitat types for each study site based on the MÉTA habitat mapping data and 207
preliminary field survey, which resulted in 6 to 13 habitat types per habitat complex and 4 to 11 types per 208
study site (see Table A1). Only the habitats with 3, 4, or 5 naturalness indices were taken into account.
209
Each habitat type was sampled by a maximum of 3 plots. The plots of a given habitat type were placed in 210
a separate patch or at a minimum of 200 m away from each other in larger patches. If there was no 211
opportunity to place three plots in the above manner because the habitat type occurred only in one or two 212
small patches, we placed only one or two plots in the given habitat type. The exact positions were 213
randomly chosen based on high resolution multicolor aerial photographs. The quality of the aerial photos 214
was good enough to avoid vegetation type boundaries inside sampling units. The placing of the quadrats 215
were adjusted on the field, if necessary, in order to avoid roads or other intensive local anthropogenic 216
disturbances.
217
2.5. Sampling 218
The percentage covers of the vascular plant species were recorded in the relevés. The exact position of the 219
plots was determined by GPS in the field. The sampling was carried out between 2007 and 2012 (See 220
Appendix III).
221
2.6. Statistical evaluation 222
The number of species, the simplest and most widely used diversity measure was chosen. Thus, alpha 223
diversity is the mean richness of a randomly selected plot, gamma diversity is the number of species in a 224
pooled species list of several plots, and beta diversity is the ratio of gamma and alpha diversity. The unit 225
of alpha and gamma diversity is the number of species, while the unit of beta diversity is the number of 226
maximally distinct communities (Jost, 2007; Tuomisto, 2010).
227
The observed gamma diversity strongly depends on sampling intensity, i.e., the number of plots (Gotelli 228
and Colwell, 2001). There are two approaches to correct possible problems that emerge when estimates 229
with different sampling intensities are compared: extrapolation (Colwell and Coddington, 1994; Palmer, 230
1990) and rarefaction (Chiarucci et al., 2008). Extrapolation methods assume that the species composition 231
(at least roughly) is homogeneous, i.e., the probability of occurrence of a given species is the same in each 232
plot, which is clearly not satisfied for our habitat complexes. Chao et al. (2000) developed a method for 233
extrapolating richness in two communities and their shared species. In case of a habitat complex 234
comprising only two habitats, the sum of the two extrapolated richness minus the extrapolated number of 235
shared species results in the extrapolated richness. Unfortunately, this cannot be generalized to cases with 236
three or more habitat types, where the number of the shared species should be estimated for not only pairs, 237
but also triplets, quadruplets, etc., of habitats.
238
Incidence-based rarefaction provides the expected numbers of species observed in a given number of plots 239
when the plots are randomly drawn without replacement (Colwell et al., 2004; Colwell and Coddington, 240
1994). It can be done easily by randomization; however, analytical solution is also a possibility (Chiarucci 241
et al., 2008; Mao et al., 2005). While analytical solution assumes environmental homogeneity, random re- 242
sampling does not.
243
In the simplest re-sampling scheme, each plot is drawn with the same probability. In an appropriate re- 244
sampling scheme, the original sample comes from random sampling. However, in a heterogeneous 245
landscape, stratified random sampling is more appropriate than complete random sampling since the latter 246
easily misses the rare habitat types. We had conducted stratified random sampling in the field; therefore, 247
we could not apply complete random re-sampling. Instead, we applied bootstrap re-sampling where the 248
probability of drawing each plot is proportional to the area of habitat it belongs to divided by the number 249
of plots in that habitat type. In this way, the proportions of the habitats in the bootstrap samples were 250
approximate to the proportions of habitats in the landscape (and may have differed from their proportion 251
in the original sample, where the rare types were over-represented). The size of the bootstrap sample was 252
set to the lower sample size in the habitat complex pair. Bootstrapping means re-sampling with 253
replacement, while in traditional rarefaction, plots are drawn without replacement. We did not apply 254
drawing without replacement because, in this approach, the proportions of habitats in the original sample 255
strongly constrain their proportions in the rarefied sample.
256
We used a stratified bootstrap, where the same numbers of plots were drawn from both the members of the 257
habitat complex pair. Then, the alpha, beta, and gamma diversity were calculated for both halves of the 258
bootstrap sample, which resulted in estimates for natural and managed sites. Finally, the difference 259
between the values in natural and managed sites was calculated in each bootstrap sample. Ten thousand 260
bootstrap samples were drawn for each pair, mean differences were estimated as the mean of the bootstrap 261
values, and the borders of the 95% confidence intervals were estimated by 250th and 9750th values among 262
the ordered bootstrap values 263
All the analyses were conducted on two sets of species: all species and specialist species. This 264
classification represents the faithfulness (or fidelity) of the species to natural vegetation types (Becking, 265
1957), in line with the use of the term by Clavel et al. (2011) and Naaf and Wulf (2010). The grouping of 266
the species was based on the social behavior type classification of the Hungarian flora by Borhidi (1995) . 267
All analyses were done in an R 3.5.3 environment (R Core Team, 2019) using “boot” add-on package 268
(Canty and Ripley, 2017).
269
3. Results 270
In the 24 study sites, we recorded 391 relevés, in total, and detected 1180 species. That is 50% of the flora 271
of 93,000 km2 in Hungary were found in quadrats with an area of only 0.15 km2 altogether. 49% of the 272
recorded species belonged to the specialist group. In Table A1, we showed the areas of the studied habitat 273
types in the study sites, the number of relevés, as well as the recorded number of all and specialist species.
274
275
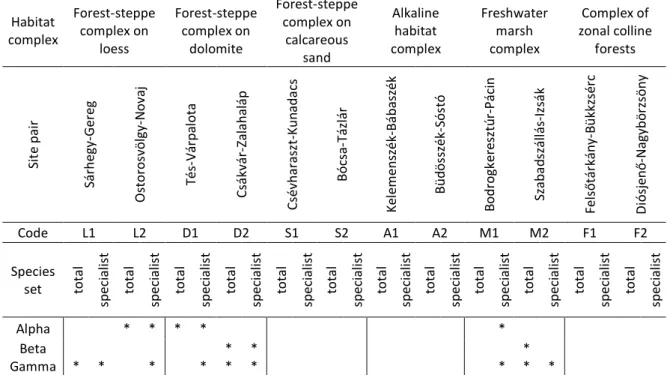
Table 2. The detected total and specialist species richness of the study areas and the results of statistical 276
analyses based on the bootstrap estimations of the total and specialist species richness distributions.
277
Habitat complex
Forest-steppe complex on
loess
Forest-steppe complex on
dolomite
Forest-steppe complex on
calcareous sand
Alkaline habitat complex
Freshwater marsh complex
Complex of zonal colline
forests
Site pair Sárhegy-Gereg Ostorosvölgy-Novaj Tés-Várpalota Csákvár-Zalahaláp Csévharaszt-Kunadacs Bócsa-Tázlár Kelemenszék-Bábaszék Büdösszék-Sóstó Bodrogkeresztúr-Pácin Szabadszállás-Izsák Felsőtárkány-Bükkzsérc Diósjenő-Nagybörzsöny
Code L1 L2 D1 D2 S1 S2 A1 A2 M1 M2 F1 F2
Species
set total specialist total specialist total specialist total specialist total specialist total specialist total specialist total specialist total specialist total specialist total specialist total specialist
Alpha * * * * *
Beta * * *
Gamma * * * * * * * * * 278
In case of the site pairs, the first one is the name of the natural site, and the second is the managed site. The codes are the same
279
ones used in the map of Fig. 1. We provided separate results for the pools of the total species and the specialist species.
280
Alpha, beta, and gamma show the results of the comparison of the estimated alpha, beta, and gamma diversity measures,
281
respectively, in the natural and managed sites. * denotes that the 95% range of the difference between the estimated species
282
number values did not contain 0 and the value in the natural site was higher. (See also Fig. 2 and Fig. A1 for the difference
283
values.)
284 285
We found significant differences in three habitat complexes, namely in the Forest steppe on loess, Forest 286
steppe on dolomite, and Freshwater marsh (Table 2). In these three habitat complexes, the gamma 287
diversities of the specialist species were significantly higher in both the natural sites than in the 288
corresponding managed sites (Fig. 2). In three natural–managed pairs (L2, D1, M1), we found significant 289
differences only in the specialist species, which means that 9 out of the possible 12 gamma diversities 290
proved higher in the natural sites. Regarding alpha and beta diversities, only 8 of the possible 24 291
differences were significant, and no matching of alpha and beta diversity differences occurred.
292 293
294
Figure 2.
295 296
4. Discussion 297
In the case of three habitat complexes, namely the forest-steppe on sand, the alkaline habitat complex, and 298
the colline forests, we could not reject the null hypothesis, i.e., the diversity measures for the natural and 299
managed sites were not significantly different. However, in case of the forest-steppe complexes on loess 300
and dolomite as well as the marsh complex, the gamma diversities of the specialist species pool were 301
significantly higher in the natural sites.
302
The results show that gamma diversity proved to be the most informative variable, and the specialist set of 303
species were more sensitive to the differences between the natural and managed sites than the set of all 304
species. The significant differences in the gamma diversity of the specialist species between natural and 305
managed sites predicted significant differences in the other diversity measures in the same habitat 306
complex. Subsequently, there were no significant differences in the diversities in habitat complexes where 307
specialist gamma diversities were not different. This indicator feature is in agreement with the general 308
finding that the specialist species are particularly sensitive to the degradation processes both globally 309
(Clavel et al., 2011) and also in the case of the grasslands of the forest steppe biome (Deák et al., 2016).
310
However, we never found both the alpha and beta diversity to be significantly higher in the natural sites, 311
which would automatically lead to significant differences in gamma diversity (Jost, 2007). Thus, the 312
differences between the natural and managed areas were never significant as they would manifest both in 313
the local species richness and dissimilarities between the local assemblages. In two cases (L2 and D1 314
pairs, all species) we found that the alpha diversities were significantly higher in the natural sites while the 315
gamma diversities were not so. The beta diversities of these pairs were apparently the same (Appendix A, 316
Fig. A1 , upper left), while the gamma diversities were close to be significantly different (Fig. 2, left).
317
We found 50% of the Hungarian flora (Simon, 2000) in 0.00016% of the area of the country, which means 318
that the observed average species-area curve of the survey (Rosenzweig, 1995) was much steeper than the 319
expected curve for Hungary (Appendix A, Fig. A2). This shows that the sampling strategy we chose 320
proved to be effective in detecting the species richness of the vegetation at the scale of our study. The 321
stratified bootstrap statistical method provided an opportunity to compare the diversity of the pairs of 322
heterogeneous study sites with different habitat compositions.
323
324
4.1. Habitat complexes 325
Although we analyzed the statistics on diversity comparisons for pairs of sites, we discuss the results for 326
the habitat complexes for the two pairs of sites because the plot and site level diversity comparisons 327
showed a consistent pattern: there were either no significant diversity differences in any of the natural–
328
managed pairs, or there were significant differences in the gamma diversities of the specialist species pool 329
in both the natural–managed pairs, which were accompanied by some other significant differences.
330
4.1.1. Forest-steppe complex on loess 331
The gamma diversities of the specialist species were significantly higher in the natural sites than the 332
managed ones. The ratios of the scrublands and woodlands were considerably higher in the natural sites 333
(51% vs 18% combined), and one of the woodland types of the natural sites was absent in the managed 334
ones in each pair (Table A1). Moreover, in each pair and in each habitat type, the number of specialist 335
species found was smaller in the managed sites (Table A1). Accordingly, we found a significant alpha 336
diversity decrease in the case of pair L2 (Table 2). A major threat for the forest steppe biome is habitat 337
loss due to the high fertility of the soil at continental scales (Dengler et al., 2014; Werger and van 338
Staalduinen, 2012) and in the Pannonian region (Illyés and Bölöni, 2007; Molnár et al., 2012). The loss of 339
shrublands and woodlands may particularly contribute to the decrease in species richness because of the 340
high diversity of the edge communities (Erdős et al., 2014).
341
4.1.2. Forest-steppe complex on dolomite 342
The partly open woodland components of both natural sites were more extended than the managed ones 343
(D1: 87% vs 33% and D2: 87% vs 2%, in natural vs managed sites, respectively, see Table A1) because of 344
the historical land use as pasture, which had reduced the woodland component (Bölöni et al., 2008).
345
Furthermore, the species richness values of specialists were higher in the natural sites for 10 out 12 346
possible habitat type comparisons (see Table A1), and 7 of the 12 diversity estimations of the natural sites 347
were significantly higher than those of the managed sites. The managed Zalahaláp site consisted almost 348
exclusively of calcareous rock steppes (380 ha out of 394 total area, see types H2 and H3 in Molnár et al., 349
2008). This resulted in lower beta diversity values because the lack of habitat type diversity was detected 350
due to the bootstrap method applied.
351
4.1.3. Forest-steppe complex on calcareous sand soil 352
The woody component of this complex was considerably smaller in the managed sites than in the natural 353
ones (31% vs 3%) but this did not lead to significant differences in the diversity measures because the 354
studied dominant habitat types, the open and closed grasslands, are similarly diverse in the natural and 355
managed sites even in the case of secondary grasslands. The regeneration potential of grasslands is 356
exceptionally high (Csecserits et al., 2011; Ödman et al., 2012; Szitár et al., 2014), so the major problem 357
in preserving the elements of the forest-steppe in sand is the habitat loss in the grasslands (Biró et al., 358
2008) and the open and closed woodlands (Bölöni et al., 2008; Rédei et al., 2020). 359
360
4.1.4. Alkaline habitat complex 361
362
The vegetation of the alkaline habitat complex is highly adaptable to extreme environment (Molnár and 363
Borhidi, 2003; Török et al., 2012); therefore, the vegetation type, which comprises highly specialized 364
species, strongly indicates the soil and water features (Tóth and Rajkai, 1994). Most of the human impact 365
is related to changes in the water regime (Ladányi et al., 2016). In fact, the decrease in water table in the 366
Great Hungarian Plain led to the disappearance of many soda pans with their alkali steppe surroundings 367
(Bagi, 1988; Biró et al., 2008). The more moderate human induced degradation forms, such as 368
overgrazing or trampling, are hardly indicated by the highly specialized flora (Tóth and Kertész, 1993).
369
Although our natural and managed sites were distinguished by the field botanists of the MÉTA habitat 370
mapping project (Molnár et al., 2008), we could not find clear differences either in habitat type 371
composition or in vegetation diversity.
372
4.1.5. Freshwater marsh complex 373
In the case of both pairs of the freshwater marsh complexes, we detected significantly higher gamma 374
diversities for the specialist species of the natural sites than the managed ones. The differences in habitat 375
type compositions and slightly larger specialist species pool of the natural sites explain this result. The 376
only woodland habitat, the willow mires and shrublands, covered considerably larger areas in the natural 377
sites (M1 – 29% vs 3% and M2 – 20% vs 0% in natural vs managed sites, respectively. See Table A1), 378
which is similar to most of the water-logged habitats dominated by Phragmites, Phalaris, Glyceria, and 379
Schoenoplectus (M1 – 36% vs. 20% and M2 – 32% vs 10%). On the contrary, the managed sites were 380
mostly covered by different types of meadows, including oversown stands (M1 – 25% vs 71% and M2 – 381
35% vs 77%). Besides the difference in habitat composition, the recorded numbers of specialist species 382
were higher in the natural sites in 10 out of 14 habitat type comparisons. We concluded that the reason for 383
the significantly higher specialist gamma diversity values in the natural sites was the reduced landscape 384
heterogeneity of the managed sites due to lower water table level and more intensive land use (Biró et al., 385
2008; Csaba et al., 2015; Shi et al., 2010).
386
4.1.6. Complex of zonal colline forests 387
We did not find any significant differences in the species diversities of the natural and managed sites in 388
the colline forest complex. This shows that the architecture, species composition, and age distribution of 389
the canopy, which were the criteria for naturalness determination in the MÉTA habitat mapping project 390
(Bölöni et al., 2008), do not necessarily distinguish between the diverse and less diverse understory, which 391
determines the species diversity. Moreover, even the “natural” sites did not consist of primeval or truly 392
old-growth stands with a natural fauna and disturbance regime, including gap dynamics, because there are 393
not enough old-growth forests in Hungary for a study at a 2 x 2 km scale (Paillet et al., 2010). The 394
relatively well managed stands (i.e., without a long deforested stage, erosion, or plantation) showed the 395
same diversity, which is in agreement with other studies (Bartha et al., 2006; Lindenmayer et al., 2006;
396
Standovár et al., 2006).
397
5. Conclusion 398
We found, corresponding to our expectations, that the most sensitive variable of the diversity to land use 399
was the gamma diversity of the specialist species pool. We also found that the diversity values were 400
higher in the natural sites of the forest steppe complex on loess, forest steppe complex of dolomite, and 401
freshwater marshland complex. The common feature of these natural–managed pairs was that the woody 402
component was considerably lower on the managed sites, which made them less heterogeneous at the 403
landscape scale. In the case of the freshwater marshland complex, the habitats with the highest water 404
levels were also lower, further decreasing the landscape heterogeneity. On the contrary, in the case of the 405
other three complexes, the natural and the managed sites were similarly heterogeneous. The high 406
disturbance tolerance and regeneration capacity of the sand vegetation and the highly specialized stress 407
tolerant vegetation in the alkali habitat complex made the moderate intensity human land use virtually 408
undetectable by means of species diversity.
409
We concluded that the same differences in naturalness may represent the different sensitivities of the 410
habitat complexes to human management, which are characterized by differences in diversity measures.
411
We identified three more sensitive habitat complexes, the loess and dolomite forest steppe and the 412
freshwater marshland. In these complexes, special attention would be required for preserving the most 413
vulnerable habitat types (Biró et al., 2018; Hoekstra et al., 2005), the woodlands and the water-logged 414
habitats. In the case of the other three complexes, the moderate human land use can be harmonized with 415
nature protection goals (Hannah et al., 1995).
416
Acknowledgement 417
The National Parks are gratefully acknowledged for their permissions, local information, and logistics, 418
which helped in the field work.
419
Funding: This work was supported by the Hungarian Scientific Research Fund and the National 420
Research, Development and Innovation Office (NKFP6/013/2005, OTKA-NKTH CNK80140, FK128465, 421
PD128385, and GINOP 2.3.3-15-2016-00019).
422
References 423
Bagi, I., 1988. The Role of Water Management in the Degradation Processes of Halophilic Vegetation in 424
Hungary. Environ. Conserv. 15, 359–362. https://doi.org/10.1017/S037689290002988X 425
Báldi, A., Batáry, P., Kleijn, D., 2013. Effects of grazing and biogeographic regions on grassland 426
biodiversity in Hungary – analysing assemblages of 1200 species. Agric. Ecosyst. Environ., 427
Landscape ecology and biodiversity in agricultural landscapes 166, 28–34.
428
https://doi.org/10.1016/j.agee.2012.03.005 429
Bartha, D., Ódor, P., Horváth, T., Tímár, G., Kenderes, K., Standovár, T., Bölöni, J., Szmorad, F., 430
Bodonczi, L., Aszalós, R., 2006. Relationship of tree stand heterogeneity and forest naturalness.
431
Acta Silv. Lignaria Hung. 2.
432
Becking, R.W., 1957. The zürich-montpellier school of phytosociology. Bot. Rev. 23, 411–488.
433
https://doi.org/10.1007/BF02872328 434
Biró, M., Bölöni, J., Molnár, Z., 2018. Use of long-term data to evaluate loss and endangerment status of 435
Natura 2000 habitats and effects of protected areas. Conserv. Biol. 32, 660–671.
436
https://doi.org/10.1111/cobi.13038 437
Biró, M., Révész, A., Molnár, Zs., Horváth, F., Czúcz, B., 2008. Regional habitat pattern of the Danube- 438
Tisza Interfluve in Hungary II. Acta Bot. Hung. 50, 19–60.
439
https://doi.org/10.1556/ABot.50.2008.1-2.2 440
Biró, M., Szitár, K., Horváth, F., Bagi, I., Molnár, Z., 2013. Detection of long-term landscape changes and 441
trajectories in a Pannonian sand region: comparing land-cover and habitat-based approaches at 442
two spatial scales. Community Ecol. 14, 219–230.
443
Bölöni, J., Molnár, Z., Kun, A. (Eds.), 2011. Magyarország élőhelyei. A hazai vegetációtípusok leírása és 444
határozója. ÁNÉR 2011. [Habitats of Hungary. A description and guide to Hungarian vegetation]
445
[in Hungarian with English summaries]. MTA ÖBKI.
446
Bölöni, J., Molnár, Zs., Biró, M., Horváth, F., 2008. Distribution of the (semi-)natural habitats in Hungary 447
II. Woodlands and shrublands. Acta Bot. Hung. 50, 107–148.
448
https://doi.org/10.1556/ABot.50.2008.Suppl.6 449
Borhidi, A., 1995. Social behaviour types, the naturalness and relative ecological indicator values of the 450
higher plants in the Hungarian Flora. Acta Bot. Hung. 39, 97–181.
451
Botta-Dukát, Z., 2008. Invasion of alien species to Hungarian (semi-)natural habitats. Acta Bot. Hung. 50, 452
219–227. https://doi.org/10.1556/ABot.50.2008.Suppl.11 453
Butchart, S.H.M., Walpole, M., Collen, B., Strien, A. van, Scharlemann, J.P.W., Almond, R.E.A., Baillie, 454
J.E.M., Bomhard, B., Brown, C., Bruno, J., Carpenter, K.E., Carr, G.M., Chanson, J., Chenery, 455
A.M., Csirke, J., Davidson, N.C., Dentener, F., Foster, M., Galli, A., Galloway, J.N., Genovesi, 456
P., Gregory, R.D., Hockings, M., Kapos, V., Lamarque, J.-F., Leverington, F., Loh, J., McGeoch, 457
M.A., McRae, L., Minasyan, A., Morcillo, M.H., Oldfield, T.E.E., Pauly, D., Quader, S., 458
Revenga, C., Sauer, J.R., Skolnik, B., Spear, D., Stanwell-Smith, D., Stuart, S.N., Symes, A., 459
Tierney, M., Tyrrell, T.D., Vié, J.-C., Watson, R., 2010. Global Biodiversity: Indicators of Recent 460
Declines. Science 328, 1164–1168. https://doi.org/10.1126/science.1187512 461
Canty, A., Ripley, B., 2017. boot: Bootstrap R (S-Plus) functions. R package version 1.3-20.
462
Cardinale, B.J., Duffy, J.E., Gonzalez, A., Hooper, D.U., Perrings, C., Venail, P., Narwani, A., Mace, 463
G.M., Tilman, D., Wardle, D.A., Kinzig, A.P., Daily, G.C., Loreau, M., Grace, J.B., Larigauderie, 464
A., Srivastava, D.S., Naeem, S., 2012. Biodiversity loss and its impact on humanity. Nature 486, 465
59–67. https://doi.org/10.1038/nature11148 466
Chao, A., Hwang, W.-H., Chen, Y.-C., Kuo, C.-Y., 2000. Estimating the number of shared species in tywo 467
communities. Stat. Sin. 10, 227–246.
468
Chiarucci, A., Bacaro, G., Rocchini, D., Fattorini, L., 2008. Discovering and rediscovering the sample- 469
based rarefaction formula in the ecological literature. Community Ecol. 9, 121–123.
470
https://doi.org/10.1556/ComEc.9.2008.1.14 471
Clavel, J., Julliard, R., Devictor, V., 2011. Worldwide decline of specialist species: toward a global 472
functional homogenization? Front. Ecol. Environ. 9, 222–228. https://doi.org/10.1890/080216 473
Colwell, R.K., Coddington, J.A., 1994. Estimating terrestrial biodiversity through extrapolation. Phil 474
Trans Roy Soc Lond. B 345, 101–118.
475
Colwell, R.K., Mao, C.X., Chang, J., 2004. Interpolating, extrapolating, and comparing incidence-based 476
species accumulation curves. Ecology 85, 2717–2727. https://doi.org/10.1890/03-0557 477
Csaba, T., Zoltán, B., László, E., Róbert, G., László, K., 2015. Plant diversity patterns of a Hungarian 478
steppe-wetland mosaic in relation to grazing regime and land use history. Tuexenia 35, 399–416.
479
https://doi.org/10.14471/2015.35.006 480
Csecserits, A., Czúcz, B., Halassy, M., Kröel-Dulay, G., Rédei, T., Szabó, R., Szitár, K., TöröK, K., 2011.
481
Regeneration of sandy old-fields in the forest steppe region of Hungary. Plant Biosyst. 145, 715–
482
729. https://doi.org/10.1080/11263504.2011.601340 483
Csontos, P., Halbritter, A., Tamás, J., Szili-Kovács, T., Kalapos, T., Uzinger, N., Anton, A., 2012.
484
Afforestation of dolomite grasslands with nonnative Pinus nigra in Hungary and its effect on soil 485
trace elements. Appl. Ecol. Environ. Res. 10, 405–415.
486
Czúcz, B., Molnár, Zs., Horváth, F., Botta-Dukát, Z., 2008. The natural capital index of Hungary. Acta 487
Bot. Hung. 50, 161–177. https://doi.org/10.1556/ABot.50.2008.Suppl.8 488
Deák, B., Valkó, O., Alexander, C., Mücke, W., Kania, A., Tamás, J., Heilmeier, H., 2014. Fine-scale 489
vertical position as an indicator of vegetation in alkali grasslands – Case study based on remotely 490
sensed data. Flora - Morphol. Distrib. Funct. Ecol. Plants 209, 693–697.
491
https://doi.org/10.1016/j.flora.2014.09.005 492
Deák, B., Valkó, O., Török, P., Tóthmérész, B., 2016. Factors threatening grassland specialist plants - A 493
multi-proxy study on the vegetation of isolated grasslands. Biol. Conserv. 204, 255–262.
494
https://doi.org/10.1016/j.biocon.2016.10.023 495
Debreczy, Z., 1987. Fluctuating-dynamic equilibrium of photophil, xerophil rupicolous plant communities 496
and scrub woods at the lower arid woodland limit. Ann. Hist.-Nat. Musei Natl. Hung. - 497
Termeszettudomanyi Muz. Evkonyve.
498
Dengler, J., Janišová, M., Török, P., Wellstein, C., 2014. Biodiversity of Palaearctic grasslands: A 499
synthesis. Agric. Ecosyst. Environ. 182, 1–14. https://doi.org/10.1016/j.agee.2013.12.015 500
Erdős, L., Tölgyesi, Cs., Horzse, M., Tolnay, D., Hurton, Á., Schulcz, N., Körmöczi, L., Lengyel, A., 501
Bátori, Z., 2014. Habitat complexity of the Pannonian forest-steppe zone and its nature 502
conservation implications. Ecol. Complex. 17, 107–118.
503
https://doi.org/10.1016/j.ecocom.2013.11.004 504
Foley, J.A., DeFries, R., Asner, G.P., Barford, C., Bonan, G., Carpenter, S.R., Chapin, F.S., Coe, M.T., 505
Daily, G.C., Gibbs, H.K., others, 2005. Global consequences of land use. science 309, 570–574.
506
Gotelli, N.J., Colwell, R.K., 2001. Quantifying biodiversity: procedures and pitfalls in the measurement 507
and comparison of species richness. Ecol. Lett. 4, 379–391. https://doi.org/10.1046/j.1461- 508
0248.2001.00230.x 509
Hannah, L., Carr, J.L., Lankerani, A., 1995. Human disturbance and natural habitat: a biome level analysis 510
of a global data set. Biodivers. Conserv. 4, 128–155. https://doi.org/10.1007/BF00137781 511
Hoekstra, J.M., Boucher, T.M., Ricketts, T.H., Roberts, C., 2005. Confronting a biome crisis: global 512
disparities of habitat loss and protection. Ecol. Lett. 8, 23–29. https://doi.org/10.1111/j.1461- 513
0248.2004.00686.x 514
Hudson, L.N., Newbold, T., Contu, S., Hill, S.L.L., Lysenko, I., Palma, A.D., Phillips, H.R.P., Senior, 515
R.A., Bennett, D.J., Booth, H., Choimes, A., Correia, D.L.P., Day, J., Echeverría‐Londoño, S., 516
Garon, M., Harrison, M.L.K., Ingram, D.J., Jung, M., Kemp, V., Kirkpatrick, L., Martin, C.D., 517
Pan, Y., White, H.J., Aben, J., Abrahamczyk, S., Adum, G.B., Aguilar‐Barquero, V., Aizen, M.A., 518
Ancrenaz, M., Arbeláez‐Cortés, E., Armbrecht, I., Azhar, B., Azpiroz, A.B., Baeten, L., Báldi, A., 519
Banks, J.E., Barlow, J., Batáry, P., Bates, A.J., Bayne, E.M., Beja, P., Berg, Å., Berry, N.J., 520
Bicknell, J.E., Bihn, J.H., Böhning‐Gaese, K., Boekhout, T., Boutin, C., Bouyer, J., Brearley, 521
F.Q., Brito, I., Brunet, J., Buczkowski, G., Buscardo, E., Cabra‐García, J., Calviño‐Cancela, M., 522
Cameron, S.A., Cancello, E.M., Carrijo, T.F., Carvalho, A.L., Castro, H., Castro‐Luna, A.A., 523
Cerda, R., Cerezo, A., Chauvat, M., Clarke, F.M., Cleary, D.F.R., Connop, S.P., D’Aniello, B., 524
Silva, P.G. da, Darvill, B., Dauber, J., Dejean, A., Diekötter, T., Dominguez‐Haydar, Y., 525
Dormann, C.F., Dumont, B., Dures, S.G., Dynesius, M., Edenius, L., Elek, Z., Entling, M.H., 526
Farwig, N., Fayle, T.M., Felicioli, A., Felton, A.M., Ficetola, G.F., Filgueiras, B.K.C., Fonte, S.J., 527
Fraser, L.H., Fukuda, D., Furlani, D., Ganzhorn, J.U., Garden, J.G., Gheler‐Costa, C., Giordani, 528
P., Giordano, S., Gottschalk, M.S., Goulson, D., Gove, A.D., Grogan, J., Hanley, M.E., Hanson, 529
T., Hashim, N.R., Hawes, J.E., Hébert, C., Helden, A.J., Henden, J.-A., Hernández, L., Herzog, F., 530
Higuera‐Diaz, D., Hilje, B., Horgan, F.G., Horváth, R., Hylander, K., Isaacs‐Cubides, P., Ishitani, 531
M., Jacobs, C.T., Jaramillo, V.J., Jauker, B., Jonsell, M., Jung, T.S., Kapoor, V., Kati, V., 532
Katovai, E., Kessler, M., Knop, E., Kolb, A., Kőrösi, Á., Lachat, T., Lantschner, V., Féon, V.L., 533
LeBuhn, G., Légaré, J.-P., Letcher, S.G., Littlewood, N.A., López‐Quintero, C.A., Louhaichi, M., 534
Lövei, G.L., Lucas‐Borja, M.E., Luja, V.H., Maeto, K., Magura, T., Mallari, N.A., Marin‐Spiotta, 535
E., Marshall, E.J.P., Martínez, E., Mayfield, M.M., Mikusinski, G., Milder, J.C., Miller, J.R., 536
Morales, C.L., Muchane, M.N., Muchane, M., Naidoo, R., Nakamura, A., Naoe, S., Nates‐Parra, 537
G., Gutierrez, D.A.N., Neuschulz, E.L., Noreika, N., Norfolk, O., Noriega, J.A., Nöske, N.M., 538
O’Dea, N., Oduro, W., Ofori‐Boateng, C., Oke, C.O., Osgathorpe, L.M., Paritsis, J., Parra‐H, A., 539
Pelegrin, N., Peres, C.A., Persson, A.S., Petanidou, T., Phalan, B., Philips, T.K., Poveda, K., 540
Power, E.F., Presley, S.J., Proença, V., Quaranta, M., Quintero, C., Redpath‐Downing, N.A., 541
Reid, J.L., Reis, Y.T., Ribeiro, D.B., Richardson, B.A., Richardson, M.J., Robles, C.A., Römbke, 542
J., Romero‐Duque, L.P., Rosselli, L., Rossiter, S.J., Roulston, T.H., Rousseau, L., Sadler, J.P., 543
Sáfián, S., Saldaña‐Vázquez, R.A., Samnegård, U., Schüepp, C., Schweiger, O., Sedlock, J.L., 544
Shahabuddin, G., Sheil, D., Silva, F.A.B., Slade, E.M., Smith‐Pardo, A.H., Sodhi, N.S., 545
Somarriba, E.J., Sosa, R.A., Stout, J.C., Struebig, M.J., Sung, Y.-H., Threlfall, C.G., Tonietto, R., 546
Tóthmérész, B., Tscharntke, T., Turner, E.C., Tylianakis, J.M., Vanbergen, A.J., Vassilev, K., 547
Verboven, H.A.F., Vergara, C.H., Vergara, P.M., Verhulst, J., Walker, T.R., Wang, Y., Watling, 548
J.I., Wells, K., Williams, C.D., Willig, M.R., Woinarski, J.C.Z., Wolf, J.H.D., Woodcock, B.A., 549
Yu, D.W., Zaitsev, A.S., Collen, B., Ewers, R.M., Mace, G.M., Purves, D.W., Scharlemann, 550
J.P.W., Purvis, A., 2014. The PREDICTS database: a global database of how local terrestrial 551
biodiversity responds to human impacts. Ecol. Evol. 4, 4701–4735.
552
https://doi.org/10.1002/ece3.1303 553
Illyés, E., Bölöni, J. (Eds.), 2007. Slope steppes, loess steppes and forest steppe meadows in Hungary.
554
Jost, L., 2007. Partitioning Diversity into Independent Alpha and Beta Components. Ecology 88, 2427–
555
2439. https://doi.org/10.1890/06-1736.1 556
Kertész, M., Szabó, J., Altbäcker, V., 1993. The Bugac Rabbit Project. Part I. Description of the study site 557
and vegetation map. Abstr. Bot. 17, 187–196.
558
Kocsis, K. (Ed.), 2018. National Atlas of Hungary: Natural environment. Magyar Tudományos Akadémia, 559
Budapest.
560
Ladányi, Z., Blanka, V., Deák, Á.J., Rakonczai, J., Mezősi, G., 2016. Assessment of soil and vegetation 561
changes due to hydrologically driven desalinization process in an alkaline wetland, Hungary.
562
Ecol. Complex. 25, 1–10. https://doi.org/10.1016/j.ecocom.2015.11.002 563
Lett, B., Gál, J., Stark, M., Frank, N., 2016. Development and Possibilities for Close-to-Nature Forest 564
Resource Management in Hungary. Acta Silv. Lignaria Hung. 12, 55–74.
565
https://doi.org/10.1515/aslh-2016-0006 566
Lindenmayer, D.B., Franklin, J.F., Fischer, J., 2006. General management principles and a checklist of 567
strategies to guide forest biodiversity conservation. Biol. Conserv. 131, 433–445.
568
https://doi.org/10.1016/j.biocon.2006.02.019 569
Mao, C.X., Colwell, R.K., Chang, J., 2005. Estimating the Species Accumulation Curve Using Mixtures.
570
Biometrics 61, 433–441. https://doi.org/10.1111/j.1541-0420.2005.00316.x 571
McGill, B.J., Dornelas, M., Gotelli, N.J., Magurran, A.E., 2015. Fifteen forms of biodiversity trend in the 572
Anthropocene. Trends Ecol. Evol. 30, 104–113. https://doi.org/10.1016/j.tree.2014.11.006 573
Mittermeier, R.A., Mittermeier, C.G., Brooks, T.M., Pilgrim, J.D., Konstant, W.R., Fonseca, G.A.B. da, 574
Kormos, C., 2003. Wilderness and biodiversity conservation. Proc. Natl. Acad. Sci. 100, 10309–
575
10313. https://doi.org/10.1073/pnas.1732458100 576
Mittermeier, R.A., Turner, W.R., Larsen, F.W., Brooks, T.M., Gascon, C., 2011. Global Biodiversity 577
Conservation: The Critical Role of Hotspots. Biodivers. Hotspots 3–22.
578
https://doi.org/10.1007/978-3-642-20992-5_1 579
Molnár, Z., Bartha, S., Seregélyes, T., Illyés, E., Botta-Dukát, Z., Tímár, G., Horváth, F., Révész, A., Kun, 580
A., Bölöni, J., Biró, M., Bodonczi, L., József, Á.D., Fogarasi, P., Horváth, A., Isépy, I., Karas, L., 581
Kecskés, F., Molnár, C., Ajkai, A.O., Rév, S., 2007. A grid-based, satellite-image supported, 582
multi-attributed vegetation mapping method (MÉTA). Folia Geobot. 42, 225–247.
583
https://doi.org/10.1007/BF02806465 584
Molnár, Z., Borhidi, A., 2003. Hungarian alkali vegetation: Origins, landscape history, syntaxonomy, 585
conservation. Phytocoenologia 377–408. https://doi.org/10.1127/0340-269X/2003/0033-0377 586
Molnár, Zs., Biró, M., Bartha, S., Fekete, G., 2012. Past Trends, Present State and Future Prospects of 587
Hungarian Forest-Steppes, in: Werger, M.J.A., van Staalduinen, M.A. (Eds.), Eurasian Steppes.
588
Ecological Problems and Livelihoods in a Changing World, Plant and Vegetation. Springer 589
Netherlands, Dordrecht, pp. 209–252. https://doi.org/10.1007/978-94-007-3886-7_7 590
Molnár, Zs., Biró, M., Bölöni, J., Horváth, F., 2008. Distribution of the (semi-)natural habitats in Hungary 591
I. Marshes and grasslands. Acta Bot. Hung. 50, 59–105.
592
https://doi.org/10.1556/ABot.50.2008.Suppl.5 593
Naaf, T., Wulf, M., 2010. Habitat specialists and generalists drive homogenization and differentiation of 594
temperate forest plant communities at the regional scale. Biol. Conserv. 143, 848–855.
595
https://doi.org/10.1016/j.biocon.2009.12.027 596
Newbold, T., Hudson, L.N., Hill, S.L.L., Contu, S., Lysenko, I., Senior, R.A., Börger, L., Bennett, D.J., 597
Choimes, A., Collen, B., Day, J., De Palma, A., Díaz, S., Echeverria-Londoño, S., Edgar, M.J., 598
Feldman, A., Garon, M., Harrison, M.L.K., Alhusseini, T., Ingram, D.J., Itescu, Y., Kattge, J., 599
Kemp, V., Kirkpatrick, L., Kleyer, M., Correia, D.L.P., Martin, C.D., Meiri, S., Novosolov, M., 600
Pan, Y., Phillips, H.R.P., Purves, D.W., Robinson, A., Simpson, J., Tuck, S.L., Weiher, E., White, 601
H.J., Ewers, R.M., Mace, G.M., Scharlemann, J.P.W., Purvis, A., 2015. Global effects of land use 602
on local terrestrial biodiversity. Nature 520, 45.
603
Ödman, A.M., Schnoor, T.K., Ripa, J., Olsson, P.A., 2012. Soil disturbance as a restoration measure in 604
dry sandy grasslands. Biodivers. Conserv. 21, 1921–1935. https://doi.org/10.1007/s10531-012- 605
0292-4 606
Paillet, Y., Bergès, L., Hjältén, J., Ódor, P., Avon, C., Bernhardt‐Römermann, M., Bijlsma, R.-J., Bruyn, 607
L.D., Fuhr, M., Grandin, U., Kanka, R., Lundin, L., Luque, S., Magura, T., Matesanz, S., 608
Mészáros, I., Sebastià, M.-T., Schmidt, W., Standovár, T., Tóthmérész, B., Uotila, A., Valladares, 609
F., Vellak, K., Virtanen, R., 2010. Biodiversity Differences between Managed and Unmanaged 610
Forests: Meta-Analysis of Species Richness in Europe. Conserv. Biol. 24, 101–112.
611
https://doi.org/10.1111/j.1523-1739.2009.01399.x 612
Palang, H., Printsmann, A., Gyuró, É.K., Urbanc, M., Skowronek, E., Woloszyn, W., 2006. The forgotten 613
rural landscapes of Central and Eastern Europe. Landsc. Ecol. 21, 347–357.
614
Palmer, M.W., 1990. The estimation of species richness by extrapolation. Ecology 71, 1195–1198.
615
R Core Team, 2019. R: A language and environment for statistical computing. R Foundation for Statistical 616
Computing.
617
Rédei, T., Csecserits, A., Lhotsky, B., Barabás, S., Kröel-Dulay, G., Ónodi, G., Botta-Dukát, Z., 2020.
618
Plantation forests cannot support the richness of forest specialist plants in the forest-steppe zone.
619
For. Ecol. Manag. 461, 117964. https://doi.org/10.1016/j.foreco.2020.117964 620
Rédei, T., Szitár, K., Czúcz, B., Barabás, S., Lellei-Kovács, E., Pándi, I., Somay, L., Csecserits, A., 2014.
621
Weak evidence of long-term extinction debt in Pannonian dry sand grasslands. Agric. Ecosyst.
622
Environ. 182, 137–143.
623
Rosenzweig, M.L., 1995. Species diversity in space and time. Cambridge University Press.
624
Schweitzer, F., 2009. Strategy or disaster. Flood prevention related issues and actions in the Tisza River 625
basin. Hung. Geogr. Bull. 58, 3–17.
626
Shi, J., Ma, K., Wang, J., Zhao, J., He, K., 2010. Vascular plant species richness on wetland remnants is 627
determined by both area and habitat heterogeneity. Biodivers. Conserv. 19, 1279–1295.
628
https://doi.org/10.1007/s10531-009-9757-5 629
Simon, T., 2000. A magyarországi edényes flóra határozója [Identification hand-book of the Hungarian 630
vascular plants]. Nemzeti Tankönyvkiadó.
631
Somodi, I., Virágh, K., Aszalós, R., 2004. The effect of the abandonment of grazing on the mosaic of 632
vegetation patches in a temperate grassland area in Hungary. Ecol. Complex. 1, 177–189.
633
https://doi.org/10.1016/j.ecocom.2004.03.001 634
Standovár, T., Ódor, P., Aszalós, R., Gálhidy, L., 2006. Sensitivity of ground layer vegetation diversity 635
descriptors in indicating forest naturalness. Community Ecol. 7, 199–209.
636
https://doi.org/10.1556/ComEc.7.2006.2.7 637
Szitár, K., Ónodi, G., Somay, L., Pándi, I., Kucs, P., Kröel-Dulay, G., 2014. Recovery of inland sand dune 638
grasslands following the removal of alien pine plantation. Biol. Conserv. 171, 52–60.
639
https://doi.org/10.1016/j.biocon.2014.01.021 640
Török, P., Kapocsi, I., Deák, B., 2012. Conservation and management of alkali grassland biodiversity in 641
Central-Europe, in: Zhang, W.J. (Ed.), Grasslands: Types, Biodiversity and Impacts. Science 642
Publishers Inc, pp. 109–118.
643
Tóth, T., Kertész, M., 1993. Mapping the degradation of solonetzic grassland. Agrokém. És Talajt. 42, 644
43–54.
645
Tóth, T., Rajkai, K., 1994. Soil and plant correlations in a solonetzic grassland. Soil Sci. 157, 253–262.
646
Tuomisto, H., 2010. A diversity of beta diversities: straightening up a concept gone awry. Part 1. Defining 647
beta diversity as a function of alpha and gamma diversity. Ecography 33, 2–22.
648
https://doi.org/10.1111/j.1600-0587.2009.05880.x 649
Varga, K., Dévai, G., Tóthmérész, B., 2013. Land use history of a floodplain area during the last 200 years 650
in the Upper-Tisza region (Hungary). Reg. Environ. Change 13, 1109–1118.
651
https://doi.org/10.1007/s10113-013-0424-8 652
Verhoeven, J.T.A., 2014. Wetlands in Europe: Perspectives for restoration of a lost paradise. Ecol. Eng., 653
Wetland Restoration– Challenges and Opportunities 66, 6–9.
654
https://doi.org/10.1016/j.ecoleng.2013.03.006 655
Wallenius, T., Niskanen, L., Virtanen, T., Hottola, J., Brumelis, G., Angervuori, A., Julkunen, J., 656
Pihlström, M., 2010. Loss of habitats, naturalness and species diversity in Eurasian forest 657
landscapes. Ecol. Indic. 10, 1093–1101. https://doi.org/10.1016/j.ecolind.2010.03.006 658
Werger, M.J.A., van Staalduinen, M.A. (Eds.), 2012. Eurasian Steppes. Ecological Problems and 659
Livelihoods in a Changing World, Plant and Vegetation. Springer Netherlands, Dordrecht.
660
https://doi.org/10.1007/978-94-007-3886-7_7 661
Zólyomi, B., 1989. Magyarország természetes növénytakarója [Map of the natural vegetation of Hungary], 662
in: Nemzeti Atlasz [Atlas of Hungary]. Kartográfiai Vállalat, Budapest, p. 89.
663
Zólyomi, B., 1958. Budapest és környéke természetes növénytakarója. [Flora and vegetation of Budapest 664
and its environs], in: Pécsi, M. (Ed.), Budapest természeti képe. Akadémiai Kiadó, Budapest, pp.
665
509–642.
666 667