Waterborne Phytophthora Species Occurrence and Diversity in the Valley of the Rák Brook
Judit S
ÁRÁNDI-K
OVÁCS*– Ilona S
ZABÓ– Ferenc L
AKATOSa Institute of Silviculture and Forest Protection, University of Sopron, Hungary
Abstract– This paper reports on a two-year monitoring of Phytophthora species occurring in the catchment area of the Rák Brook near Sopron. P. gonapodyides, P. lacustris, P. plurivora and P. pseudosyringae were found in the course of surveys completed in the vegetation period of 2011 and 2012. Diversity profiles and cluster analysis were calculated in order to compare the Phytophthora communities detected at different sites and times. Seasonal differences were observed in the species compositions. Temperature data and basic hydrological parameters were found to determine the presence or absence of waterborne Phytophthoraspecies in the catchment area of the Rák Brook. Pathogenicity of the Phytophthora species discovered was confirmed and evaluated against sessile oak seedlings.
waterborne Phytophthora / monitoring / plant pathogen / catchment area
Kivonat –PhytophthoraIDMRNHOĘIRUGXOiVDpVGLYHU]LWiVDD5iN-SDWDNYt]J\ĦMWĘMpQA tanulmány egy Sopron környékén, a Rák-SDWDN Yt]J\ĦMWĘMpQ NLYLWHOH]HWW NpW pYHV PRQLWRULQJ HUHGPpQ\HLUĘO WXGyVtW$PRQLWRULQJFpOMDDYt]EHQpOĘPhytophthorafajok felmérése volt. A 2011 és 2012 vegetációs LGĘV]DNEDQ NLYLWHOH]HWW IHOPpUpVHN VRUiQ QpJ\ IDMW VLNHUOW NLPXWDWQXQN P. gonapodyides-t, P. lacustris-t, P. plurivora-t és P. pseudosyringae-t $] HJ\HV PLQWDYpWHOL LGĘV]DNRNEDQ WDOiOW Phytophthoraközösségeket diverzitásrendezés és klaszteranalízis segítségével hasonlítottuk össze. Az HJ\HV LGĘV]DNRN VRUiQ WDSDV]WDOW IDMNpV]OHtekben szezonális változásokat figyeltünk meg.
0HJiOODStWRWWXN KRJ\ D IDMRN HOĘIRUGXOiViW OHJLQNiEE D KĘPpUVpNOHWL YLV]RQ\RN pV DODSYHWĘ hidrológiai paraméterek befolyásolták. A talált Phytophthora fajok kocsánytalan tölgy csemetékkel szembeni patogenitását igazoltuk és a fajok aggresszivitását értékeltük.
Yt]L3K\WRSKWKRUDPRQLWRULQJNyURNR]yYt]J\ĦMWĘWHUOHW
1 INTRODUCTION
The rapidly growing number of invasive species is an important ecological and economic problem. The greatest number of invasive plant pathogen species in Europe currently belongs to the Oomycetesfollowed by the Ascomycetes (Santini et al. 2012). The number of species in these two groups is three times higher than in the 1980s. The invasive species of the genus Phytophthora (phylum Oomycota) endanger the ecological and economic sustainability of forests around the world (Hansen 2008), including Europe (Jung al. 2015), and Hungary (Szabó et al. 2013). These species require water to reproduce and spread. Watercourses play a key role in the spread of Phytophthoras (Ghimire et al. 2009, Erwin ԟ Ribeiro 1996). New infections may occur during flood events (Strnadová et al. 2010).
*Corresponding author: sarandi-kovacs.judit@uni-sopron.hu; H-9400 SOPRON, Bajcsy-Zs. u. 4, Hungary
European and North-American studies show that Phytophthora species are abundant in forest streams and rivers (Hansen ԟ Delatour 1999; Reeser et al. 2011). Watercourse monitoring can help track the spread of invasive Phytophthoras and improve the early detection of these pathogens (Reeser et al. 2011). Early detection could enable timely plant protection actions, which may help prevent enhanced habitat loss. Stream baiting or water filtering methods are monitoring techniques that are frequently used to detect Phytophthora species worldwide (Hansen ԟ Delatour 1999; Tjosvold et al. 2008; Hulvey ԟ Gobena 2010;
Reeser et al. 2011; Hüberli et al. 2013). However, inoculum dilutes in streams and rivers, which poses a challenge for detection methods. In the case of water filtering, the higher amount of water used may lead to more accurate results, while in the case of stream baiting, the plant species used as bait and baiting duration can help to improve accuracy.
Though North American studies have shown that water filtration may capture a greater number of taxa (Hulvey et al. 2010, Brazee et al. 2016), baiting is a cheaper and more frequently used method to investigate streams. Monitoring selected watercourses may reflect the occurrence of Phytophthoraspecies over the watershed (Hwang et al. 2007). Furthermore, rivers might serve as a dispersal source for Phytophthora species, putting ecosystems at risk through flooding (Brazee et al. 2016).
During the study period, our main goals were to obtain information about the occurring Phytophthora species, investigate the health condition of forest stands along the Rák Brook near Sopron – with special emphasis on the symptoms of potential Phytophthora infection – and test the stream baiting method for forest protection purposes.
Forests potentially cover the entire Sopron Mountains area. Beech (Fagus sylvatica) forests cover the higher regions, and sessile oak (Quercus petraea) forests mixed with hornbeam (Carpinus betulus) exist in the eastern part. Planted coniferous forests currently cover more than 50% of the entire Sopron Mountains area. (Király 2008) Common alder (Alnus glutinosa) is the dominant tree species in the bottom part of the catchment area (Gribovszki et al. 2006). A. glutinosa is the dominant tree species in the riparian alder galleries, but the stands are mixed with common ash (Fraxinus excelsior) (Szmorad 2011).
Walnut (Juglans regia) occurs in the lower valley sections (Szmorad 2011).
With a total length of 14.8 km, of which 10 km winds through forested area, the Rák Brook is one of the largest watercourses in the Sopron Mountains. Its water catchment area is approximately 36.8 km2 in the northern part of the Sopron Mountains (Dövényi 2010).
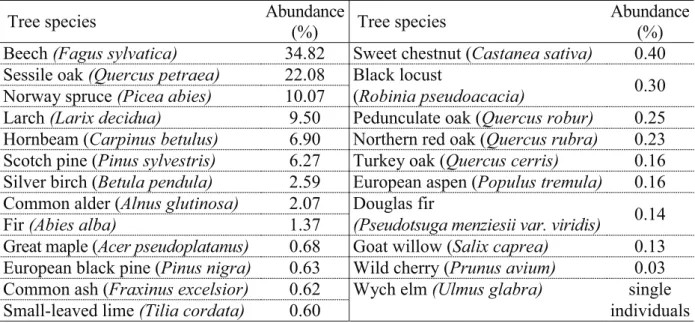
Table 1 summarizes the main tree species of the catchment area according to the National Forest Database (National Food Chain Safety Office, Forestry Directorate).
Earlier, P. quercina, P. cactorum, P. plurivora, P. europaea, P. uliginosa, P. psychrophila, P. citricola, P. gonapodyides, P. syringae, P. megasperma were the Phytophthora species most frequently isolated from Central European sessile oak and pedunculate oak (Quercus robur) stands (Jung et al. 2000, 2002, Balci Halmschlager 2003, Tkaczyk et al. 2017).
According to Bavarian and Polish data, the main Phytophthora species causing decline in Central European beech stands are P. cambivora, P. syringae, P. pseudosyringae and P. citricola (P. plurivora,Orlikowski et al. 2016). In Rohrbach, near the Austrian-Hungarian border next to Sopron, P. quercina was observed in the rhizosphere of declining sessile oaks in 2000 (Balci Halmschlager 2003). A few years later, in 2003, 2005 and 2009, P. gonapodyides, P. multivora and P. plurivora were isolated from the rhizosphere of declining pedunculate oak, sessile oak, and Turkey oak (Quercus cerris) trees (Szabó et al.
2013) on the Hungarian side of the Sopron Mountains. Szabó et al. (2013) isolated P. plurivora and P. gonapodyides from the rhizosphere soil of declining riparian alder trees
Table 1. Tree species on the sampled water catchment area (abundance in percentage of the area).
Tree species Abundance
(%) Tree species Abundance
(%) Beech(Fagus sylvatica) 34.82 Sweet chestnut (Castanea sativa) 0.40 Sessile oak(Quercus petraea) 22.08 Black locust
Norway spruce(Picea abies) 10.07 (Robinia pseudoacacia) 0.30
Larch(Larix decidua) 9.50 Pedunculate oak (Quercus robur) 0.25 Hornbeam (Carpinus betulus) 6.90 Northern red oak (Quercus rubra) 0.23 Scotch pine (Pinus sylvestris) 6.27 Turkey oak (Quercus cerris) 0.16 Silver birch (Betula pendula) 2.59 European aspen (Populus tremula) 0.16 Common alder (Alnus glutinosa) 2.07 Douglas fir
Fir(Abies alba) 1.37 (Pseudotsuga menziesii var. viridis) 0.14
Great maple (Acer pseudoplatanus) 0.68 Goat willow (Salix caprea) 0.13 European black pine (Pinus nigra) 0.63 Wild cherry (Prunus avium) 0.03 Common ash (Fraxinus excelsior) 0.62 Wych elm (Ulmus glabra) single
Small-leaved lime(Tilia cordata) 0.60 individuals
Source: National Forest Database, National Food Chain Safety Office Forestry Directorate
Weather condition and water quality data were also collected to secure information about the ecological parameters affecting the occurrence of different Phytophthoraspecies.
This paper aims to interpret data collected during a two-year monitoring in an approximately 3,680 ha large catchment area covered by various tree species along the Rák Brook near Sopron in western Hungary. We assessed the ecological impact of Phytophthora species in this location, highlighting a potential threat to sessile oak, beech, and common alder stands.
Interest in estimating forest biomass for practical and scientific purposes is currently increasing. There are different approaches to calculate biomass and carbon stocks in forests, with most based on forest inventory information as well as on biomass equations, which transform diameter, height or volume data into biomass estimates (Somogyi et al. 2006).
Biomass calculations can be obtained by direct and indirect methods. The direct method involves destructive biomass weighing, whereas in the indirect method, regression modelling is used to estimate biomass and carbon stocks from more easily measured tree and stand variables such as diameter at breast height (DBH), tree height (H) and tree age (A). Tree-level variables facilitate the development of biomass equations that are applicable to a wider range of sites and stands and can be used to examine the effects of various factors on stand growth and biomass stocking. The ability of allometric equations to predict aboveground biomass and carbon stocking is not only a matter of statistical tools. The errors made throughout the process of formulating these equations – from the fieldwork and modelling to biomass prediction – should be considered (Picard et al. 2012).
Chave et al. (2005) and Brown et al. (1989) pointed out that errors are caused by various sources such as tree measurement, plot sampling, insufficient number of big trees sampled, diameter intervals, selection of average sample trees in each diameter class, and application of unsuitable models. In addition, accuracy and reliability of biomass models should be assessed not only for individual trees, but also for forest stands taking into account the distribution of trees by diameter classes (Ketterings et al. 2001).
In Albania, information on aboveground biomass and carbon stocking is scarce and relevant estimation methods are not very well known. In contrast, information regarding biomass estimation is more plentiful in other Mediterranean countries. From the review of the
studies conducted in Albania, we found one study that provides data on biomass and carbon stocking at national level (Agrotec 2004) and two other studies focused on aboveground biomass estimation for some species growing in natural (Omuri 2006) and artificial stands (Toromani et al. 2011). The first study regarding biomass estimation at the country level was conducted in the framework of National Forest Inventory (Agrotec 2004). Biomass was calculated from the inventoried stand volume per hectare where this value was expanded into aboveground components using biomass expansion factor (BEFs). Due to the lack of information on specific BEFs for Albanian forests, data from other studies was used (Louitat et al. 2000, Lowe et al. 2000, Schulze 2000). Omuri (2006) executed the second research study on forest biomass and BEFs and developed several models to estimate biomass. He determined the BEFs for Austrian pine (P. nigra Arn.), Beech (F. sylvatica L.) and Birch (B. pendulaL.) and pointed out that BEFs values vary due to species and age. Thus, in the case of birch, the BEF was 2.1 for the 10 to 20-year age range, 1.4 for Austrian pine in the 20 to 30-year age range and, and 2.3 for beech in 10 to 20-year age range. The third study was conducted by Toromani et al. (2011) in some poplar plantations situated in eastern and central Albania where several allometric equations using tree variables (DBH; squared DBH; H; A) as predictors were developed.
Despite the limited number of published equations, many other forest species growing in Albania are not well represented. Turkey oak (Quercus cerris) is one of the species lacking biomass-related information. Undoubtedly one of Albania’s most important forest species, covering more than 30.8% of the total forest area, Turkey oak grows in Haplic and Chromic Luvisol soil here, in a typical, hilly, Mediterranean climate with a considerable summer drought period (FAO2015). The species is widely distributed all over Albania, from hilly lands along the coastal area to the interior of country. Q. cerris is a significant firewood source and is also a fundamental fodder source for wildlife and livestock (mostly sheep and goats). The species also provides habitat for small game species such as Brown hare (Lepus europaeus), Common blackbird (Turdus merula), and Grey partridge (Perdix perdix). No information on the aboveground biomass for Albanian Q. cerris forest stands exists, but other Mediterranean countries possess abundant data. Therefore, the aims of this study were: (1) to estimate aboveground biomass of investigated stands, (2) to define the appropriate allometric models for estimation of aboveground biomass using tree variables, and (3) to estimate biomass expansion factors (BEFs) and their dependency. The present study will contribute quantitative data to the current, generally scarce knowledge of this species.
2 MATERIALS AND METHODS
2.1 Sampling, isolation and species identification
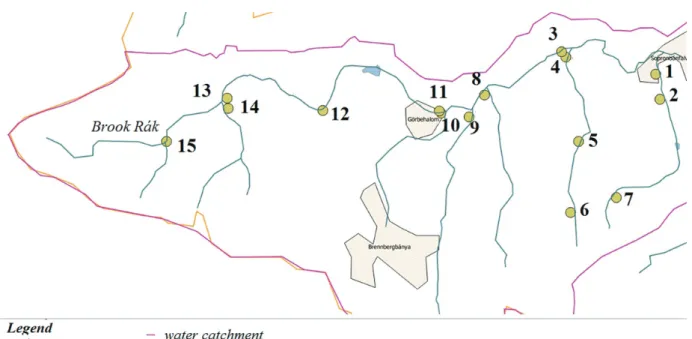
Stream baiting was performed at 18 sampling points (Figure 1). Almost the entire 10-km-long forested part of the brook and a further six small waterways joining the brook were sampled.
Sampled waterways were adjacent to mature deciduous forest stands.
Sampling points were selected near the estuary. We aimed to choose easily accessible sampling points that allowed us to sample areas with diverse tree species composition. Four healthy cherry laurel (Prunus laurocerasus) leaves in a plastic mesh bag were placed onto the water surface as baits. The baits were fixed on the bank and were afloat on the water surface for two days.
Figure 1. The selected sampling points
Sampling was performed five times in 2011 (April, May, July, September, October) and seven times in 2012 (April, May, June, July, August, September, October). We could not do baiting at every sampling point on every sampling date because several water flows ran dry, mainly in summer and autumn, but also in spring 2012. Sometimes baits disappeared or drifted to the bank and dried out. In these cases, baiting was repeated if water depths were adequate for the experiment. Leaf baits were rinsed with distilled water before isolation.
A 5x5 mm piece was cut from the infected leaf sections and put on the surface of Phytophthora selective agar plates. The medium used contained 1.5% malt extract and 2%
bacteriological agar. Ampicillin (250 mg/l), benomyl (15 mg/l) and hymexazol (50 mg/l) were added to the medium before use (Kovács et al. 2013).
Basic hydrological parameters (depth soundings, water pH, and water temperature) were measured at each sampling time in 2012.
2.2 Pathogenicity tests
Pathogenicity tests were completed using one P. plurivora,P. gonapodyides and P. lacustris strain, each of which were collected during the monitoring. Colonies were grown on potato- dextrose agar at 20°C in darkness. The two-year old sessile oak saplings used for the test originated from the local forest nursery. They were planted into plastic containers containing soil tested for Phytophthora species with the leaf baiting method. The soil proved to be free of Phytophthora species before we infected it in May, 2013.
Stem inoculation (seven saplings per strain plus seven uninfected control saplings, altogether 28 saplings) and soil infection (another seven saplings per strain plus seven uninfected control saplings, altogether 28 saplings) tests were carried out. The saplings for the stem inoculation test were planted into a nursery field. Saplings for the soil infection test were planted into 2.5-litre plastic containers. All of the seedlings were watered with tap water as necessary, but were otherwise maintained under natural conditions. Stem inoculation, soil infection, and evaluation of the experiment were completed as earlier described (Sárándi- Kovács et al. 2015). The health condition of the stem-inoculated sapling shoots was evaluated based on a similar five-point scale: 1. Symptomless sapling; 2. Some leaves are smaller than
usual, occasionally with yellowish discolouration; 3. 30–50% of the potential crown is dead;
4. More than 50% of the potential crown is dead; 5. Completely dead saplings (Sárándi- Kovács et al. 2015). Stem diameter and two diameters of the necrosis on the lower stem were measured [mm]. The necrosis area was calculated with the area of ellipse formula [mm2].
With the soil infection test, the health condition of the root system was evaluated based on a five-point scale: 1. Healthy root system; 2. Root loss is below 30%; 3. 30–50% of the root system is lost; 4. Root loss is more than 50%; 5.Completely dead saplings (Sárándi-Kovács et al.
2015). The main root length and the root system diameter was measured. The health condition of the shoots was evaluated based on the five-point scale mentioned above. The re-isolation of Phytophthoraspecies used from the stem lesions and the necrotic root tissues was successful.
2.3 Map constructing and data analysis
Maps were constructed using QGIS 2.18.18 Software (www.qgis.org), based on Google Maps (Google Terrain).
Rarefaction curve and diversity profiles were drawn using PAST 3.19 (Hammer et al.
2001). These profiles were created using 2,000 bootstrap by 95% confidence interval.
Populations were compared with cluster analysis based on the Euclidean similarity index, with the neighbour joining method, and with 10,000 bootstrap.
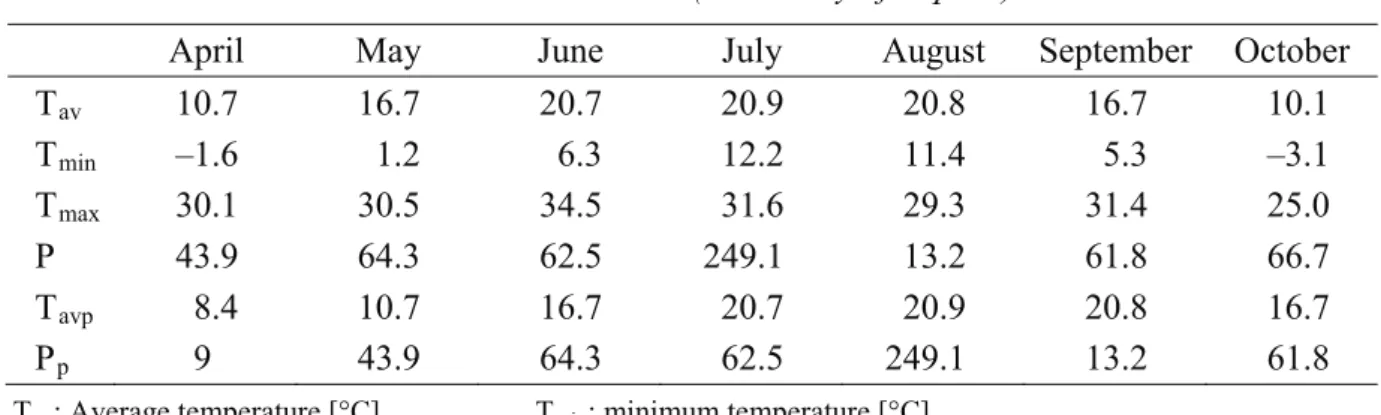
Data collected in 2012 were used to evaluate the effect of environmental factors on Phytophthora species composition. Meteorological data (Table 2) are from the Institute of Environmental and Earth Sciences database (University of Sopron, Hungary); basic hydrological parameters (Table 2) were measured during the sampling times in 2012.
Table 2. Meteorological data of the sampling times in 2012. Source: Institute of Environmental and Earth Sciences (University of Sopron)
April May June July August September October
Tav 10.7 16.7 20.7 20.9 20.8 16.7 10.1
Tmin –1.6 1.2 6.3 12.2 11.4 5.3 –3.1
Tmax 30.1 30.5 34.5 31.6 29.3 31.4 25.0
P 43.9 64.3 62.5 249.1 13.2 61.8 66.7
Tavp 8.4 10.7 16.7 20.7 20.9 20.8 16.7
Pp 9 43.9 64.3 62.5 249.1 13.2 61.8
Tav: Average temperature [°C], Tmin: minimum temperature [°C],
Tmax: maximum temperature [°C], Tavp: average temperature of the previous month [°C], P: precipitation [mm], Pp: precipitation of the previous month [mm]
The following data were used for Spearman’s rs nonparametric correlation in PAST 3.19:
collected Phytophthora species, average monthly temperature, minimum monthly temperature, maximum monthly temperature, average temperature of the previous month, monthly amount of precipitation, monthly amount of precipitation in the previous month, water temperature, soundings, and stream water pH. As described earlier, the data from the pathogenicity tests were evaluated with the STATISTICA Ver. 11 software (Sárándi-Kovács et al. 2015).
3 RESULTS
3.1 Observed symptoms, isolation success and collected species
Tree decline suggesting the presence of Phytophthoraspecies was not observed in the Sopron Mountains during the two-year monitoring period. The number of samplings proved enough to acquire accurate knowledge of the Phytophthoraspecies living in the catchment area based on the rarefaction curve (Figure 2).
Figure 2. Sample rarefaction curve
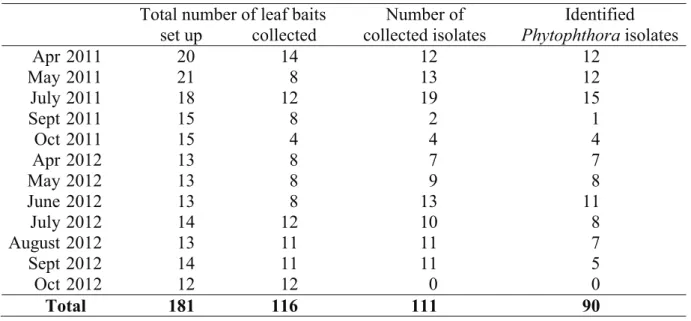
Altogether 111 isolates were collected, but of these, 11 isolates died before identification.
Three isolates belonged to the genus Pythium, 97 to the genus Phytophthora. Seven Phytophthora isolates were unidentifiable at the species level. The remaining 90 isolates belonged to four Phytophthora species: P. gonapodyides, P. lacustris, P. plurivora, and P. pseudosyringae.P. gonapodyides was abundant (48.89% of the total number of identified Phytophthora isolates), especially in spring and early summer. Furthermore, P. lacustris was also abundant (37.78%), while P. plurivora (12.22%) and P. pseudosyringae (1.11%) were isolated only occasionally in the catchment area of the Rák Brook. Table 3 lists the numbers of successful baitings and isolations.
Table 3. Total number of successful baiting and collected isolates Total number of leaf baits Number of
collected isolates
Identified Phytophthoraisolates set up collected
Apr 2011 20 14 12 12
May 2011 21 8 13 12
July 2011 18 12 19 15
Sept 2011 15 8 2 1
Oct 2011 15 4 4 4
Apr 2012 13 8 7 7
May 2012 13 8 9 8
June 2012 13 8 13 11
July 2012 14 12 10 8
August 2012 13 11 11 7
Sept 2012 14 11 11 5
Oct 2012 12 12 0 0
Total 181 116 111 90
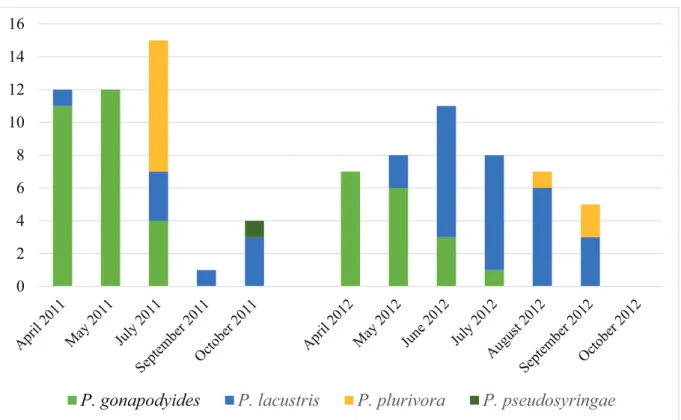
Identification of the collected isolates was based on morphological characteristics and specific molecular markers as described earlier (Kovács et al. 2013). Figure 3 shows the changes of the identified Phytophthora species composition during the two years of the survey.
Figure 3. Number of detected Phytophthora species
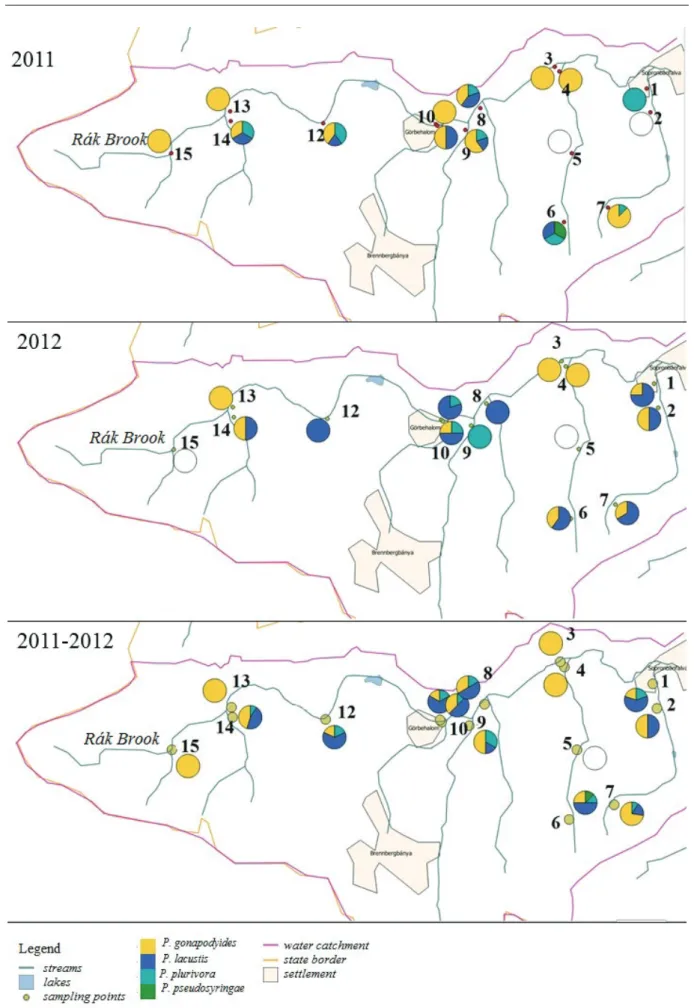
Figure 4 shows the spatial distribution of identified Phytophthoraspecies in 2011, 2012, and the complete database respectively. P. gonapodyides was the most widely distributed species in 2011 at 11 out of 15 sampling points. We could not isolate any Phytophthoras at sampling points 2 and 5. In 2012, P. gonapodyides was dominant only at three out of fifteen sampling points, while P. lacustriswas dominant at seven sampling points. At two sampling points, these to Phytophthoraspecies occurred in 50–50%, respectively. We could not isolate any Phytophthoras at sampling points 5 and 15. Altogether, we did not collect Phytophthora isolates from sampling point 5 during the two years of the survey. However, we had baits back from these sampling points. Only P. gonapodyides could be isolated at sampling points 3, 4, 13, and 15. At nine out of fifteen sampling points, P. gonapodyides, P. lacustris and P. plurivora occurred together, with the dominance of P. gonapodyides or P. lacustris. We could isolate P. pseudosyringaeonly one time at only one sampling point (October 6, 2011.).
0 2 4 6 8 10 12 14 16
P. gonapodyides P. lacustris P. plurivora P. pseudosyringae
Figure 4. Observed species composition at the selected sampling points
3.2 Seasonal changes in the Phytophthoraspecies composition
While P. gonapodyides was abundant in the samples collected in spring and early summer, the samples collected in summer and autumn contained mostly P. lacustris and P. plurivora, and only a few isolates of P. gonapodyidesin July each year (Figure 3). The population found in July 2011 proved to be the most diverse based on the diversity curves. Based on the diversity profiles, there are no significant differences between the Phytophthora communities belonging to different sampling times.
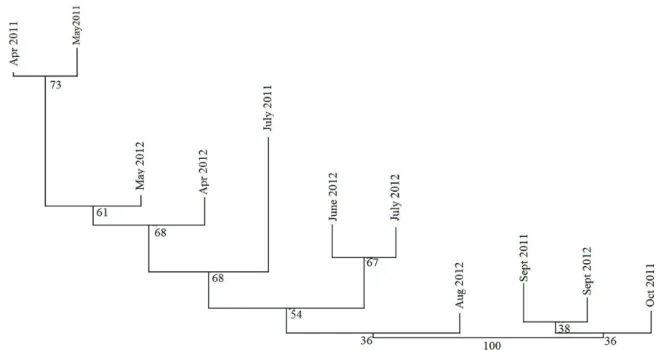
There are two main groups based on the cluster analysis (Figure 5). The three successful autumn sampling times (September and October 2011 and September 2012) are on a separate branch. The Phytophthora communities collected in spring (April and May in 2011 and in 2012) are in a separate group, while the summer dissevers two groups: a group containing samples collected in spring, and another containing communities collected in summer.
This result suggests seasonal changes in the species composition.
Figure 5. Cluster analysis based on the Euclidean index with neighbour joining method, using 10,000 bootstrap.
3.3 Environmental factors affecting the occurrence of Phytophthoraspecies
Table 4 shows the values of measured environmental parameters. Stream water pH was slightly acidic during the survey (pH 5.2ԟ6.8). The water temperature fluctuated between 9 and 18 °C, while the watercourse soundings also fluctuated at each sampling time (Table 5).
Table 4. Measured water parameters in 2012
ID April May June July August Sept. October
R S T R S T R S T R S T R S T R S T R S T
1 6.4 3 5 5.2 3 17 6.4 3 15 6.6 15 17 6.1 3 18 6.1 3 13 6.1 2 15 2 6.6 17 10 6.1 10 13.5 6.4 5 15 6.4 15 15 5.8 12 14 6.1 5 13 6.1 10 13 3 6.8 <1 10 6.1 1 13.5 <6.4 1 13 6.6 1 13 5.2 0.2 14 dried up 6.1 <1 13 4 6.1 6 9 5.5 3 14 6.4 3 15 6.4 12 10 5.8 10 16 5.8 3 13 5.8 3 15 5 6.1 6 9 5.5 3 14 6.4 3 15 6.4 12 10 5.8 10 16 5.8 3 13 5.8 3 15 6 6.1 6 9 5.5 3 14 6.4 3 15 6.4 12 10 5.8 10 16 5.8 3 13 5.8 3 15 7 dried up dried up 6.4 1 15.5 dried up dried up dried up dried up 8 dried up dried up dried up 6.6 8 15 5.8 4 17 dried up dried up 9 6.6 5 11 dried up dried up <6.4 5 16 dried up 5.8 <1 13 dried up 10 6.6 5.7 10 6.7 5 16 6.4 2 17 6.8 15 16 6.1 3 17 5.8 4 13 6.4 10 14 11 6.6 5.7 10 6.7 5 16 6.4 2 17 6.8 15 16 6.1 6 17 5.8 4 13 6.4 10 14 12 6.7 17 10 5.5 10 15 6.4 5 16 6.4 15 15 6.1 12 16 5.8 6 13 6.1 10 13 13 6.8 17 11 5.5 10 16 6.4 5 15 6.4 15 15 6.4 13 17 5.8 7 13 5.8 10 13 14 6.8 17 11 5.5 10 16 6.4 5 15 6.4 15 15 6.4 13 17 5.8 7 13 5.8 10 13 15 6.6 8 11 5.5 7 18 6.4 3 18 6.4 <1 15 6.1 4 17 6.4 3 13 6.1 7 13
R: reaction; S: soundings [cm]; T: temperature [°C]
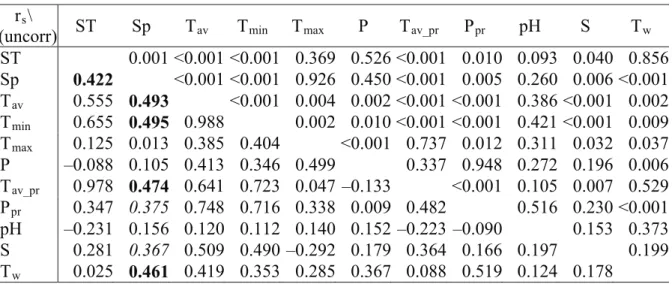
Table 5. Results of the Spearman’s rs nonparametric correlation based on the survey in 2012, without data of unsuccessful isolation, rs values in Italic show weak correlation, rs values in bold suggest moderate correlation
rs\
p(uncorr) ST Sp Tav Tmin Tmax P Tav_pr Ppr pH S Tw
ST 0.001 <0.001 <0.001 0.369 0.526 <0.001 0.010 0.093 0.040 0.856 Sp 0.422 <0.001 <0.001 0.926 0.450 <0.001 0.005 0.260 0.006 <0.001 Tav 0.555 0.493 <0.001 0.004 0.002 <0.001 <0.001 0.386 <0.001 0.002 Tmin 0.655 0.495 0.988 0.002 0.010 <0.001 <0.001 0.421 <0.001 0.009 Tmax 0.125 0.013 0.385 0.404 <0.001 0.737 0.012 0.311 0.032 0.037 P –0.088 0.105 0.413 0.346 0.499 0.337 0.948 0.272 0.196 0.006 Tav_pr 0.978 0.474 0.641 0.723 0.047 –0.133 <0.001 0.105 0.007 0.529 Ppr 0.347 0.375 0.748 0.716 0.338 0.009 0.482 0.516 0.230 <0.001 pH –0.231 0.156 0.120 0.112 0.140 0.152 –0.223 –0.090 0.153 0.373 S 0.281 0.367 0.509 0.490 –0.292 0.179 0.364 0.166 0.197 0.199 Tw 0.025 0.461 0.419 0.353 0.285 0.367 0.088 0.519 0.124 0.178
Abbreviations: ST: sampling time, Sp: species,
Tav: monthly average temperature, Tav_pr: average temperature of the previous month, Tmin: monthly minimum temperature, Tmax: monthly maximum temperature,
P: monthly precipitation, Ppr: monthly precipitation of the previous month.
rs values in Italic show weak correlation, rs values in bold suggest moderate correlation.
3.4 Pathogenicity tests Stem inoculation experiment
Two saplings died (out of 28) during the five months of incubation. Both saplings were infected with P. plurivora.P. plurivoracaused the most severe symptoms (average health condition based on crown symptoms: P. plurivora: 2.14; P. lacustris: 1.42; P. gonapodyides: 1.13; control: 1.00).
Observed symptoms were yellowish discolouration and smaller sized leaves or shrivelling of some leaves.
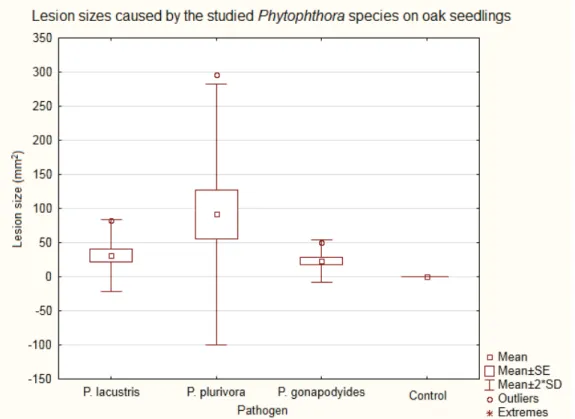
There were significant differences between the lesion sizes (Figure 6) measured in the various treatment groups based on the Kruskal-Wallis test (p=0.0038). All tested Phytophthora species caused considerably bigger lesions than observed in the non-infected controls. P. plurivora caused the biggest lesions (min.: 15.71 mm2; mean: 161.68 mm2; max.: 592.18 mm2; p=0.0061). Smaller lesions were caused by the P. lacustris strain (min.:7.07 mm2; mean: 31.30 mm2; max.: 82.47 mm2; p=0.0061) and the P. gonapodyides strain (min.:3.93 mm2; mean: 22.78 mm2; max.: 50.27 mm2; p=0.0040). P. plurivora caused substantially bigger lesions than P. gonapodyidesdid (p=0.0401).
Mean lesion size on host species ranged between 15.71 and 592.18 mm for P. plurivora, 7.07 and 82.47 mm for P. lacustris, and 3.93 and 50.27 mm for P. gonapodyides.
There were no significant dissimilarities in the different treatment groups based on the health condition of the saplings.
Figure 6. Mean lesion size for each of the four species following treatment with I.) P. lacustris, II.) P. plurivora, III.) P. gonapodyides, and IV.) PDA (control).
Soil infection experiment
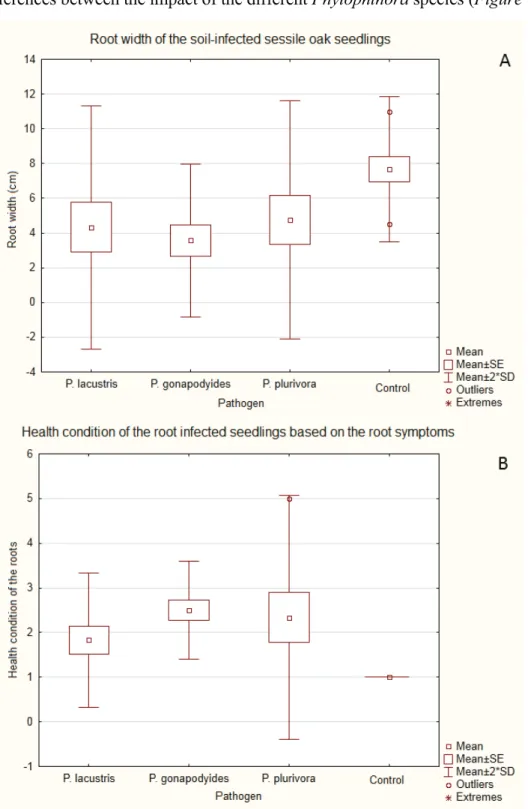
Only one sapling out of 28 died during the five months of the experiment. This sapling was infected with P. plurivora. No crown symptoms were visible on the living saplings. Average sapling health condition based on the root symptoms is presented in Figure 7B.P. plurivoraand P. gonapodyides were the most aggressive while P. lacustris caused less severe symptoms.
There were significant differences in the root width between the different treatment groups based on the result of the One-way ANOVA (p=0.4156). P. lacustris (min.:10.00 mm, mean: 43.30 mm, max.: 100.00 mm; p=0.0444) and P. gonapodyides (min.: 5.00 mm;
significant (min.: 0.00 mm, mean: 47.50 mm, max.: 100.00 mm; p=0.0696). There are no notable differences between the impact of the different Phytophthoraspecies (Figure 7A).
Figure 7. A.: Mean root width of the different treatment groups in case of soil infected seedlings.
B.: Average health condition of the saplings in different treatment groups based on the root symptoms in case of soil infected seedlings.
There were also major dissimilarities between the root condition of the different treatment groups based on the result of the Kruskal-Wallis non-parametric test (p=0.0019). All of the tested Phytophthora species decreased root health conditions based on the results of the Mann-Whitney U-test (P. plurivora-control: p=0.0080; P. gonapodyides-control: p=0.0007;
P. lacustris- control: p=0.0426). There were no noteworthy differences in the impact of the varying Phytophthoraspecies.
4 DISCUSSION
4.1. Observed symptoms, isolation success and identified species composition
Using the stream-baiting method, the number of isolated species would be larger if the sampling site were bigger and contained other vegetation types.
The Phytophthoraspecies found earlier in oak stands and riparian alder gallery forests of the Hungarian part of the Sopron Mountains (Szabó et al. 2013), were re-isolated by the stream baiting method. This confirms that the baiting method used would be convenient for the goals of our survey. Two additional Phytophthora species (P. lacustris and P. pseudosyringae) were found by using the new method. P. lacustris is common in watersheds worldwide, and is a pathogen of common alder stands (Szabó et al. 2013, Sárándi- Kovács et al. 2015), while P. pseudosyringae is a pathogen of common beech stands in Central Europe (Orlikowski et al. 2006) that can infect common alder, too (Marcais Husson 2014). The third most abundant species we found is P. plurivora. This species most likely originates from eastern Asia, and was distributed through Europe and North America in the twentieth century via infected nursery stock (Brazee et al. 2016). P. plurivorahas a wide host range containing ecologically and economically important tree species and is involved in epidemics worldwide (Brazee et al. 2016). However, P. quercina is a frequently isolated Phytophthora species in Central European oak stands, but was not detected in the Sopron Mountains either during the survey of Szabó et al. in 2002–2009, or during the stream baiting experiments in 2011 and 2012.
Clade 6 species, especially P. gonapodyides, abound in streams and rivers worldwide.
Hansen and Delatour (1999) detected abundant P. gonapodyides, occasional P. citricola and P. megasperma as well as two Phytophthora species that were unknown at the time during a nine-month monitoring in French oak forests. Reeser et al. (2011) detected many more Phytophthora species than we did in the rivers of Alaska and Oregon. However, they also observed abundant amounts of P. gonapodyides and P. lacustris. They collected P. plurivora, P. taxon PgChlamydo, P. pseudosyringae and P. cambivora with a lower number from the rivers. Among other species, P. citricola, P. gonapodyides and P. pseudosyringae were present and profuse in North Carolina watersheds (Hwang et al. 2007). Brazee et al. (2016) isolated altogether 457 isolates of 18 Phytophthora species during a two-year survey in Massachusets, USA. P. gonapodyides and P. lacustris were copious in their dataset, too.
We can assume that the collected Phytophthoraspecies of our investigation (P. gonapodyides, P. lacustris, P. plurivora and P. pseudosyringae) are cosmopolitan plant pathogens that they are also present in the rivers of other countries and continents. Even though most waterborne Phytophthora species seem to have a partially saprotrophic lifestyle, all four isolated species are involved in declines or epidemics of woody plants. Their presence in Sopron Highland watersheds could pose a possible hazard to deciduous forest stands. It might also mean that these Phytopthoraspecies are already present in the forest soil of the catchment area.
4.2 Diversity and seasonal changes
While diversity profiles do not significantly distinguish the Phytophthora communities
highest in summer and in autumn, while much lower in winter and in spring. The isolation success was also the highest in the summer in our case. However, due to different climatic conditions, isolation success was much higher in spring than in autumn. Hwang et al. (2007) found the greatest Phytophthora diversity in July in North Carolina streams, while they could isolate only P. gonapodyides in February (Hwang et al. 2007). The most diverse sampling times were also in July and in September in our dataset, while in spring (April and May) P. gonapodyides was abundant and only a few P. lacustris strains could be isolated.
Seasonality as a finding of our study may require further investigation due to the different weather conditions over the two years and the short interval of the experiment.
4.3 The effect of environmental parameters
Temperature data and water quality data (pH, soundings, and water temperature) had a moderate correlation with the observed Phytophthora species composition in 2012.
The amount of monthly precipitation before the baiting and the soundings at the baiting time had only a weak correlation with the Phytophthora species composition, and only when the unsuccessful baitings were excluded.
According Jung et al. (1996), P. gonapodyides requires at least 2–3°C for sporangia formation and zoospore release under artificial conditions, while this value for P. quercinais 5°C, and 5–8°C for P. citricola. These circumstances were fulfilled at every sampling time during our survey. Brazee et al. (2016) showed that Clade 6 species are most plentiful in water at 15–20°C. The above-mentioned findings may explain our results. P. lacustriswas the most abundant species at every sampling time between May 2012 and August 2012 (Figure 4) when water temperature was above 15 °C. At the low water temperature values in April, only P. gonapodyides was isolated, while in September, the most diverse month of 2012, P. plurivora and P. gonapodyides were isolated with the same frequency (28.57% each), and P. lacusrtiswas the most abundant species (42.86% of the collected isolates).
Phytopthora species of oak ecosystems occur in a wide range of pH values (3.4–7.1) according to the studies of Balcí Halmschlager (2003). Jung et al (2000) detected similar, with slightly lower values (3.3–6.63 pH [CaCl2]). They found that P. gonapodyides was the most abundant at pH 3.62–6.02, while P. citricola occurred mostly at pH 3.53–6.63 (Jung et al. 2000). The pH values measured during our survey overlap or are a bit higher in April and May during when P. gonapodyideswas the most abundant species in our collection. However, higher pH values favour Phytophthora species (Erwin Ribeiro 1996). The reaction of the streams concurred with both ranges published by Jung et al. (2000). In spite of this, P. gonapodyidesonly occurred in October, and P. plurivoraand P. lacustrisoccurred in both months.
Based on field observations, precipitation amounts also greatly affect the success of isolation. This is not surprising because Phytophthora species need water for sporangia formation and transportation.
4.4 Pathogenicity
The tested P. gonapodyides, P. lacustris and P. plurivora strains proved to be aggressive against sessile oak seedlings in both the stem inoculation and soil infection experiments.
Forest streams deliver the inoculum of soil borne pathogens, which may cause a decline in oak forests under favourable conditions. The tolerance of oak species against Phytophthoras decreases in later years (Brasier 1996). The trees cannot recover the fine roots they have lost and for this reason weaken. Furthermore, in the case of unfavourable abiotic environmental factors, they become susceptible to secondary pathogens and pests (Hansen Delatour 1999,
Jung et al. 2000). Among other Phytophthoraspecies, P. gonapodyidesis present in European pendunculate oak and sessile oak stands and can infect oak root systems (Jung et al. 2000).
The abundantly isolated species, P. lacustris and P. gonapodyidesare both aggressive to common alder (Alnus glutinosa). According to our previous studies, P. lacustris is slightly less aggressive to alder seedlings than P.alni(Sárándi-Kovács et al. 2015). P. gonapodyides is moderately aggressive to oak and alder seedlings. It causes bigger lesions on common alder seedlings (with an average of 45.61 mm2) than on oak seedlings (average lesion size:
22.78 mm2) (Sárándi-Kovács et al. 2015). Although Phytophthora species like P. gonapodyides, P. pseudosyringae or P. lacustris that we isolated are not responsible for epidemic devastation of common alder stands (Marcais-Husson 2014), they might cause forest stand decline (Szabó et al. 2013). The Phytophthora inoculum transported in the watercourses may also pose a potential threat to riparian alder gallery forests.
5 CONCLUSION
Four Phytophthora species were detected from the studied forest streams during the two-year monitoring period. These species are P. gonapodyides, P. lacustris, P. plurivora and P. pseudosyringae.
Seasonal changes in the diversity of waterborne Phytophthorapopulations seem to exist.
The most diverse populations occurred in June 2011 and September 2012. The less diverse populations dissever into a spring-early summer and into a summer-autumn period. The changes of meteorological and hydrological conditions offer a partial explanation for this.
While soundings and the quantity of precipitation had a substantial impact on the success of isolation, the monthly maximum of air temperature, the water pH, and the monthly amount of precipitation may have a great effect on the occurrence of different species.
The pathogenicity of P. lacustris, P. gonapodyides and P. plurivora isolates collected during the survey were tested through the inoculation of sessile oak saplings. They all proved to be moderately aggressive against the two-year-old saplings in soil infection and stem inoculation experiments. Earlier results showed that P. lacustris and P. gonapodyides are pathogenic against common alder saplings as well (Sárándi-Kovács et al. 2015). These results warn us of a potential threat: sessile oak trees might be infected by Phytophthora species transported in the water of forest streams.
REFERENCES
BALCÍ, Y. – HALMSCHLAGER, E. (2003): Phytophthoraspecies in oak ecosystems in Turkey and their association with declining oak trees. Plant Pathology 52: 694–702.https://doi.org/10.1111/j.1365- 3059.2003.00919.x
BRASIER, C. M. (1996): Phytophthora cinnamomiand oak decline in southern Europe. Environmental constraints including climate change. Annals of Forest Science 53: 347–
358.http://doi.org/10.1051/forest:19960217
BRAZEE, N.J. – WICK, R.L. – HULVEY, J. P. (2016): Phytophthoraspecies recovered from the Connecticut River Valley in Massachusetts, USA. Mycologia 108(1): 6–19.https://doi.org/10.3852/15-038
DÖVÉNYI, Z. (ed. 2010): Inventory of microregions in Hungary. Geographical Institute, Hungarian Academy of Sciences, Budapest.
ERWIN, D.C. – RIBEIRO, O.K. (1996): Phytophthora Diseases Worldwide. St. paul, Minnesota, APS
GHIMIRE, S.R. – RICHARDSON, P.A. – MOORMAN, G.W. – LEA-COX, J.D. – ROSS, D.S. – HONG, C.X.
(2009): An in-situbaiting bioassay for detecting Phytophthoraspecies in irrigation runoff containment basins. Plant Pathology 58 (3): 577–583. http://doi.org/10.1111/j.1365-3059.2008.02016.x
GRIBOVSZKI, Z. – KALICZ, P. – KUCSARA, M. (2006): Characteristics of two forested catchments in the Sopron Hills. Acta Silvatica et Lignaria Hungarica 2:81–92.
HAMMER, Ø. – HARPER, D.A.T. – RYAN, P.D. (2001): PAST: Palaeontological Statistics software package for education and data analysis. Palaeontologia Electronica 4(1): 9.
HANSEN, E. – DELATOUR, C. (1999): Phytophthoraspecies in oak forests of north-east France. Annals of Forest Science 56: 539–547.https://doi.org/10.1051/forest:19990702
HANSEN, E. M. (2008): Alien forest pathogens: Phytophthora species are changing world forests.
Boreal Environment Research 13: 33–41.
HULVEY, J. – GOBENA, D. – FINLEY, L. – LAMOUR, K. (2010): Co-occurrence and genotypic distribution of Phytophthora species recovered from watersheds and plant nurseries of eastern Tennessee Mycologia 102 (5):1127–1133.https://doi.org/10.3852/09-221
HWANG, J. – OAK, S.W. – JEFFERS, S.N. (2007): Detecting Phytophthora ramorumand other species of Phytophthora in streams in natural ecosystems using baiting and filtration methods.
Proceedings of the Sudden Oak Death Third Science Symposim: 55–58.
HÜBERLI, D. – HARDY, G.E.St.J. – WHITE, D. – WILLIAMS, N. – BURGESS, T. (2013): Fishing for Phytophthora from Western Australia's waterways: a distribution and diversity survey.
Australasian Plant Pathology 42: 25–260.https://doi.org/10.1007/s13313-012-0195-6
JUNG, T. – BLASCHKE, H. – NEUMANN, P. (1996): Isolation, identification and pathogenicity of Phytophthoraspecies from declining oak stands. European Journal of Forest Pathology 26: 253–
272.https://doi.org/10.1111/j.1439-0329.1996.tb00846.x
JUNG, T.;BLASCHKE, H.;OSSWALD, W. (2000): Involvement of soilborne Phytophthora species in Central European oak decline and the effect of site factors on the disease. Plant Pathology 49(6):
706–718.
JUNG, T. – ORLIKOWSKI, L. – HENRICOT, B. – ABAD-CAMPOS, P. – ADAY, A. G. – AQUÍN CASAL, O. – BAKONYI, J. – CACCIOLA, S. O. – CECH, T. – CHAVARRIAGA, D. – CORCOBADO, T. – CRAVADOR, A. – NECOURCELLE, T. – DENTON, G. – DIAMANDIS, S. – DOGMUS-LEHTIJÄRVI, H. T. – FRANCESCHINI, A.
– GINETTI, B. – G/$9(1'(.,ý, M. – HANTULA, J. – HARTMANN, G. – HERRERO, M. – IVIC, D. – HORTA JUNG, M. – LILJA, A. – KECA, N. – KRAMARETS, V. – LYUBENOVA, A. – MACHADO, H. – MAGNANO DI SAN LIO, G. – MANSILLA VÁZQUEZ, P. J. – MARCAIS, B. – MATSIAKH, I. – M,/(1.29,ý, I. – MORICCA, S. – NAGY, Z. Á. – NECHWATAL, J. – OLSSON, C. – OSZAKO, T. – PANE, A.
– PAPLOMATAS, E. J. – PINTOS VARELA, C. – PROSPERO, S. – RIAL MARTINEZ, C. – RIGLING, D. – ROBIN, C. – RYTKÖNEN, A. – SÁNCHEZ, M. E. – SCANU, B. – SCHLENZIG, A. – SCHUMACHER, J. – SLAVOV, S. – SOLLA, A. – SONSA, E. – STENLID, J. – TALGØ, V. – TOMIC, Z. – TSOPELAS, P. – VANNINI, A. – VETTRAINO, A. M. – WENNEKER, M. – WOODWARD, S. – PERÉZ, S. – A. (2015):
Widespread Phytophthora infestations in European nurseries put forest, semi-natural and horticultural ecosystems at high risk of Phytophthora diseases. Forest Pathology 46 (2): 134–
163.https://doi.org/10.1111/efp.12239
KIRÁLY, G. (2008): Sopron Mountains. In: KIRÁLY, G. – MOLNÁR, Zs. – BÖLÖNI, J. – CSIKY, J. – VOJTKÓ, A. (ed.): Magyarország földrajzi kistájainak növényzete (Vegetation of the Hungarian microregions). MTA ÖBKI Vácrátót (In Hungarian).
KOVÁCS, J. – LAKATOS, F. – SZABÓ, I. (2013): Occurrence and diversity of soilborne Phytophthoras in a declining black walnut stand in Hungary. Acta Silvatica & Lignaria Hungarica 9: 57–69.
MARÇAIS, B. – HUSSON, C. (Ed. 2014): PhytophthoraonAlnus spp. (alders). JKI Data Sheets - Plant Diseases and Diagnosis. Quedlinburg, Julius Kühn Institut, Bundesforschungsanstalt für Kulturpflanzen.
ORLIKOWSKI, L. B. – OSZAKO, T. – SZKUTA, G. (2006): First record on Phytophthora spp.associated with the decline of European beech stand in south-west Poland. Phytopathologia Polonica 42: 37–46.
REESER, P. W. – SUTTON, W. – HANSEN, E M. – REMIGI, P. – ADAMS, G. C. (2011): Pytophthoraspecies in forest streams in Oregon and Alaska. Mycologia 103 (1): 22–35.https://doi.org/10.3852/10-013 SANTINI, A. – GHELARDINI, L. – DEPACE, C. – DESPREZ-LOUSTAU, M. – CAPRETTI, P. – CHANDELIER,
A. – CECH, Th. L. – CHIRA, D. – DIAMANDIS, S. – GAITNIEKIS, T. – HANTULA, J. – HOLDENRIEDER, O. – JANKOVSKY, L. – JUNG, T. – JURC, D. – KIRISITS, T. – KUNCA, A. – LYGIS, V. – MALECKA, M.
– MARCAIS, B. – SCHMITZ, S. – SCHUMACHER, J. – SOLHEIM, H. – SOLLA, A. – SZABÓ, I. – TSOPELAS, P. – VANNINI, A. – VETTRAINO, A. M. – WEBBER, J. – WOODWARD, S. – STENLID, J.
(2012): Biogeographical patterns and determinants of invasion by forest pathogens in Europe. New Phytologist 197(1): 238–250. https://doi.org/10.1111/j.1469-8137.2012.04364.x
SÁRÁNDI-KOVÁCS, J. – LAKATOS, F. – SZABÓ, I. (2015): Post-epidemic Situation of a Previously Phytophthora alni Infected Common Alder Stand. Acta Silvatica et Lignaria Hungarica 11 (1):
27–38.https://doi.org/10.1515/aslh-2015-0002
STRNADOVÁ, V. – CERNY, K. – HOLUB, V. – GREGOROVÁ, B. (2010): The effects of flooding and Phytophthora alni infection on black alder. Journal of Forest Science 56 (1): 41–
46.https://doi.org/10.17221/67/2009-JFS
SZABÓ, I. – LAKATOS, F. – SIPOS, Gy. (2013):Occurence of soilborne Phytophthora species in declining broadleaved forests in Hungary. European Journal of Plant Pathology 137: 159–
168.https://doi.org/10.1007/s10658-013-0228-1
SZMORAD, F. (2011): The riparian alder forests of the Sopron Hills. Acta Silvatica et Lignaria Hungarica 7: 109–124.
TKACZYK, M. – MILENKOVIC, I. – NOWAKOWSKA, J. A. – BORYS, M. – KALUSKI, T. – GAWLAK, M.
– CZYZ, M. – OSZAKO, T.(2017): Morphological and molecular identification of Phytophthora species isolated from the rhizosphere of declining oak trees in Krotoszyn Plateau. Genetika 49(1):
203–215.https://doi.org/10.2298/GENSR1701203T
TJOSVOLD, S. A. – CHAMBERS, D. L. – KOIKE, S. T. – MORI, S. R. (2008): Disease on Nursery Stock as Affected by Environmental Factors and Seasonal Inoculum Levels of Phytophthora ramorum in Stream Water Used for Irrigation. Plant Disease 92(11): 1566–1573. https://doi.org/10.1094/PDIS-92- 11-1566