land
Article
Monitoring Invasive Plant Species Using Hyperspectral Remote Sensing Data
Levente Papp1 , Boudewijn van Leeuwen1 , Péter Szilassi1,* , Zalán Tobak1 , József Szatmári1 , MátyásÁrvai2, János Mészáros2 and LászlóPásztor2
Citation:Papp, L.; van Leeuwen, B.;
Szilassi, P.; Tobak, Z.; Szatmári, J.;
Árvai, M.; Mészáros, J.; Pásztor, L.
Monitoring Invasive Plant Species Using Hyperspectral Remote Sensing Data.Land2021,10, 29.
https://doi.org/
10.3390/land10010029
Received: 14 December 2020 Accepted: 29 December 2020 Published: 1 January 2021
Publisher’s Note: MDPI stays neu- tral with regard to jurisdictional clai- ms in published maps and institutio- nal affiliations.
Copyright:© 2021 by the authors. Li- censee MDPI, Basel, Switzerland.
This article is an open access article distributed under the terms and con- ditions of the Creative Commons At- tribution (CC BY) license (https://
creativecommons.org/licenses/by/
4.0/).
1 Department of Physical Geography and Geoinformatics, University of Szeged, Egyetem utca 2-6, H-6722 Szeged, Hungary; papp.levente@stud.u-szeged.hu (L.P.); leeuwen@geo.u-szeged.hu (B.v.L.);
tobak@geo.u-szeged.hu (Z.T.); szatmari@geo.u-szeged.hu (J.S.)
2 Department of Soil Mapping and Environmental Informatics, Institute for Soil Science and Agricultural Chemistry, Centre for Agricultural Research, Hungarian Academy of Sciences, Herman Ottó út 15, H-1022 Budapest, Hungary; arvai.matyas@rissac.hu (M.Á.); meszaros.janos@rissac.hu (J.M.);
pasztor@rissac.hu (L.P.)
* Correspondence: toto@geo.u-szeged.hu; Tel.: +36-62-343-368
Abstract:The species richness and biodiversity of vegetation in Hungary are increasingly threatened by invasive plant species brought in from other continents and foreign ecosystems. These invasive plant species have spread aggressively in the natural and semi-natural habitats of Europe. Common milkweed (Asclepias syriaca) is one of the species that pose the greatest ecological menace. Therefore, the primary purpose of the present study is to map and monitor the spread of common milkweed, the most common invasive plant species in Europe. Furthermore, the possibilities to detect and validate this special invasive plant by analyzing hyperspectral remote sensing data were investigated.
In combination with field reference data, high-resolution hyperspectral aerial images acquired by an unmanned aerial vehicle (UAV) platform in 138 spectral bands in areas infected by common milkweed were examined. Then, support vector machine (SVM) and artificial neural network (ANN) classification algorithms were applied to the highly accurate field reference data. As a result, common milkweed individuals were distinguished in hyperspectral images, achieving an overall accuracy of 92.95% in the case of supervised SVM classification. Using the ANN model, an overall accuracy of 99.61% was achieved. To evaluate the proposed approach, two experimental tests were conducted, and in both cases, we managed to distinguish the individual specimens within the large variety of spreading invasive species in a study area of 2 ha, based on centimeter spatial resolution hyperspectral UAV imagery.
Keywords: invasive species; common milkweed; hyperspectral imaging; UAV; artificial neural networks; SVM classification
1. Introduction
At present, nature conservation is encountering a major challenge to preserve natural habitats and biodiversity. One of the most critical threats to biodiversity is the spread of invasive species that are non-native to a specific location. They spread aggressively and rapidly, covering large areas and adversely affecting native species and habitats. The importance of this topic has also been highlighted by the United Nations (UN). The UN’s sustainable development goals include supporting the suppression of invasive plant species (Development goal No.15.8), and the corresponding indicator (Indicator No.15.8.1) outlines the proportion of countries controlling and preventing the spread of invasive species in compliance with national legislation [1]. To identify the geographical premises of this problem and to model and predict their future spread, acquiring current and detailed spatial data is required [2–5]. The spread of invasive species is a serious issue not only in Hungary and Central Europe but also at global level, being one of the major threats to biodiversity [6,7].
Land2021,10, 29. https://doi.org/10.3390/land10010029 https://www.mdpi.com/journal/land
Land2021,10, 29 2 of 18
Besides serious environmental damage, the mass spread of invasive species can also cause economic losses in agricultural areas [8–10]. Therefore, continuous monitoring of invasive plant species spreading, as well as mapping spread corridors and delineating contaminated areas, is of increasing importance for the purposes of nature conservation and agriculture [11]. Forecasts for areas that are potentially sensitive to this problem are also in high demand.
In the past 15–20 years, different sensors were used for monitoring invasive species on various platforms [12]. Hyperspectral (HS) satellites like EO-1 Hyperion [13–16] or Huan Jing-1 (HJ-1) can be used for this purpose. Sensors can also be placed on airborne platforms, which can be used effectively for invasive species mapping: AVIRIS [17,18], CASI [19,20], AISA [21–23], APEX [24], AHS [20], HySpex. Hyperspectral data provides near continuous spectral reflectance curves that allow the identification of unique spectral signatures, calculating narrow band vegetation indices and, consequently, better separation of plant species from each other. This serves as the main advantage of hyperspectral sensors over the multispectral ones which records electromagnetic radiation averaged over a broad
“band” of wavelengths [25,26].
The methods described in scientific literature to isolate invasive vegetation are di- verse and vary in complexity. Among others, we come across spectral angle mapping (SAM) [20,21,27–29], linear spectral mixture models (LSMM) [19], spectral mixture analysis (SMA) [28], support vector machines (SVM) [30–34], random forest [23,32,35–37], support vector regression (SVR) [38], regression trees [33,39], MaxEnt [33,36,40], and other spectral target detection techniques [20].
Support vector machine (SVM) is a machine learning (ML) algorithm proposed for classification and regression problems in the late 1990s [41]. Originally, it was defined as a binary classifier, however, later adaptations made it suitable for multiclass problems too.
In this approach, if a data distribution is nonlinear, the data are transformed to a higher dimension so as to become linearly separable. The transformation of the original data is performed using kernels [42]. The key advantages of an SVM are that it learns well with only a few features required, is robust against errors, and is computationally efficient compared to other ML methods, such as neural networks [41].
Artificial neural networks (ANNs) were originally introduced as models grounded on the concept of brain functioning. They are based on a large set of connected elements that propagate a signal by nonlinearly adjusting it according to the weights [43]. Although de- veloped more than half a century ago, for a long period, ANNs were not commonly applied to image classification tasks. Only in the 2000s, neural networks started to attract increasing attention due to the expanded availability of data, optimization of training algorithms and network architectures, and advances in hardware, especially the introduction of affordable and powerful graphic processing units (GPUs). In the last 10 years, great advances have been achieved in the field of deep neural networks [44,45]. Recently, this development has been further enhanced due to easier access to algorithms via open-source machine learning libraries, such as scikit-learn [46], Pytorch [47], and Keras-Tensorflow [48,49].
Several studies applied SVM and ANN to map milkweed spreading under different nitrogen conditions, based on spectrometer data. These studies were conducted in a consid- erably small 20×20 m test plot with a low spatial resolution of 2 m [50,51]. In the precision agricultural related field, several studies have focused on the in situ detection of milk- weed by applying an SVM to mobile camera data [52–54]. Although mapping milkweed based on airborne hyperspectral data through supervised classification techniques has been described previously, SVM and ANN have not been applied to classify milkweed in high-resolution hyperspectral unmanned aerial vehicle (UAV) data. The use of UAV based remote sensing makes it possible to generate aerial data about specific areas with higher spatial resolution compared to manned aerial platforms or satellite based sensors [7,55–57].
Land2021,10, 29 3 of 18
Cubert hyperspectral remote and proximal sensing proved to be an efficient platform for the detection of spectro-phenological parameters of different plantations [58], like raspberry varieties [59] or grassland agricultural vegetation type [60]. It was also tested as a unique technique in complex agro-ecosystem monitoring [61]. The UAV-HS camera set presented in this paper makes the collection of hyperspectral aerial data in the centimeter spatial resolution range possible, which can be an asset in individual scale identification of invasive species. The applied SVM and ANN image classification methods of UAV based data can be useful tools for the identification of individual invasive plants, and to distinguish them from other separate plants of native species. This type of detailed vegetation mapping is essential for the early detections of the biological invasions of the terrestrial ecosystems. Individual scale investigation is required for mapping and monitoring of biological invasion generated by rapid vegetation changes. Furthermore, the automated detection of individual plants can help to determine the fuzzy boundary between infected and non-infected areas.
The aim of our research is to identify the individuals of common milkweed (Asclepias syriaca) in an infected National Park in Hungary. Common milkweed is an herbaceous species that is expanding rapidly in many European countries. We aim is to test the SVM and ANN image classification methods for their usefulness of the individual scale detection of this species. Data acquisition is based on detailed hyperspectral aerial remote sensing and terrestrial observations. We demonstrate that the combination of GPS-based field surveys and drone-operated hyperspectral aerial photography can be used effectively to accurately map the infected areas. We also focused on collecting and processing field reference data, supplementing and processing all of our data at the investigated scale.
Furthermore, in the present study, an overview of the current situation corresponding to the biodiversity threat in Hungary is provided. Through this study, we would like to contribute to the work of experts and nature conservation professionals and to highlight the importance of the considered topic.
2. Study Area and Materials 2.1. Common Milkweed
Common milkweed is a rapidly spreading invasive plant, whose appearance in an ecosystem leads to the suppression of original vegetation [2,3] (Figure1). Common milk- weed (Asclepias syriaca), a species native to the American continent, was brought to Hun- gary (for beekeeping purposes) in the 18th century [62]. According to the Raunkiær and Ujvárosi’s system, which is used to classify plants according to life-form categories, com- mon milkweed belongs to category G3; that is, it propagates through rhizomes and forms large colonies (polycormones), which also help it to overwinter [63,64]. Its propagation is highly effective since, besides propagating through rhizomes, it also produces an average of 300 seeds, each with long and flossy hair in its follicles.
Common milkweed grows up to 0.8–1.5 m. Its bright, green leaves are 5–9 cm wide and 15–25 cm long [65,66]. At an appropriate resolution, these morphological features enable the detection of these plants through remote sensing. Based on our field experience, to distinguish each plant, a resolution of 40–80 cm or higher is required, depending on the degree of infection in the target area.
Land2021,10, 29 4 of 18
Land 2021, 10, x FOR PEER REVIEW 4 of 20
(a) (b)
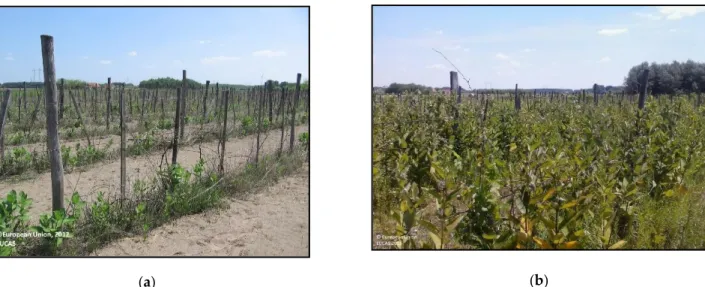
Figure 1. Rapid spread of common milkweed in an abandoned vineyard between (a) 2012 and (b) 2015 in the Hungarian Great Plain, according to the Eurostat LUCAS land-use and land-cover database field survey photos.
Common milkweed grows up to 0.8–1.5 m. Its bright, green leaves are 5–9 cm wide and 15–25 cm long [65,66]. At an appropriate resolution, these morphological features en- able the detection of these plants through remote sensing. Based on our field experience, to distinguish each plant, a resolution of 40–80 cm or higher is required, depending on the degree of infection in the target area.
Currently, one of the most infected areas is the Southern Great Plain region [67,68], where the study area is situated. The conservation damage caused by common milkweed is significant, specifically in open sandy grasslands [69]. It spreads rapidly in abandoned vineyards, orchards, and planted forests, and expands to grasslands of high conservation value. Common milkweed grows predominantly on sandy soils and prefers soils with considerably high water absorption and conductivity, poor water-storage capacity, and very poor water retention [70]. After the fall of the communist regime, in the beginning of the 1990s, large parts of the arable land were abandoned owing to uneconomical cultiva- tion, thereby providing favorable conditions for an explosive spread of this species. Ac- cording to surveys, its stock doubled in several decades. Academic literature also indi- cates that the spread of common milkweed is strongly related to changes in land-use modes [71–73]. In Hungary, the area of Bács-Kiskun County (Southern Great Plain) is characterized by heterogeneous land cover, and several previously cultivated plots (vine- yards, orchards, and arable land) have lain fallow since the 1990s [74,75]. The conditions inherent in abandoned or fallow land facilitate the appearance and spread of common milkweed [76–79].
2.2. Study Area
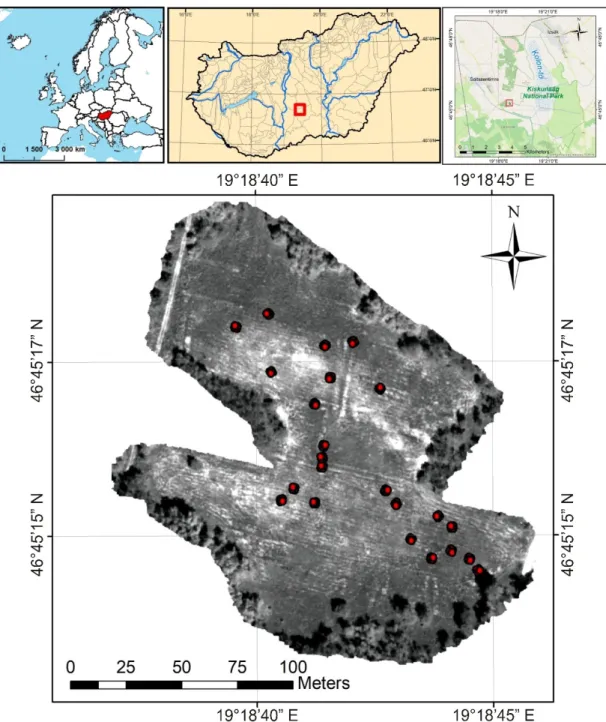
The study site is located in the Kiskunság National Park, which is the main nature conservation authority in the region. The rangers of the National Park, who are responsi- ble for the area and have been monitoring its development and changes in land use and land cover for years, have proposed the selection of the exact study area. The site includes one heavily infected plot, which covers 2 ha, several kilometers east of the village of Soltszentimre in the national park (Figure 2). The progression of infection differs in the diverse sites of the area. The area considered in the present study was abandoned many years ago but underwent herbicide control in 2014, resulting in a reduction in common milkweed shoots (representing a lower rate of infection) with less developed specimens.
Our hyperspectral UAV based vegetation mapping survey was conducted in July 2017.
Figure 1.Rapid spread of common milkweed in an abandoned vineyard between (a) 2012 and (b) 2015 in the Hungarian Great Plain, according to the Eurostat LUCAS land-use and land-cover database field survey photos.
Currently, one of the most infected areas is the Southern Great Plain region [67,68], where the study area is situated. The conservation damage caused by common milkweed is significant, specifically in open sandy grasslands [69]. It spreads rapidly in abandoned vineyards, orchards, and planted forests, and expands to grasslands of high conservation value. Common milkweed grows predominantly on sandy soils and prefers soils with considerably high water absorption and conductivity, poor water-storage capacity, and very poor water retention [70]. After the fall of the communist regime, in the beginning of the 1990s, large parts of the arable land were abandoned owing to uneconomical cultivation, thereby providing favorable conditions for an explosive spread of this species. According to surveys, its stock doubled in several decades. Academic literature also indicates that the spread of common milkweed is strongly related to changes in land-use modes [71–73].
In Hungary, the area of Bács-Kiskun County (Southern Great Plain) is characterized by heterogeneous land cover, and several previously cultivated plots (vineyards, orchards, and arable land) have lain fallow since the 1990s [74,75]. The conditions inherent in abandoned or fallow land facilitate the appearance and spread of common milkweed [76–79].
2.2. Study Area
The study site is located in the Kiskunság National Park, which is the main nature conservation authority in the region. The rangers of the National Park, who are responsible for the area and have been monitoring its development and changes in land use and land cover for years, have proposed the selection of the exact study area. The site includes one heavily infected plot, which covers 2 ha, several kilometers east of the village of Soltszentimre in the national park (Figure2). The progression of infection differs in the diverse sites of the area. The area considered in the present study was abandoned many years ago but underwent herbicide control in 2014, resulting in a reduction in common milkweed shoots (representing a lower rate of infection) with less developed specimens.
Our hyperspectral UAV based vegetation mapping survey was conducted in July 2017.
Land2021,10, 29 5 of 18
Land 2021, 10, x FOR PEER REVIEW 5 of 20
Figure 2. Location of the target plot in the Southern Great Plain region (on the Kiskunság Sand Ridge), on the outskirts of the village of Soltszentimre: the area of 2 ha is considered as the study site with 23 sampling quadrats.
3. Methods
The present study relies on two major methodologies applied at the local scale. The first is a Support Vector Machine (SVM), which is used to find an optimal hyperplane between classes [41]. The other method is based on an Artificial Neural Network (ANN), where interconnected neurons are used to store information between input and output patterns [45]. In the study area, we investigated the areas infected with common milk- weed, analyzing data acquired by a UAV platform, and processed them considering the ground reference data. For the classifications, hyperspectral UAV images consisting of 138 bands in the 450–950 nm spectral range with 4 nm sampling intervals were used. Field reference data were collected for training and validation purposes using quadrats. Only common milkweed was collected, resulting in a binary classification: common milkweed and no common milkweed classes.
Figure 2.Location of the target plot in the Southern Great Plain region (on the Kiskunság Sand Ridge), on the outskirts of the village of Soltszentimre: the area of 2 ha is considered as the study site with 23 sampling quadrats.
3. Methods
The present study relies on two major methodologies applied at the local scale. The first is a Support Vector Machine (SVM), which is used to find an optimal hyperplane between classes [41]. The other method is based on an Artificial Neural Network (ANN), where interconnected neurons are used to store information between input and output patterns [45]. In the study area, we investigated the areas infected with common milkweed, analyzing data acquired by a UAV platform, and processed them considering the ground reference data. For the classifications, hyperspectral UAV images consisting of 138 bands in the 450–950 nm spectral range with 4 nm sampling intervals were used. Field reference data were collected for training and validation purposes using quadrats. Only common milkweed was collected, resulting in a binary classification: common milkweed and no common milkweed classes.
Land2021,10, 29 6 of 18
3.1. UAV Multicopter Carrier Platform
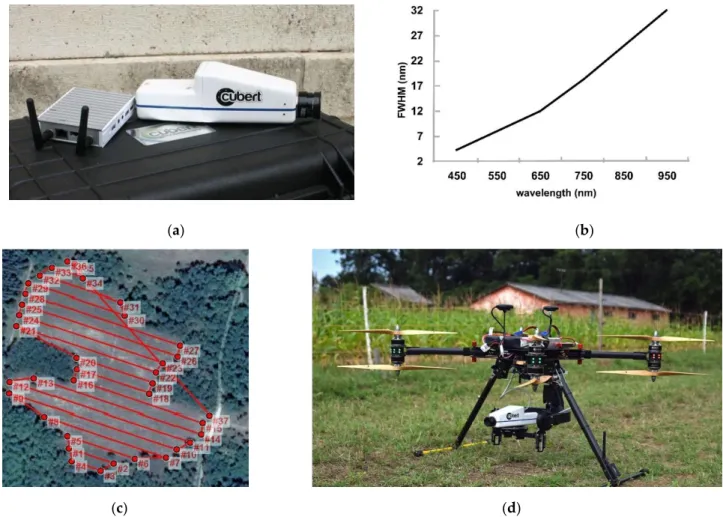
To determine the presence of common milkweed, a Carbon Core Cortex X8 octocopter with a Zero-Tech Gemini flight controller system equipped with a hyperspectral sensor was employed (Figure3a,d). A large advantage of this system lied in its high-level redundancy (eight co-axially placed motors for easier transportability and dual hardware units within the flight controller in parallel), which was important from the viewpoint of flight security.
Owing to the high power of this airframe, it could lift off a Cubert UHD-185 camera for a maximum of 15 min, which was sufficient to cover a 2–3 ha area with a 2–3 cm spatial resolution from a nearly 80–100 m flying altitude above the ground level.
Land 2021, 10, x FOR PEER REVIEW 6 of 20
3.1. UAV Multicopter Carrier Platform
To determine the presence of common milkweed, a Carbon Core Cortex X8 octocop- ter with a Zero-Tech Gemini flight controller system equipped with a hyperspectral sensor was employed (Figure 3a,d). A large advantage of this system lied in its high-level redun- dancy (eight co-axially placed motors for easier transportability and dual hardware units within the flight controller in parallel), which was important from the viewpoint of flight security. Owing to the high power of this airframe, it could lift off a Cubert UHD-185 camera for a maximum of 15 min, which was sufficient to cover a 2–3 ha area with a 2–3 cm spatial resolution from a nearly 80–100 m flying altitude above the ground level.
Considering that it was impossible to plan photogrammetric-like flight routes in the genuine Zero-Tech ground control software (GCS), mission planning was performed through an ArduPilot mission planner (Figure 3c) using a survey grid tool based on a polygon file, which contained the surveyed area, as well as the camera parameters (sensor size, focal length, and resolution) and photogrammetric ones (flying height and speed and forward and sideway overlap). The latter parameters were defined such that two flights were necessary to cover the whole study site, to fulfill the requirements of the photogram- metric survey. A specific script was developed to transform the ArduPilot mission plan- ner flight route files into the Zero-Tech GCS path ones (skw format) and to import and upload them into the octocopter. Utilizing the above parameters and generated flight route, the aerial surveys were carried out on the study site.
(a) (b)
(c) (d)
Figure 3. (a) Cubert UHD-185 HS camera with the Fitlet mini PC; (b) FWHM of the spectral range increase from 4 nm to approximately 32 nm; (c) One of the planned flying routes in the ArduPilot mission planner; (d) CarbonCore Cortex X8 octocopter equipped with the Cubert UHD-185 camera.
Figure 3.(a) Cubert UHD-185 HS camera with the Fitlet mini PC; (b) FWHM of the spectral range increase from 4 nm to approximately 32 nm; (c) One of the planned flying routes in the ArduPilot mission planner; (d) CarbonCore Cortex X8 octocopter equipped with the Cubert UHD-185 camera.
Considering that it was impossible to plan photogrammetric-like flight routes in the genuine Zero-Tech ground control software (GCS), mission planning was performed through an ArduPilot mission planner (Figure3c) using a survey grid tool based on a polygon file, which contained the surveyed area, as well as the camera parameters (sensor size, focal length, and resolution) and photogrammetric ones (flying height and speed and forward and sideway overlap). The latter parameters were defined such that two flights were necessary to cover the whole study site, to fulfill the requirements of the photogrammetric survey. A specific script was developed to transform the ArduPilot mission planner flight route files into the Zero-Tech GCS path ones (skw format) and to import and upload them into the octocopter. Utilizing the above parameters and generated flight route, the aerial surveys were carried out on the study site.
Land2021,10, 29 7 of 18
3.2. Hyperspectral Image Capturing System
To cover the extent of the study site, which is approximately 2 ha, in total 505 images were taken during the two flights of the UAV. The flight parameters were adjusted to the actual weather conditions. The nominal flight speed was 3 m/s, the maximum integration time was set to 2 ms. The overlap between the images and rows was 60%, which proved to be an adequate value to generate an orthomosaic image with approx. 2 cm/pixel resolution.
The orthomosaic image was compiled in Agisoft Metashape software environment [80].
The image capturing system comprised a Cubert UHD-185 hyperspectral snapshot camera and a Compulab Fitlet mini personal computer (PC). The Cubert camera simultane- ously recorded 138 bands in the spectral range of 450–950 nm with a sampling interval of 4 nm. Concerning these bands, the camera manufacturer recommended to employ only 125 bands within the visible (VIS)—near infrared (NIR) wavelength interval. The full width at half maximum (FWHM) of the bands increased from approximately 4 nm at 450 nm to approximately 32 nm at 950 nm (Figure3b).
The camera included two image capturing sensors; for each band, a 50×50 pixel hyperspectral (HS) image with 12 bit (4096 DN—digital number) radiometric resolution was generated. Simultaneously, Cubert UHD-185 captured a panchromatic image with a resolution of 1000×1000 pixels. A camera lens with a focal length of 17 mm was utilized to obtain an across-track field of view of approximately 20◦. The ground resolution at a flying height of 80 m was approximately 40 cm for HS pixels and 2 cm for a panchromatic image. Using the manufacturer software Cubert Edelweiss, installed in the camera, the HS resolution could be pan-sharpened to the panchromatic 1 megapixel resolution.
The UHD camera required calibration before the start of the field survey. The HS imagery system was calibrated using a white reflectance spectral panel formed of a PTFE- based (polytetrafluoroethylene) high-reflective optical material. Under appropriate weather conditions (sunny, clear sky), the typical integration time required for capturing an HS data cube was 1 ms (1/1000 of a second). The UAV platform carried the whole HS camera system with the mini PC, which could be remotely controlled via Wi-Fi. It was connected to the camera through two gigabit Ethernet cables and ran the software installed to control the camera. The captured spectral data were received and uploaded directly into a flash drive embedded in the mini PC, which could also be reached through a wireless connection [81].
The field survey campaign was conducted in the period between 11 am and 2 pm around solar noon, so that there was a larger chance for the weather conditions that would be appropriate for the measurements. The cloudless sky was one of the main requirements, because the camera should be used the fastest possible integration time possible, to minimize the image blurring effect [82].
3.3. Ground Reference Survey
Besides aerial photography, the field reference data were also recorded in the study site. These data served as the basis for the supervised classification of HS aerial images.
Owing to the high spatial accuracy of the HS UAV imagery, the field reference data were acquired with high accuracy.
Therefore, several high-precision random samples were acquired in the study area.
We took care to collect different development states of common milkweed and to have a uniform distribution, because it was important to store samples of the plant in the datasets from the immature germ plants to the fully developed specimens to be able to identify all variety of this species during the classification.
For the purpose of sampling, 1× 1 m quadrats were marked on the soil surface by using a 1 m2metal frame. Accordingly, 23 quadrats were marked on the study site.
Each corner of the metal frame used to mark the quadrats was calibrated with centimeter accuracy using a GNSS RTK GPS.
After performing digitization of the corner points, they were used to depict the recorded quadrats, which could be superimposed accordingly on the mosaic of the HS images. Within the quadrats, a botanical survey was conducted, and all plant species
Land2021,10, 29 8 of 18
visible in a corresponding aerial photograph were listed, focusing on common milkweed, together with their attributes (number, coverage, and development of shoots). The detailed botanical survey within the quadrats allowed identifying other herbaceous species, such as field eryngo (Eryngium campestre), blanket flower (Gaillardia), and wood-small reed or bush grass (Calamagrostis epigejos). However, we decided to consider only common milkweed, as the spatial resolution of images did not allow performing a clear delineation of other herbaceous species. Moreover, an attempt to classify so many other species could result in under-representing the class of common milkweed. All data about the flora within each quadrat were stored in the spatial database.
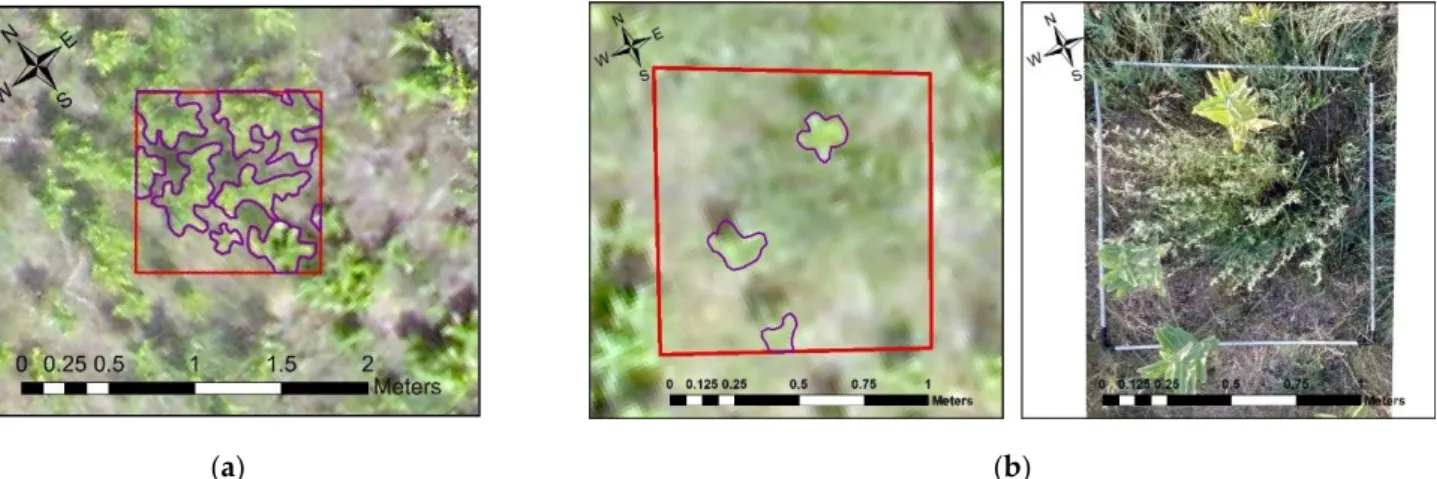
Additionally, concerning each recorded quadrate, a photograph was taken with a handheld camera from above. These photographs alone could not be considered as geo-informative or spatial data, but when paired with the considered database and geo- referenced to the corners of the specified quadrats in a mosaic image, they enabled a greater precision of the manual delineation of common milkweed shoots. Interpreting the orthomosaic alone was insufficient to accurately determine the invasive species. The resulting polygons within the quadrats represented common milkweed shoots (Figure4).
Delineation was performed using the ArcMap 10.3 GIS software. The resulting vector layer served as the basis for later classifications.
Land 2021, 10, x FOR PEER REVIEW 8 of 20
After performing digitization of the corner points, they were used to depict the rec- orded quadrats, which could be superimposed accordingly on the mosaic of the HS im- ages. Within the quadrats, a botanical survey was conducted, and all plant species visible in a corresponding aerial photograph were listed, focusing on common milkweed, to- gether with their attributes (number, coverage, and development of shoots). The detailed botanical survey within the quadrats allowed identifying other herbaceous species, such as field eryngo (Eryngium campestre), blanket flower (Gaillardia), and wood-small reed or bush grass (Calamagrostis epigejos). However, we decided to consider only common milk- weed, as the spatial resolution of images did not allow performing a clear delineation of other herbaceous species. Moreover, an attempt to classify so many other species could result in under-representing the class of common milkweed. All data about the flora within each quadrat were stored in the spatial database.
Additionally, concerning each recorded quadrate, a photograph was taken with a handheld camera from above. These photographs alone could not be considered as geo- informative or spatial data, but when paired with the considered database and geo-refer- enced to the corners of the specified quadrats in a mosaic image, they enabled a greater precision of the manual delineation of common milkweed shoots. Interpreting the ortho- mosaic alone was insufficient to accurately determine the invasive species. The resulting polygons within the quadrats represented common milkweed shoots (Figure 4). Delinea- tion was performed using the ArcMap 10.3 GIS software. The resulting vector layer served as the basis for later classifications.
(a) (b)
Figure 4. Pictures of common milkweed specimens delineated within the designated quadrats: (a) a quadrate in which individual specimens can be clearly delineated in the mosaic photograph; (b) it is shown where it can only be delineated by geo-referenced field photography.
3.4. Delineation Methods
Different Machine Learning (ML) algorithms were compared in terms of the task of automatically recognizing and delineating common milkweed plants based on the UAV orthomosaic. Several supervised classifiers have been tested (for example, maximum like- lihood and spectral angle mapper), and it was concluded that SVM and ANN with multi- ple hidden layers provided the best results. These two methods and their results are pre- sented below.
3.4.1. SVM Classification
To acquire the training data for SVM classification, the plants delineated in the quad- rats were divided with a ratio of 1/3–2/3. The 2/3 portion was used for classification train- ing, while the 1/3 portion was considered for validation. First, the vector layer was split into the appropriate proportion, and then rasterized. Using the opposite sequence, the pixels of a rasterized polygon representing an individual plant could fall into different classes (training or validating ones). Based on our experience, this could distort the results Figure 4.Pictures of common milkweed specimens delineated within the designated quadrats: (a) a quadrate in which individual specimens can be clearly delineated in the mosaic photograph; (b) it is shown where it can only be delineated by geo-referenced field photography.
3.4. Delineation Methods
Different Machine Learning (ML) algorithms were compared in terms of the task of automatically recognizing and delineating common milkweed plants based on the UAV orthomosaic. Several supervised classifiers have been tested (for example, maximum likelihood and spectral angle mapper), and it was concluded that SVM and ANN with multiple hidden layers provided the best results. These two methods and their results are presented below.
3.4.1. SVM Classification
To acquire the training data for SVM classification, the plants delineated in the quadrats were divided with a ratio of 1/3–2/3. The 2/3 portion was used for classifi- cation training, while the 1/3 portion was considered for validation. First, the vector layer was split into the appropriate proportion, and then rasterized. Using the opposite sequence, the pixels of a rasterized polygon representing an individual plant could fall into different classes (training or validating ones). Based on our experience, this could distort the results of classification and lead to unrealistic results. During the preprocessing step, all pixels of an individual plant were categorized into the training or validating classes.
Land2021,10, 29 9 of 18
The classification was performed using a kernel function (K) called radial basis func- tion (RBF) as the Equation (1) shows:
K xi, xj
=exp exp
−γkxi−xjk2, γ>0 (1) where thexiandxjare the dimensional inputs for which the (xi, xj)∈Rn (n-dimension real-coordinate space) condition is met and theγis a kernel parameter [83]. The kernel functions return the inner product between two points in a suitable feature space. The RBF kernel was selected because it is nonlinearly aligning samples into a higher dimensional space [84]. Moreover, the kernel values do not go to infinity or zero, therefore the 0 <Ki,j≤ 1 criteria is always true unlike the polynomial kernel [83]. The optimal Gamma parameter was determined to 0.007. The penalty parameter of the error term was 100.00 which is a strict condition that does not allow for assumed misclassification. The applied classification probability threshold was 0.95.
Besides the SVM classification on all 138 bands, a Minimum Noise Fraction (MNF) transformation and a Principal Component Analysis (PCA) were conducted as well. These statistical methods are widely used in remotely sensed vegetation analysis and botanical surveys to reduce the number of input variables. Both are based on eigenvalues of UAV images [85,86]. Data preprocessing using these methods was evaluated as a method to increase the accuracy of SVM classification. Classifications were performed using the ENVI 4.8 software.
3.4.2. Artificial Neural Network
Concerning the ANN classification, all layers of the HS image were not required.
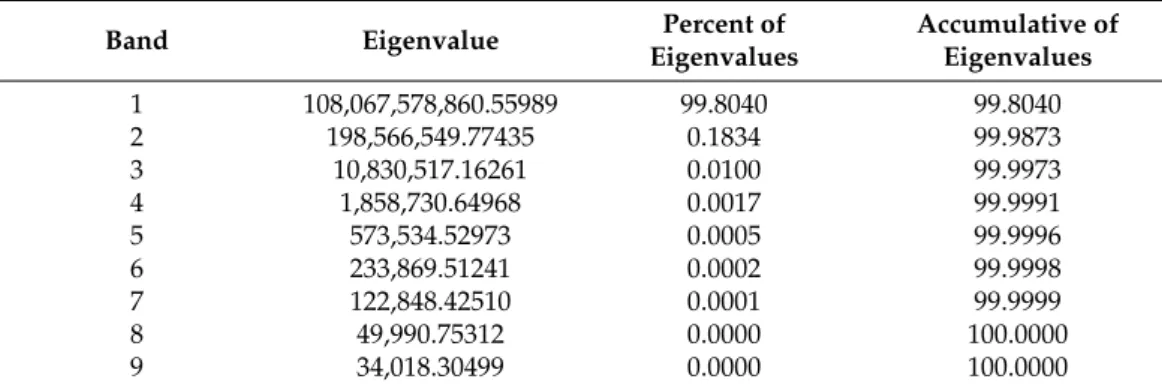
While performing classification, this could cause large redundancy and make the calcula- tions unnecessarily computationally expensive. Therefore, PCA was applied to reduce the number of bands while mostly retaining the information stored in the original bands. Sev- eral experiments were conducted, and it was determined that nine principal components of the original 138 bands were sufficient for the classification [87,88]. The summary results of the conducted analysis for the first nine principal components are presented in Table1.
Table 1.Percent and accumulative eigenvalues for PCA.
Band Eigenvalue Percent of
Eigenvalues
Accumulative of Eigenvalues
1 108,067,578,860.55989 99.8040 99.8040
2 198,566,549.77435 0.1834 99.9873
3 10,830,517.16261 0.0100 99.9973
4 1,858,730.64968 0.0017 99.9991
5 573,534.52973 0.0005 99.9996
6 233,869.51241 0.0002 99.9998
7 122,848.42510 0.0001 99.9999
8 49,990.75312 0.0000 100.0000
9 34,018.30499 0.0000 100.0000
Visible interpretation of principal component 5 to 9 indicated that statistically, they did not contribute anymore to the signal, but that there was still an observable pattern in the data that could be useful for the classifier.
A feed-forward ANN with 9 ×24 × 12 ×1 layers was developed using Tensor- flow/Keras library [48], and the optimal parameters were selected using the scikit-learn Gridsearch method [46]. To reduce overfitting, a dropout of 20% was applied after each layer. To implement the classifier, the Adam adaptive learning rate optimizer algorithm and binary cross-entropy loss function were employed, as in this study, the classification in- cluded only two classes: the class of common milkweed and that of areas without common milkweed. The batch size and epoch hyperparameters were set as 24 and 100, respectively.
Land2021,10, 29 10 of 18
The accuracy was determined through a 10-fold cross validation. This resulted in achieving a mean overall accuracy of 0.9483 with a variance of 0.0709 on the validation set. The rectified linear unit activation functions were applied to the first two layers and the sigmoid function to the last one.
Sample areas were digitized as polygons with and without milkweed. The field survey polygons were the same as those used for the SVM classification. Concerning the non-infected areas (no common milkweed class was identified), quadrats were applied.
Common milkweed was digitized as polygons based on the original hyperspectral image.
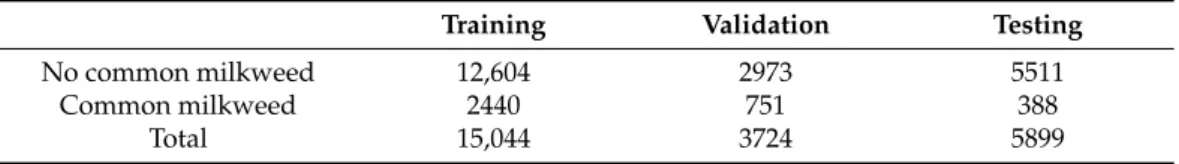
All polygons were randomly split into three groups: one for training, one for validation, and one for testing. Each polygon was converted to points, where one point was created for each pixel within the area covered by the polygon. Then, the points were used to extract the values from the PCA data set, resulting in nine input features. The samples were used to train the model, while the validation set was used to adjust the hyperparameters and prevent overfitting (Table2). It was not possible to directly feed the entire image to the trained model, because it was causing memory problems, therefore the image was tiled into sub images of 1000×1000 pixels. One by one, the tiles were converted to arrays and read into the model. The model classified each tile separately and then the classified tiles were concatenated to their original position in the image, resulting in the classified image with the common milkweed and no common milkweed classes.
Table 2.Number of points in the training, validation, and testing sets.
Training Validation Testing
No common milkweed 12,604 2973 5511
Common milkweed 2440 751 388
Total 15,044 3724 5899
4. Results and Discussion
As a result of the conducted tests, we observed that the overall accuracy of the SVM classification performed considering the common milkweed class was 93%, with a producer accuracy of 73.6% (Table3). However, this classification accuracy could not be improved by applying MNF transformation and PCA to SVM classification. During the MNF transformation, the accuracy increased to 75.6%, but the class of common milkweed became over-represented. The transformation reduced the dimensions of the HS images and eliminated interfering signals. False-positive results were mainly observed in open grasslands, where the reflectance was highest. By applying PCA, the available 138 spectral bands were reduced to 15 components for SVM classification, as the first 15 principal components contained most of the spectral information. The result was geometrically more accurate; however, according to the confusion matrix, the achieved accuracy was only 52.1% and the considered class remained over-represented in open grasslands, similarly to the case of MNF transformation.
Table 3.Validation of the SVM classification.
Model Validation
Common milkweed No common milkweed
Common milkweed 2634 0
No common milkweed 945 9826
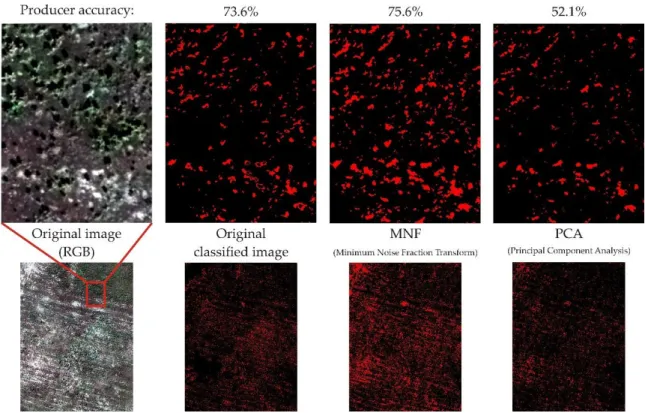
As shown in Figure5, open grasslands stretching transversely on sandy soils with high reflectance values in the southern part of the subarea. They were poorly classified after applying both MNF transformation and PCA (Figure5). We noted that the reduction of HS data to fewer bands at the examined scale did not provide satisfactory results for the SVM classification aimed at a clear identification of common milkweed. Moreover, the
Land2021,10, 29 11 of 18
SVM classification without transformations was visually more accurate concerning the whole study area.
Land 2021, 10, x FOR PEER REVIEW 11 of 20
SVM classification without transformations was visually more accurate concerning the whole study area.
Figure 5. Results of SVM classification on a smaller section of the study area.
The ANN model was validated through the training, resulting in an overall accuracy of 99.19% (Table 4) and a Cohen’s Kappa coefficient of 97.19. The classified image was independently tested with an overall accuracy of 99.61% and a Cohen’s Kappa coefficient of 96.02.
Table 4. Validation of the ANN method.
Model Validation
Common milkweed No common milkweed
Common milkweed 3063 10
No common milkweed 20 631
Independent Testing on New Dataset
Common milkweed No common milkweed
Common milkweed 5583 19
No common milkweed 4 293
The obtained result was rather similar to that of the SVM classification (Figure 6). The locations of the most infected plots were similar. It was clearly visible that the northern areas were more infected by the invasive plant. In the southern parts of the study site, the progression of infection was less advanced, and the seedlings were smaller, less devel- oped, and less densely spread, likely due to the herbicide control in 2014.
Figure 5.Results of SVM classification on a smaller section of the study area.
The ANN model was validated through the training, resulting in an overall accuracy of 99.19% (Table4) and a Cohen’s Kappa coefficient of 97.19. The classified image was independently tested with an overall accuracy of 99.61% and a Cohen’s Kappa coefficient of 96.02.
Table 4.Validation of the ANN method.
Model Validation
Common milkweed No common milkweed
Common milkweed 3063 10
No common milkweed 20 631
Independent Testing on New Dataset
Common milkweed No common milkweed
Common milkweed 5583 19
No common milkweed 4 293
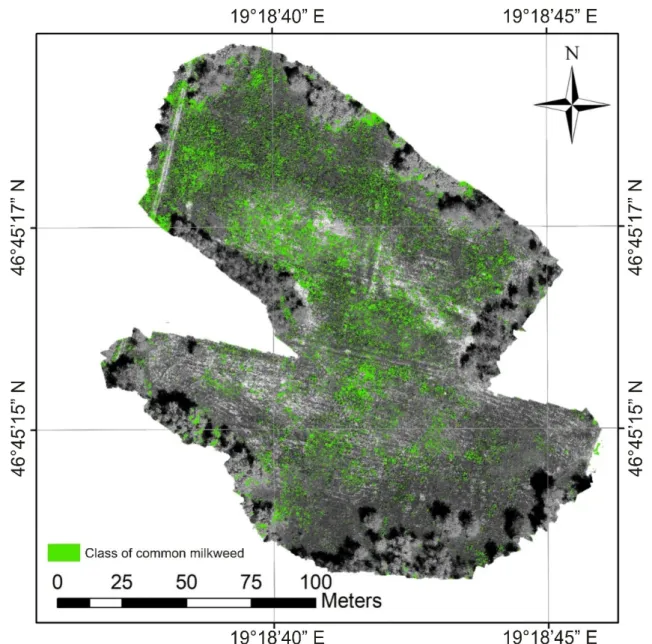
The obtained result was rather similar to that of the SVM classification (Figure6). The locations of the most infected plots were similar. It was clearly visible that the northern areas were more infected by the invasive plant. In the southern parts of the study site, the progression of infection was less advanced, and the seedlings were smaller, less developed, and less densely spread, likely due to the herbicide control in 2014.
LandLand 2021, 10, x FOR PEER REVIEW 2021,10, 29 12 of 1812 of 20
Figure 6. Results of ANN classification on the whole study area. Here, the green color represents the areas infected by common milkweed.
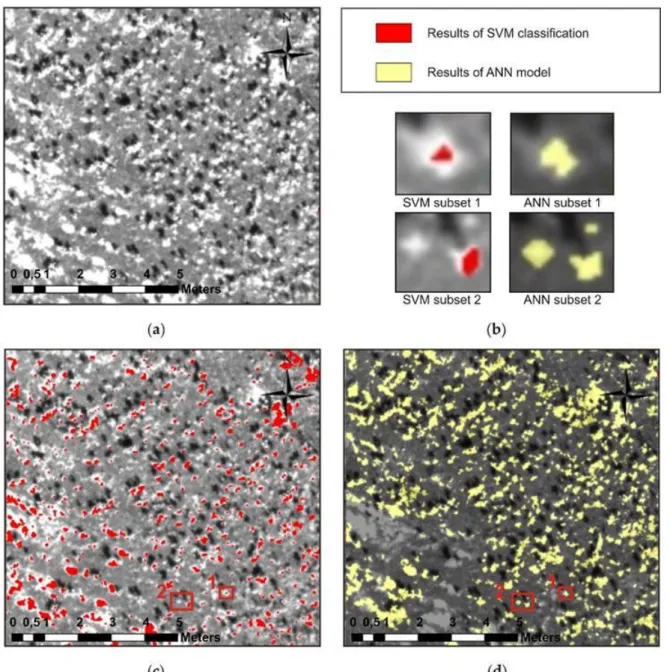
Comparing the two delineation methods in more detail, the main differences be- tween the results become visible (Figure 7). The misclassifications in the case of ANN were less significant; however, this method encountered the same problems as the SVM classi- fication. The larger homogenous areas with high reflectance values corresponded to bare sandy soils, which were the areas with the largest number of false-positive results con- cerning both classification methods. The smaller bright areas were similar to milkweed plants on the aerial images and could easily be confused with the naked eye (Figure 7a).
This difference could be observed throughout the study site, not only in the subset repre- sented in Figure 7. Furthermore, the ANN could better distinguish full plants of common milkweed and not only several pixels that were spectrally closer to the core of the plant, as SVM did (Figure 7b). This is the reason why in Figure 7d, the plots representing the same plant specimens as in Figure 7c are larger.
Figure 6.Results of ANN classification on the whole study area. Here, the green color represents the areas infected by common milkweed.
Comparing the two delineation methods in more detail, the main differences between the results become visible (Figure7). The misclassifications in the case of ANN were less significant; however, this method encountered the same problems as the SVM classification.
The larger homogenous areas with high reflectance values corresponded to bare sandy soils, which were the areas with the largest number of false-positive results concerning both classification methods. The smaller bright areas were similar to milkweed plants on the aerial images and could easily be confused with the naked eye (Figure7a). This difference could be observed throughout the study site, not only in the subset represented in Figure7.
Furthermore, the ANN could better distinguish full plants of common milkweed and not only several pixels that were spectrally closer to the core of the plant, as SVM did (Figure7b). This is the reason why in Figure 7d, the plots representing the same plant specimens as in Figure7c are larger.
Land2021,10, 29 13 of 18
Land 2021, 10, x FOR PEER REVIEW 13 of 20
Figure 7. Larger subset of the study area with heavy infection by common milkweed plants on a single band of the HS orthomosaic (a). The results of SVM classification (c) are highlighted with red, and the results of ANN model (d) are highlighted with yellow shows the differences between the results of the classifications on an example of a single plant (b).
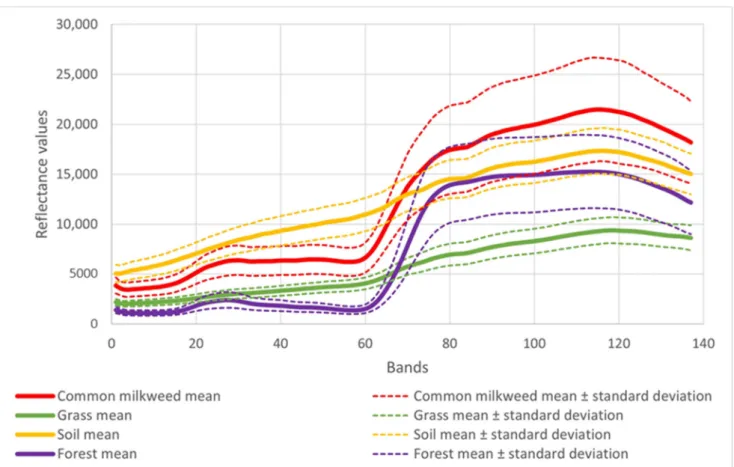
Summing up, the best results were obtained using the SVM classification with a pro- ducer accuracy of 73.6%, and an overall accuracy of 93.0%, while the ANN method re- sulted in producer and overall accuracies of resp. 99.92 and 99.19%. False-positive results were barely presented, and the extent of over-representation was insignificant. Misclassi- fied pixels were almost exclusively identified in the mixed forest-bush area at the border of the study area, and in some cases, in the bare soil areas, specifically in the case of SVM classification. The number of misclassifications concerning open grasslands was negligi- ble. The spectral profile of the plant confirms the experience of the classification results.
The main reflectance values and the standard deviation of the forest and grass land cover categories on the study area overlap with the common milkweed class (Figure 8). At the same time, common milkweed specimens were clearly delineated everywhere so the clas- sifications can be considered successful.
Figure 7.Larger subset of the study area with heavy infection by common milkweed plants on a single band of the HS orthomosaic (a). The results of SVM classification (c) are highlighted with red, and the results of ANN model (d) are highlighted with yellow shows the differences between the results of the classifications on an example of a single plant (b).
Summing up, the best results were obtained using the SVM classification with a producer accuracy of 73.6%, and an overall accuracy of 93.0%, while the ANN method resulted in producer and overall accuracies of resp. 99.92 and 99.19%. False-positive results were barely presented, and the extent of over-representation was insignificant.
Misclassified pixels were almost exclusively identified in the mixed forest-bush area at the border of the study area, and in some cases, in the bare soil areas, specifically in the case of SVM classification. The number of misclassifications concerning open grasslands was negligible. The spectral profile of the plant confirms the experience of the classification results. The main reflectance values and the standard deviation of the forest and grass land cover categories on the study area overlap with the common milkweed class (Figure8). At the same time, common milkweed specimens were clearly delineated everywhere so the classifications can be considered successful.
LandLand 2021, 10, x FOR PEER REVIEW 2021,10, 29 14 of 20 14 of 18
Figure 8. Mean reflectance values and standard deviation of principal classes present in the test field, derived from the hyperspectral data set.
To determine the locations infected by common milkweed the core data sources were remotely sensed data. High-resolution aerial images to investigate common milkweed plants can only be acquired in areas that are not covered by the canopy of trees. Conse- quently, the planted forest areas surrounding our study site with significant common milkweed infections, were not subject of the current study. Furthermore, UAV devices capable of producing images with sufficiently high spatial resolution have limitations re- garding coverage. Therefore, this type of research is confined to local scale.
5. Conclusions
In the present local-scale study, we demonstrated that common milkweed could be successfully identified by analyzing HS images. Considering UAV imagery with centime- ter-accurate field resolution, together with high-precision field reference data, allowed classifying not only various groups of mature specimens but also identifying individual plants. The SVM classification method achieved an overall accuracy of 92.95% with a few false positives. The ANN-based model reached an overall classification accuracy of 99.61%.
The main difference between the two methods lies in the capability of the ANN to identify most of the individual specimens, including the adult and less mature ones. The problem of false-positive results corresponding to bare soil areas was observed but was less significant compared to the case of conventional supervised SVM classification. The proposed techniques proved to be successful in detecting common milkweed on a local scale. The invasive plant species were delineated with a high accuracy in the study area.
In conclusion, the results of two independent experimental tests relying on different methodologies conducted on the same field truth data were comparable. The main differ- ence between the two outputs was not observed in the open grassland areas that consti- tuted important surfaces for the classification of common milkweed.
Figure 8.Mean reflectance values and standard deviation of principal classes present in the test field, derived from the hyperspectral data set.
To determine the locations infected by common milkweed the core data sources were remotely sensed data. High-resolution aerial images to investigate common milkweed plants can only be acquired in areas that are not covered by the canopy of trees. Con- sequently, the planted forest areas surrounding our study site with significant common milkweed infections, were not subject of the current study. Furthermore, UAV devices capable of producing images with sufficiently high spatial resolution have limitations regarding coverage. Therefore, this type of research is confined to local scale.
5. Conclusions
In the present local-scale study, we demonstrated that common milkweed could be successfully identified by analyzing HS images. Considering UAV imagery with centimeter- accurate field resolution, together with high-precision field reference data, allowed classify- ing not only various groups of mature specimens but also identifying individual plants.
The SVM classification method achieved an overall accuracy of 92.95% with a few false positives. The ANN-based model reached an overall classification accuracy of 99.61%.
The main difference between the two methods lies in the capability of the ANN to identify most of the individual specimens, including the adult and less mature ones. The problem of false-positive results corresponding to bare soil areas was observed but was less significant compared to the case of conventional supervised SVM classification. The proposed techniques proved to be successful in detecting common milkweed on a local scale. The invasive plant species were delineated with a high accuracy in the study area.
In conclusion, the results of two independent experimental tests relying on differ- ent methodologies conducted on the same field truth data were comparable. The main difference between the two outputs was not observed in the open grassland areas that constituted important surfaces for the classification of common milkweed.
Land2021,10, 29 15 of 18
In the present study, we successfully applied the proposed hyperspectral UAV technol- ogy from a local-scale perspective to obtain the landscape-scale milkweed density estimates within the Danube-Tisza Interfluve. Generally, the reduction of milkweed density in ru- ral ecosystems is an important step for achieving nature conservation goals (according to Regulations (EU) No 1143/2014 and (HU) No 408/2016 on the prevention and man- agement of the introduction and spread of invasive alien species). Therefore, large-scale investigations of common milkweed spreading are designed and piloted to assess trends in habitat expansion. The results of the present study suggest that the costs associated with the regional and local sampling programs can be reduced by implementing micro-UAV systems to facilitate the sampling process. We consider that the proposed techniques can be successfully implemented for this purpose.
The outcomes of this study could assist in data collection of the vegetation, and to analyze its recent status. This kind of geographic information can be the basis of management and conservation practices to prevent future spread of invasive plant species.
Author Contributions: Conceptualization, P.S., J.S. and L.P. (Levente Papp); methodology, L.P.
(Levente Papp), J.S., B.v.L. and P.S.; validation, B.v.L. and Z.T.; formal analysis, L.P. (Levente Papp), B.v.L., J.M., M.Á. and Z.T.; investigation, L.P. (Levente Papp) and J.M.; resources, L.P. (LászlóPásztor) and J.S.; writing—original draft preparation, L.P. (Levente Papp), P.S., M.Á. and J.M.; writing—
review and editing, L.P. (Levente Papp), J.S., P.S., B.v.L., Z.T., M.Á., J.M. and L.P. (LászlóPásztor);
visualization, L.P. (Levente Papp), J.M. and M.Á.; supervision, J.S., P.S. and L.P. (LászlóPásztor);
project administration, J.S. and P.S. All authors have read and agreed to the published version of the manuscript.
Funding: This research was funded by National Research, Development and Innovation Office of Hungary, grant number NKFI-6 K124648—“Time series analysis of land-cover dynamics using medium and high-resolution satellite images” project.
Institutional Review Board Statement:Not applicable.
Informed Consent Statement:Not applicable.
Data Availability Statement:Not applicable.
Acknowledgments: Our present research was supported by “Time series analysis of land-cover dynamics using medium and high-resolution satellite images” NKFI-6 K124648 project and by grant TUDFO/47138-1/2019-ITM of the Ministry for Innovation and Technology, Hungary and the WATERatRISK project (HUSRB/1602/11/0057).
Conflicts of Interest:The authors declare no conflict of interest. The funders had no role in the design of the study; in the collection, analyses, or interpretation of data; in the writing of the manuscript; or in the decision to publish the results.
References
1. Resolution adopted by the General Assembly on 25 September 2015. InA/RES/70/1; United Nations General Assembly, Ed.;
United Nations: New York, NY, USA, 2015; p. 35.
2. Csontos, P.; Bózsing, E.; Cseresnyés, I.; Penksza, K. Reproductive potential of the alien speciesAsclepias syriaca (Asclepiadaceae) in the rural landscape.Pol. J. Ecol.2009,57, 383–388.
3. Kelemen, A.; Valkó, O.; Kröel-Dulay, G.; Deák, B.; Török, P.; Tóth, K.; Miglécz, T.; Tóthmérész, B. The invasion of common milkweed (Asclepias syriaca) in sandy old-fields–is it a threat to the native flora?Appl. Veg. Sci.2016,19, 218–224. [CrossRef]
4. Long, A.L.; Kettenring, K.M.; Hawkins, C.P.; Neale, C.M. Distribution and drivers of a widespread, invasive wetland grass, Phragmites australis, in wetlands of the Great Salt Lake, Utah, USA.Wetlands2017,37, 45–57. [CrossRef]
5. Pauková, Ž.; Káderová, V.; Bakay, L. Structure and population dynamics ofAsclepias syriacaL. in the agricultural land.Agriculture 2013,59, 161–166. [CrossRef]
6. Early, R.; Bradley, B.A.; Dukes, J.S.; Lawler, J.J.; Olden, J.D.; Blumenthal, D.M.; Gonzalez, P.; Grosholz, E.D.; Ibañez, I.; Miller, L.P.;
et al. Global threats from invasive alien species in the twenty-first century and national response capacities.Nat. Commun.2016, 7, 12485. [CrossRef]
7. Martin, F.-M.; Müllerová, J.; Borgniet, L.; Dommanget, F.; Breton, V.; Evette, A. Using Single- and Multi-Date UAV and Satellite Imagery to Accurately Monitor Invasive Knotweed Species.Remote Sens.2018,10, 1662. [CrossRef]
8. Drechsler, M.; Touza, J.; White, P.C.; Jones, G. Agricultural landscape structure and invasive species: The cost-effective level of crop field clustering.Food Secur.2016,8, 111–121. [CrossRef]
Land2021,10, 29 16 of 18
9. Hartzler, R.G.; Buhler, D.D. Occurrence of common milkweed (Asclepias syriaca) in cropland and adjacent areas.Crop Prot.2000, 19, 363–366. [CrossRef]
10. Pimentel, D.; Zuniga, R.; Morrison, D. Update on the environmental and economic costs associated with alien-invasive species in the United States.Ecol. Econ.2005,52, 273–288. [CrossRef]
11. Follak, S.; Schleicher, C.; Schwarz, M. Roads support the spread of invasiveAsclepias syriacain Austria.Die Bodenkult. J. Land Manag. Food Environ.2018,69, 257–265. [CrossRef]
12. Elkind, K.; Sankey, T.T.; Munson, S.M.; Aslan, C.E. Invasive buffelgrass detection using high-resolution satellite andUAVimagery on Google Earth Engine.Remote Sens. Ecol. Conserv.2019. [CrossRef]
13. Pengra, B.W.; Johnston, C.A.; Loveland, T.R. Mapping an invasive plant,Phragmites australis, in coastal wetlands using the EO-1 Hyperion hyperspectral sensor.Remote Sens. Environ.2007,108, 74–81. [CrossRef]
14. Tsai, F.; Lin, E.K.; Yoshino, K. Spectrally segmented principal component analysis of hyperspectral imagery for mapping invasive plant species.Int. J. Remote Sens.2007,28, 1023–1039. [CrossRef]
15. Carter, G.; Lucas, K.; Blossom, G.; Lassitter, C.; Holiday, D.; Mooneyhan, D.; Fastring, D.; Holcombe, T.; Griffith, J. Remote Sensing and Mapping of Tamarisk along the Colorado River, USA: A Comparative Use of Summer-Acquired Hyperion, Thematic Mapper and QuickBird Data.Remote Sens.2009,1, 318–329. [CrossRef]
16. Somers, B.; Asner, G.P. Hyperspectral Time Series Analysis of Native and Invasive Species in Hawaiian Rainforests.Remote Sens.
2012,4, 2510–2529. [CrossRef]
17. Ustin, S.L.; DiPietro, D.; Olmstead, K.; Underwood, E.; Scheer, G.J. Hyperspectral remote sensing for invasive species detection and mapping. In Proceedings of the IEEE International Geoscience and Remote Sensing Symposium, Toronto, ON, Canada, 24–28 June 2002; pp. 1658–1660.
18. Asner, G.P.; Jones, M.O.; Martin, R.E.; Knapp, D.E.; Hughes, R.F. Remote sensing of native and invasive species in Hawaiian forests.Remote Sens. Environ.2008,112, 1912–1926. [CrossRef]
19. Miao, X.; Gong, P.; Swope, S.; Pu, R.; Carruthers, R.; Anderson, G.L.; Heaton, J.S.; Tracy, C. Estimation of yellow starthistle abundance through CASI-2 hyperspectral imagery using linear spectral mixture models.Remote Sens. Environ.2006,101, 329–341.
[CrossRef]
20. Bustamante, J.; Aragonés, D.; Afán, I.; Luque, C.; Pérez-Vázquez, A.; Castellanos, E.; Díaz-Delgado, R. Hyperspectral Sensors as a Management Tool to Prevent the Invasion of the Exotic CordgrassSpartina densiflorain the Doñana Wetlands.Remote Sens.2016, 8, 1001. [CrossRef]
21. Narumalani, S.; Mishra, D.R.; Wilson, R.; Reece, P.; Kohler, A. Detecting and mapping four invasive species along the floodplain of North Platte River, Nebraska.Weed Technol.2009,23, 99–107. [CrossRef]
22. Burai, P.; Laposi, R.; Enyedi, P.; Schmotzer, A.; Bognar, V.K. Mapping invasive vegetation using AISA Eagle airborne hyperspectral imagery in the Mid-Ipoly-Valley. In Proceedings of the 2011 3rd Workshop on Hyperspectral Image and Signal Processing:
Evolution in Remote Sensing (WHISPERS), Lisbon, Portugal, 6–9 June 2011; pp. 1–4.
23. Peerbhay, K.Y.; Mutanga, O.; Ismail, R.; Sensing, R. Random Forests Unsupervised Classification: The Detection and Mapping ofSolanum mauritianumInfestations in Plantation Forestry Using Hyperspectral Data.IEEE J. Sel. Top. Appl. Earth Obs.2015,8, 3107–3122. [CrossRef]
24. Skowronek, S.; Ewald, M.; Isermann, M.; Van De Kerchove, R.; Lenoir, J.; Aerts, R.; Warrie, J.; Hattab, T.; Honnay, O.; Schmidtlein, S.; et al. Mapping an invasive bryophyte species using hyperspectral remote sensing data. Biol. Invasions2017,19, 239–254.
[CrossRef]
25. Adam, E.; Mutanga, O.; Rugege, D. Multispectral and hyperspectral remote sensing for identification and mapping of wetland vegetation: A review.Wetl. Ecol. Manag.2010,18, 281–296. [CrossRef]
26. Cavender-Bares, J.; Gamon, J.A.; Townsend, P.A.Remote Sensing of Plant Biodiversity; Springer Nature: Berlin/Heidelberg, Germany, 2020. [CrossRef]
27. Lass, L.W.; Prather, T.S.; Glenn, N.F.; Weber, K.T.; Mundt, J.T.; Pettingill, J. A review of remote sensing of invasive weeds and example of the early detection of spotted knapweed (Centaurea maculosa) and babysbreath (Gypsophila paniculata) with a hyperspectral sensor.Weed Sci.2005,53, 242–251. [CrossRef]
28. Hestir, E.L.; Khanna, S.; Andrew, M.E.; Santos, M.J.; Viers, J.H.; Greenberg, J.A.; Rajapakse, S.S.; Ustin, S.L. Identification of invasive vegetation using hyperspectral remote sensing in the California Delta ecosystem. Remote Sens. Environ. 2008,112, 4034–4047. [CrossRef]
29. Wan, H.; Wang, C.; Li, Y.; Wang, Q.; Li, J.; Liu, X. Monitoring an invasive plant using hyperspectral remote sensing data.Trans.
Chin. Soc. Agric. Eng.2010,26, 59–63.
30. Fletcher, R.S.; Everitt, J.H.; Yang, C. Identifying saltcedar with hyperspectral data and support vector machines.Geocarto Int.2011, 26, 195–209. [CrossRef]
31. Mirik, M.; Ansley, R.J.; Steddom, K.; Jones, D.; Rush, C.; Michels, G.; Elliott, N. Remote Distinction of a Noxious Weed (Musk Thistle:Carduus Nutans) Using Airborne Hyperspectral Imagery and the Support Vector Machine Classifier.Remote Sens.2013,5, 612–630. [CrossRef]
32. Große-Stoltenberg, A.; Hellmann, C.; Werner, C.; Oldeland, J.; Thiele, J. Evaluation of Continuous VNIR-SWIR Spectra versus Narrowband Hyperspectral Indices to Discriminate the InvasiveAcacia longifoliawithin a Mediterranean Dune Ecosystem.Remote Sens.2016,8, 334. [CrossRef]
Land2021,10, 29 17 of 18
33. Skowronek, S.; Asner, G.P.; Feilhauer, H. Performance of one-class classifiers for invasive species mapping using airborne imaging spectroscopy.Ecol. Inform.2017,37, 66–76. [CrossRef]
34. Paz-Kagan, T.; Silver, M.; Panov, N.; Karnieli, A. Multispectral Approach for Identifying Invasive Plant Species Based on Flowering Phenology Characteristics.Remote Sens.2019,11, 953. [CrossRef]
35. Lawrence, R.L.; Wood, S.D.; Sheley, R.L. Mapping invasive plants using hyperspectral imagery and Breiman Cutler classifications (randomForest).Remote Sens. Environ.2006,100, 356–362. [CrossRef]
36. Kattenborn, T.; Lopatin, J.; Förster, M.; Braun, A.C.; Fassnacht, F.E. UAV data as alternative to field sampling to map woody invasive species based on combined Sentinel-1 and Sentinel-2 data.Remote Sens. Environ.2019,227, 61–73. [CrossRef]
37. Kope´c, D.; Zakrzewska, A.; Halladin-D ˛abrowska, A.; Wylazłowska, J.; Kania, A.; Niedzielko, J. Using Airborne Hyperspectral Imaging Spectroscopy to Accurately Monitor Invasive and Expansive Herb Plants: Limitations and Requirements of the Method.
Sensors2019,19, 2871. [CrossRef] [PubMed]
38. Malenovský, Z.; Lucieer, A.; King, D.H.; Turnbull, J.D.; Robinson, S.A. Unmanned aircraft system advances health mapping of fragile polar vegetation.Methods Ecol. Evol.2017,8, 1842–1857. [CrossRef]
39. Lu, B.; He, Y. Evaluating Empirical Regression, Machine Learning, and Radiative Transfer Modelling for Estimating Vegetation Chlorophyll Content Using Bi-Seasonal Hyperspectral Images.Remote Sens.2019,11, 1979. [CrossRef]
40. Lopatin, J.; Dolos, K.; Kattenborn, T.; Fassnacht, F.E. How canopy shadow affects invasive plant species classification in high spatial resolution remote sensing.Remote Sens. Ecol. Conserv.2019. [CrossRef]
41. Gholami, R.; Fakhari, N. Support vector machine: Principles, parameters, and applications. InHandbook of Neural Computation;
Samui, P., Sekhar, S., Balas, V.E., Eds.; Academic Press: Cambridge, MA, USA, 2017; pp. 515–535. [CrossRef]
42. Cristianini, N.; Shawe-Taylor, J.An Introduction to Support Vector Machines and Other Kernel-Based Learning Methods; Cambridge University Press: Cambridge, UK, 2000.
43. Zhu, X.X.; Tuia, D.; Mou, L.; Xia, G.-S.; Zhang, L.; Xu, F.; Fraundorfer, F. Deep Learning in Remote Sensing: A Comprehensive Review and List of Resources.IEEE Geosci. Remote Sens. Mag.2017,5, 8–36. [CrossRef]
44. Minar, M.R.; Naher, J. Recent advances in deep learning: An overview.arXiv2018, arXiv:1807.08169. [CrossRef]
45. Wani, M.A.; Bhat, F.A.; Afzal, S.; Khan, A.I.Advances in Deep Learning; Springer: Berlin/Heidelberg, Germany, 2020.
46. Pedregosa, F.; Varoquaux, G.; Gramfort, A.; Michel, V.; Thirion, B.; Grisel, O.; Blondel, M.; Prettenhofer, P.; Weiss, R.; Dubourg, V.
Scikit-learn: Machine learning in Python.J. Mach. Learn. Res.2011,12, 2825–2830.
47. Paszke, A.; Gross, S.; Massa, F.; Lerer, A.; Bradbury, J.; Chanan, G.; Killeen, T.; Lin, Z.; Gimelshein, N.; Antiga, L.; et al. PyTorch:
An imperative style, high-performance deep learning library. In Proceedings of the Advances in Neural Information Processing Systems, Vancouver, BC, Canada, 8–14 December 2019; pp. 8024–8035.
48. Abadi, M.; Agarwal, A.; Barham, P.; Brevdo, E.; Chen, Z.; Citro, C.; Corrado, G.S.; Davis, A.; Dean, J.; Devin, M. Tensorflow:
Large-scale machine learning on heterogeneous distributed systems.arXiv2016, arXiv:1603.04467.
49. Kattenborn, T.; Eichel, J.; Wiser, S.; Burrows, L.; Fassnacht, F.E.; Schmidtlein, S. Convolutional Neural Networks accurately predict cover fractions of plant species and communities in Unmanned Aerial Vehicle imagery.Remote Sens. Ecol. Conserv.2020.
[CrossRef]
50. Goel, P.K.; Prasher, S.O.; Patel, R.M.; Landry, J.-A.; Bonnell, R.; Viau, A.A. Classification of hyperspectral data by decision trees and artificial neural networks to identify weed stress and nitrogen status of corn. Comput. Electron. Agric. 2003,39, 67–93.
[CrossRef]
51. Karimi, Y.; Prasher, S.; Patel, R.; Kim, S. Application of support vector machine technology for weed and nitrogen stress detection in corn.Comput. Electron. Agric.2006,51, 99–109. [CrossRef]
52. Guerrero, J.M.; Pajares, G.; Montalvo, M.; Romeo, J.; Guijarro, M. Support vector machines for crop/weeds identification in maize fields.Expert Syst. Appl.2012,39, 11149–11155. [CrossRef]
53. Ishak, A.J.; Mustafa, M.M.; Tahir, N.M.; Hussain, A. Weed detection system using support vector machine. In Proceedings of the 2008 International Symposium on Information Theory and Its Applications, Auckland, New Zealand, 7–10 December 2008; pp.
1–4.
54. Athani, S.S.; Tejeshwar, C. Support vector machine-based classification scheme of maize crop. In Proceedings of the 2017 IEEE 7th International Advance Computing Conference (IACC), Hyderabad, India, 5–7 January 2017; pp. 84–88.
55. Müllerová, J.; Br ˚una, J.; Bartaloš, T.; Dvoˇrák, P.; Vítková, M.; Pyšek, P. Timing Is Important: Unmanned Aircraft vs. Satellite Imagery in Plant Invasion Monitoring.Front. Plant Sci.2017,8. [CrossRef]
56. Horning, N.; Fleishman, E.; Ersts, P.J.; Fogarty, F.A.; Wohlfeil Zillig, M. Mapping of land cover with open-source software and ultra-high-resolution imagery acquired with unmanned aerial vehicles.Remote Sens. Ecol. Conserv.2020. [CrossRef]
57. Sankey, T.T.; McVay, J.; Swetnam, T.L.; McClaran, M.P.; Heilman, P.; Nichols, M. UAV hyperspectral and lidar data and their fusion for arid and semi-arid land vegetation monitoring.Remote Sens. Ecol. Conserv.2018,4, 20–33. [CrossRef]
58. Bareth, G.; Aasen, H.; Bendig, J.; Gnyp, M.L.; Bolten, A.; Jung, A.; Michels, R.; Soukkamäki, J. Low-weight and UAV-based hyperspectral full-frame cameras for monitoring crops: Spectral comparison with portable spectroradiometer measurements.
Photogramm.-Fernerkund.-Geoinf.2015,2015, 69–79. [CrossRef]
59. Jung, A.; Vohland, M.; Magyar, M.; Kovács, L.; Jung, T.; Péterfalvi, N.; Keller, B.; Sillinger, F.; Rák, R.; Szalay, K. Snapshot Hyperspectral Imaging for Field Data Acquisition in Agriculture (in Raspberry Plantation).Deutsch. Ges. Photogramm. Fernerkund.
2019,28, 1–7.