historical structures by the yield-line method
Rayan Mahrouseh
pand Zolt an Orb an
Department of Structural Engineering, Faculty of Engineering and Information Technology, University of Pecs, Boszorkany u. 2, H-7624, Pecs, Hungary
Received: December 31, 2019 • Revised manuscript received: October 2, 2020 • Accepted: November 19, 2020 Published online: May 26, 2021
ABSTRACT
The study demonstrates and evaluates an approach in the structural analysis phase when assessing reinforced concrete slabs.
Due to different values of a parameter in the tests’results, 10 models was crated for thefirst case study and 4 models for the second one.
In order to compare the results in terms of the flexural bearing capacity, the slabs were analyzed by using elastic finite element analysis and yield-line analysis.
Comparing the results shows that minor modification in the parameters associated with bearing capacity and the boundary conditions can affect the adequacy factor considerably, while the parameters those relate to boundary conditions affect the distribution of the yield lines.
KEYWORDS
reinforced concrete slab, existing slab, yield-line analysis, elastic finite element analysis, structural assessment
1. INTRODUCTION
A reinforced concrete slab is the first member in the structural system that subjected receives the external loads directly and transfers it to the other bearing elements [1]. Therefore, it is very important to reach a comprehensive understanding of its structural behavior in terms of designing a new slab or in case of assessing old existing slab to reveal its hidden capacity [2].
The work in this paper is modeling of different slabs using LimitState Slab software to obtain the failure mechanism, which can be an effort and time-consuming procedure when using hand calculations especially in case of a complexfloor plan and different types of supports [3].
1.1. Background
Degradation factors and harmful environments influence the structures and particularly the slabs generally they are unprotected against these environments during the structure life cycle, e.g. salts, porosity water, frosting and defrosting cycle [1]. Under these conditions, several damages may result in the slabs, causing weakness points in the slab and reducing its overall resistance to the external loads. The formation of the cracks weakens the concrete ability to resist aggressive substance, also will expose the reinforcement bars to the risk of corrosion [4].
However, elimination of damages by repairing, strengthening or replacing parts is effective but causes high costs. Many situations do not require the previous full actions if the hidden strength in the slab was revealed, which leads to a search for efficient approach in the assessment strategy that supports the in-practice solutions in term of sustainability [5].
1.2. Aim and scope
The overall aim of the work in this paper is to demonstrate and evaluate an approach in the structural analysis phase when assessing existing old reinforced concrete slabs. The approach adopted the yield-line method in an automated form using the Limit State Slab software. The
Pollack Periodica • An International Journal for Engineering and Information Sciences
16 (2021) 3, 45–51
DOI:
10.1556/606.2020.00170
© 2020 The Author(s)
ORIGINAL RESEARCH PAPER
pCorresponding author.
E-mail:rayanmahrouseh@gmail.com
approach can take a place within the range between linear and non-linear Finite Element (FE) analysis, providing a deeper view of the slab structural response under increasing load to form the failure mechanism, also extracting the reserved capacity in the slab and showing the differences in bearing capacity due to different values of parameters.
2. METHODS USED IN THE ANALYSIS
Previous studies, experiments and tests showed that rein- forced concrete structures have ductile behavior [6]. In addition, many nonlinear simulations preformed on rein- forced concrete slabs to simulate yielding state used the layered model [7]. The plastic theory illustrates this behavior by a stress-strain diagram of the materials.
Analyzing structures using the elastic method considers that failure occurs if any point reached to the limit stress, hence elastic based design will result in overestimated load bearing capacity and uneconomical solution. While the plastic methods of analysis consider the structure will remain in function until the formation of a failure mechanism even if some points in the structure reached a plastic limit [2].
2.1. Yield-line method
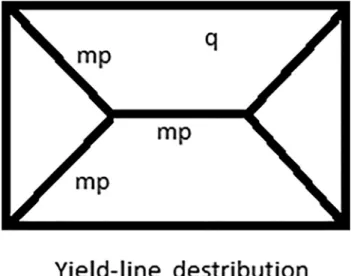
The first introduction of yield line method assumes that the distribution of the bending moment is along main lines, which they are the rupture positions. Then the method was further developed and called yield-line theory [2]. The assumption of the theory considers that the yield lines will form across the slab and the other parts in between remain rigid (seeFig. 1).
Determining the location of the yield lines follows the rules:
‒ Generally, the axes of rotation are located along the lines of supports and pass the columns;
‒ The yield lines are straightforward;
‒ In bordering regions, yield lines pass the intersection point of the regions rotation axes;
‒ Limits of the yield lines are at the slab boundaries.
The analysis procedure starts with proposing a yield-line pattern depending on the geometry and boundary condition of the slab.
In practice, it is very important to propose a few potential patterns then calculate the corresponding collapse loads to determine the critical scenario. By using the virtual work method and the equilibrium method, it is possible to deter- mine the associated collapse load. Applying this approach can be time and effort consuming especially in case of a complex plan and boundary conditions. The main principle used to determine the yield lines is: External work5Internal work [6].
λ3 X
all slab region
q3a3dðqÞ ¼
¼ X
all yield−lines
m3l3jqj;
whereλis the load factor; qis the load pressure per unite area, a is the area of the rigid slab area; dðqÞ is the
displacement of the slab centroid;qis the yield line rotation.
The left side of the equation mp is the resistance plastic moment per unite length;l is the length of the yield line for each part of the slab.
2.2. Limit state slab: an automated yield-line analysis
Many numerical methods were developed and applied to determine the failure mechanism in the plastic analysis.
Discontinuity layout optimization was firstly introduced (by Smith and Gilbert 2007) [8] at the University of Sheffield, providing simple and systematic method to obtain the fail- ure mechanism.
It can identify the failure mechanism in a clear form for the structural engineers despite the complex geometry of the slab in contrast with the traditional methods.
The Limit State Slab is software based on discontinuity layout optimization and the yield-line method. It facilitates the procedure of assessing the load bearing capacity of existing and new reinforced concrete. The software adopts modern optimization techniques to determine the critical yield lines pattern for the target slab automatically. In addition, it supports partial safety factor approach in determining the ultimate limit state of the proposed problem with multiple load cases.
The software produces the solution in the form of Ad- equacy Factor (AF), which is a load multiplier. The factor
“true”value defines the load that will increase tofinally form a collapse-state. The failure mechanism (collapse-state) is where the applied moment exceeds the slab resistance in enough locations. The program can display the deformed shape and animate it, which can display clearly the failure mechanism. In the case of applying multiple load-cases to the problem, the optimization process will calculate the adequacy factor for each, and the lowest value is the critical situation [8].
Fig. 1.Yield-line pattern for a simply supported rectangular slab under distributed load
3. LOAD CASES
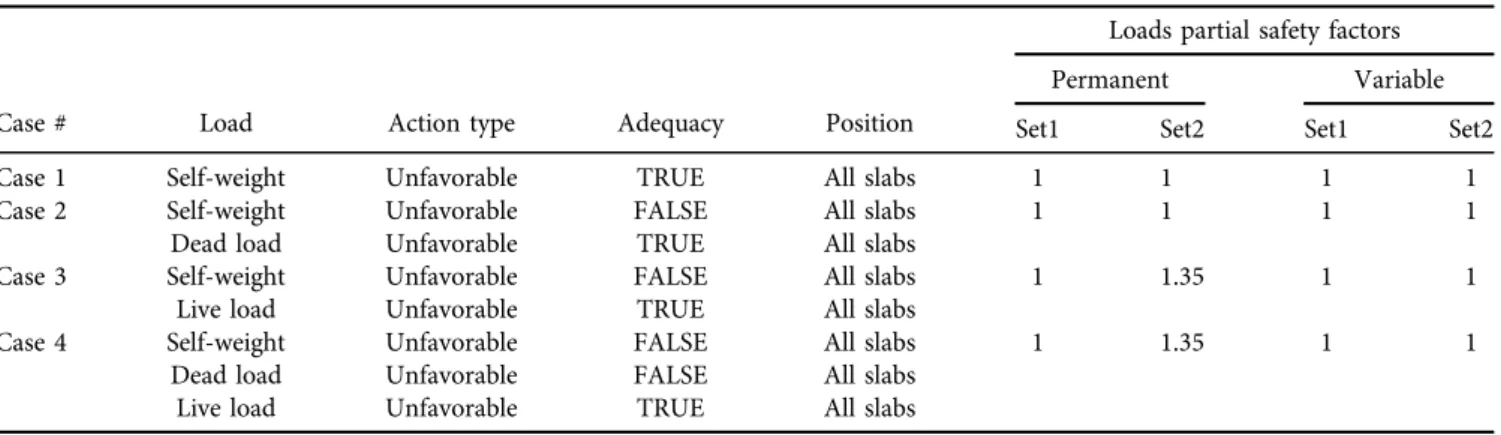
For each case study, all models were analyzed under the same loads, load cases and different sets of Partial Safety Factors (PSF) as it is shown in associated tables Table 1, [9-11]. The“TRUE”value of the adequacy factor refers to the increasing load that will lead eventually to the failure mechanism.
4. CASE STUDY 1, THE CSIKY GERGELY THEATRE
The Csiky Gergely Theatre was the first reinforced concrete structure in Hungary. The opening of theatre was in 1911 in the center of Kaposvar, and it was an impressive architec- tural achievement at that time regarding its semi-cylindrical side and special roofing. The structural system of the building consists of reinforced concrete frames filled by bricks, and solids slabs. The theater has 4 stories in the auditorium section and 2 additional stories in stage section for the props and other theater devices. An inclined roof covers the area above the stage, and major reinforced con- crete frames support it. The diagnostic study conducted on Csiky Gergely Theatre by research group of Faculty of En- gineering and Information Technology, University of Pecs (FEIT UP). The diagnostic report showed different values in different locations when measuring the thickness of the slab (9∼10 cm), the diameter of reinforcement bars (ø10 mm or ø8 mm) the and the characteristic yield strength of used reinforcement (200∼240 MPa), also the slab is reinforced with only one layer (seeFig. 2).
4.1. Elastic analysis
The figure below (Fig. 3) shows the bending moment dis- tribution throughout the slab. In the highlighted regions, the bending moment resulted from the elastic analysis exceeds the ultimate resistance moment. The calculation of the ul- timate resistance moment depended on the amount of the actual reinforcement in the slab.
4.2. The yield-line analysis
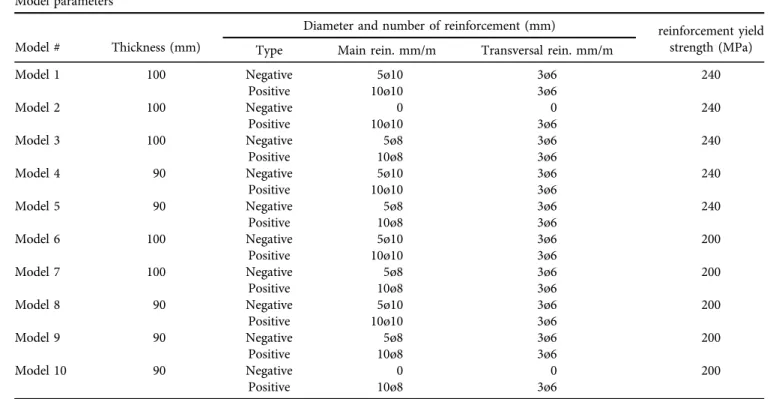
10 models were created to consider all different values of slab parameters when modeling the slab and calculating the resistant plastic moments. Table 2 shows the models’
properties.
The figure below (Fig. 4) shows the yield-lines distribu- tion in the slab, where the light lines reflect the sagging moment and the darker lines reflect the hogging moment, whereas the thickness of the lines expresses the magnitude of Table 1.Load cases and load sets
Case # Load Action type Adequacy Position
Loads partial safety factors
Permanent Variable
Set1 Set2 Set1 Set2
Case 1 Self-weight Unfavorable TRUE All slabs 1 1 1 1
Case 2 Self-weight Unfavorable FALSE All slabs 1 1 1 1
Dead load Unfavorable TRUE All slabs
Case 3 Self-weight Unfavorable FALSE All slabs 1 1.35 1 1
Live load Unfavorable TRUE All slabs
Case 4 Self-weight Unfavorable FALSE All slabs 1 1.35 1 1
Dead load Unfavorable FALSE All slabs
Live load Unfavorable TRUE All slabs
Fig. 2.Case study 1- reinforcement in the slab
Fig. 3.Case study 1, bending moment max. values by elastic analysis
slab rotation. The different values of parameters relate to reinforced concrete bearing capacity do not affect the yielding lines distribution in the slab.
5. CASE STUDY 2, THE GREAT MARKET HALL IN BUDAPEST
The location of the building is in Budapest suburb about 2.3 km from F}ovam square, it is large and well accessible.
Constructing this building was the solution for the growth in population and the trading activities. The construction of the hall was unique because there was no such large-scale building of that size in Hungary at that time.
The floor system consists of 6 identical large flat slabs, as separate units to eliminate the effects of thermal expansion. The superstructure height is 17 m from the ground floor and 4 m is the basement height. The frame and the load-bearing structure of the building are entirely reinforced concrete; the brick walls of the side facades bear their own weight and have no supporting structure. The
roof structure is a Zeiss-Dywidag system made of rein- forced concrete shells. The arches are 6 cm thick, and the edges rely on reinforced concrete girders, which in turn distribute its reactions to the columns along the facades that transfer the load to the foundation. In front of the main façade there is a ramp in order to facilitate the loading and unloading of trucks.
Material properties are determined based on previous measurements by diagnostic and analysis research group of FEIT UP to assess the current situation of the structure and to determine the necessary parameters to examine the structure statically (Fig. 5).
Depending on the original drawings of the building that they are still available in good condition (see Fig. 6); it is possible to determine the slab reinforcement.
Table 2.Case study 1 - models parameters Model parameters
Model # Thickness (mm)
Diameter and number of reinforcement (mm) reinforcement yield strength (MPa) Type Main rein. mm/m Transversal rein. mm/m
Model 1 100 Negative 5ø10 3ø6 240
Positive 10ø10 3ø6
Model 2 100 Negative 0 0 240
Positive 10ø10 3ø6
Model 3 100 Negative 5ø8 3ø6 240
Positive 10ø8 3ø6
Model 4 90 Negative 5ø10 3ø6 240
Positive 10ø10 3ø6
Model 5 90 Negative 5ø8 3ø6 240
Positive 10ø8 3ø6
Model 6 100 Negative 5ø10 3ø6 200
Positive 10ø10 3ø6
Model 7 100 Negative 5ø8 3ø6 200
Positive 10ø8 3ø6
Model 8 90 Negative 5ø10 3ø6 200
Positive 10ø10 3ø6
Model 9 90 Negative 5ø8 3ø6 200
Positive 10ø8 3ø6
Model 10 90 Negative 0 0 200
Positive 10ø8 3ø6
Fig. 4.Case study 1, the model and the distribution of the yield lines
Fig. 5.Case study 2, View of the building
5.1. Elastic analysis
The figure below (Fig. 7) shows the bending moment dis- tribution throughout the slab. In the highlighted regions the bending moment resulted from the elastic analysis exceeds the ultimate resistance moment. The calculation of the ul- timate resistance moment depended on the value of rein- forcement from the original drawings.
5.2. Yield-line analysis
The model’s parameter, in this case, is modeling the slab boundary condition. The external supports ranges between
“supported on perimeter beam - simple support” and
“supported directly on columns-fixed support”and internal supports ranges between“supported at the edge of the col- umn head-fixed support” and “supported directly on the edge of the columnfixed support”. The uncertainty state of the slab supports conditions, is due to shortage of
information about the actual execution of the reinforcement and its current situation. To cover all the cases, 4 models were created. The table below (Table 3) represents the models properties according to proposed boundary condi- tions:
The figure below (Fig. 8and Fig. 9) shows the changing in yielding lines distribution in the slab according to the boundary conditions in each model.
6. DISCUSSION OF RESULTS
Checking the flexural capacity of the slab is through the adequacy factor of a model, for each case study:
Fig. 6.Case study 2, Plan view of the slab
Fig. 7.Case study 2, Bending moment maximum values by FE analysis
Table 3.Case study 2, models parameters
Model # Ext. boundaries Int. boundaries
Model #1 Perimeter beamþcolumns At the edge of column head
Model #2 Only columns At the edge of column head
Model #3 Perimeter beamþcolumns At the edge of column
Model #4 At the edge of column head At the edge of column
Fig. 8.Case study 2, model #1; model #2
Fig. 9.Case study 2, model #3; model #4
For case study 1, 10 models were created regarding the different values of the parameters according to mea- surements, tests and modeling;
For case study 2, 4 models were created as well to cover modeling boundary conditions.
The parameters those relate to reinforced concrete cross section bearing capacity are: the thickness of the slab, diameter and yield strength of the reinforcement, and the parameters those relate to boundary conditions: type of supports (fixed, free, and simple).
The lowest value of the adequacy factor imposes the critical load or critical load case. The necessity of using the partial safety factor is due the accuracy of defining or pre- dicting the loads on the slab. The principle is when (AF < 1 in case of unity PSF or AF < 1.5 when PSF51.5 for live loads and PSF51.35 for permanent load) the slab bearing capacity is inadequate for the assumed load.
Load case 4 appears to be the dominant load case. It includes all the loads and relatively imitates the real status.
6.1. Case study 1, The Csiky Gergely Theatre
Modeling and analyzing the slab with FE software indicates that the slab bending moment value at the supports is higher than the resistance plastic moment in its best scenario (Model 1), see Table 4. However, the resistance plastic moment in middle of the spans shows higher values than the resulted bending moment in case of the best scenario, but the comparison between the resistance and resultant moment in worst scenario, Model 9 and Model 10 shows it is only a slight difference and tends to reach failure state.
The case here is failure state from the elastic analysis point of view and the slab in its current situation is incapable to bear the existing loads (self-weight, dead load) and ex- pected loads (live load). Strengthening solution must be adopted to keep the structure functioning.
The best scenario of the parameters is in Model #1 corresponding to (AF52.929–3.209), which refers directly that the slab is adequate to bear 3 times the assumed live load before failure occurring. The worst scenarios are Model
#9 and Model #10 show that the slab is inadequate to bear the assumed load.
6.2. Case study 2, The Great Market Hall in Budapest
The elastic analysis for Model #1 considering it as the best scenario results in: that the resultant slab bending moment value at the supports and in the middle of the span (in some regions) are higher than the resistance plastic moment in the same regions (seeTable 5).
The case here is failure state from the elastic analysis point of view and the slab in its current situation is incapable to bear the existing loads (self-weight, dead load) and ex- pected loads (live load). Strengthening solution must be adopted to keep the structure functioning.
Model #1 corresponding to AF52.021–2.896, it is the case, which the external boundaries are supported by perimeter beam and considering the internalfixed supports of the slab are at the edge of column head, indicates that the slab is adequate in its current situation. The comparison between the adequacy factor values of Model #1 and the others also shows that modifying in the boundary conditions can affect theflexural capacity for the slab as a whole.
7. CONCLUSION
The objective of the study is to apply the yield-line analysis in assessing existing reinforced concrete slabs statically through an automated method using LimitState Slab soft- ware.
By reviewing the results in the cases study, it can be stated that the resistance of the slab’s section designed by traditional methods and even using linear FE method is very conservative in terms of determining the flexural bearing capacity.
Preforming a parameter study in both cases study to demonstrate and evaluate the capability of the approach of using the automated yield-line method to show how the structural response of the slab can differ by giving different values to the parameters those relate to bearing capacity of the concrete section and in the boundary conditions.
Varying the parameters’ values, those relate to the bearing capacity throughout the whole slab will affect the adequacy factor value (safety level) considerably.
Varying the value of the parameters those are relating to the boundary conditions will affect the adequacy factor value and distribution of the yield lines in the slab too.
Studying the failure mechanism at the end of the analysis helps in determining the potential weak regions in the slab that consider a strengthening intervention.
Minor modification in one parameter can cause a large difference in the overall bearing capacity, hence it is very important when taking measurements and conducting diagnostic tests to be at a high level of accuracy because they reflect the actual strength of the slab.
Table 4.Comparison of moment values between elastic and yield- line analysis
Moment value Scenario
Elastic analysis kN.m/m
Yield-line analysis kN.m/m
At supports Model 1 10.2∼12.7 6.5
Mid span Model
9–10 5∼5.3 6.05
Table 5.Comparison of moment values between elastic and yield- line analysis
Location Scenario Direction
Elastic analysis kN.m/m
Yield-line analysis kN.m/m
At supports Model 1 M11 145.7 63.3
M22 163.5 84.9
Mid span M11 73.5 42.9
M22 79.6 105.6
REFERENCES
[1] J. Shu,“Structural analysis methods for the assessment of rein- forced concrete slabs,” PhD Thesis, Chalmers University of Technology, Gothenburg, 2017.
[2] M. Gilbert, L. He, and T. Pritchard,“The yield-line method for concrete slabs: automated at last,”The Struct. Engineer, vol. 93, no.
10, pp. 44–48, 2015.
[3] L. He,“Rationalization of trusses and yield-line patterns identified using layout optimization,”PhD Thesis, University of Sheffield, Sheffield, 2015.
[4] S. Wu, D. Huang, F. Lin, H. Zhao, and P. Wang,“Estimation of cracking risk of concrete at early age based on thermal stress anal- ysis,”J. Therm. Anal. Calorim., vol. 105, no. 1, pp. 171–186, 2011.
[5] B. Niklas, “Structural assessment procedures for existing concrete bridges, Experiences from failure tests of the Kiruna
Bridge,” Doctoral Thesis, Lulea University of Technology, Lulea, 2017.
[6] G. Kennedy and C. H. Goodchild, Practical Yields Line Design, Camberley: The Concrete Centre, 2004.
[7] J. Fiedler and T. Koudelka,“Numerical modeling of foundation slab with concentrated load,”Pollack Period., vol. 11, no. 3, pp.
119–129, 2016.
[8]LimitState: SLAB Manual, VERSION 2.0.b, LimitState Ltd, Shef- field, 2016.
[9]EN 1990:2002, Eurocode, Basis of structural design, European Committee for Standardization, Brussels, 2002.
[10]EN 1991-1-1:2002, Eurocode 1, Action on structures, Part 1-1, General actions, Densities, self-weight, imposed loads for build- ings, European Committee for Standardization, Brussels, 2002.
[11]EN 1992-1-1:2004, Eurocode 2, Design of concrete structures, Part 1-1, General rules and rules for buildings, European Committee for Standardization, Brussels, 2004.
Open Access. This is an open-access article distributed under the terms of the Creative Commons Attribution 4.0 International License (https://creativecommons.org/
licenses/by/4.0/), which permits unrestricted use, distribution, and reproduction in any medium, provided the original author and source are credited, a link to the CC License is provided, and changes–if any–are indicated. (SID_1)