Multi-species occupancy modeling provides novel insights into amphibian metacommunity structure and wetland restoration
ANDREWJ. HAMER ,1,2,4De´NESSCHMERA,2ANDMICHAELJ. MAHONY3
1Centre for Ecological Research, GINOP Sustainable Ecosystems Group, Klebelsberg K. u. 3, Tihany H-8237 Hungary
2Centre for Ecological Research, Balaton Limnological Institute, Klebelsberg K. u. 3, Tihany H-8237 Hungary
3School of Environmental and Life Sciences, The University of Newcastle, Callaghan, New South Wales 2308 Australia Citation:Hamer, A. J., D. Schmera, and M. J. Mahony. 2021. Multi-species occupancy modeling provides novel insights into amphibian metacommunity structure and wetland restoration. Ecological Applications 31(4):e02293. 10.1002/eap.2293
Abstract. A fundamental goal of community ecology is to understand species–habitat rela- tionships and how they shape metacommunity structure. Recent advances in occupancy mod- eling enable habitat relationships to be assessed for both common and rare species within metacommunities using multi-species occupancy models (MSOM). These models account for imperfect species detection and offer considerable advantages over other analytical tools com- monly used for community analyses under the elements of metacommunity structure (EMS) framework. Here, we demonstrate that MSOM can be used to infer habitat relationships and test metacommunity theory, using amphibians. Repeated frog surveys were undertaken at 55 wetland sites in southeastern Australia. We detected 11 frog species from three families (Limnodynastidae, Myobatrachidae, and Pelodryadidae). The rarest species was detected at only one site whereas the most common species was detected at 42 sites (naive occupancy rate 0.02–0.76). Two models were assessed representing two competing hypotheses; the best-sup- ported model included the covariates distance to the nearest site (connectivity), wetland area, presence of the non-native eastern mosquitofish (Gambusia holbrooki), proportion cover of emergent vegetation, an interaction term betweenGambusiaand emergent vegetation cover, and the proportion canopy cover over a site. Hydroperiod played no detectable role in meta- community structure. We found species–habitat relationships that fit with current metacommu- nity theory: occupancy increased with wetland area and connectivity. There was a strong negative relationship between occupancy and the presence of predatoryGambusia, and a posi- tive interaction betweenGambusia and emergent vegetation. The presence of canopy cover strongly increased occupancy for several tree frog species, highlighting the importance of ter- restrial habitat for amphibian community structure. We demonstrated how responses by amphibians to environmental covariates at the species level can be linked to occupancy pat- terns at the metacommunity scale. Our results have clear management implications: wetland restoration projects for amphibians and likely other taxa should maximize wetland area and connectivity, establish partial canopy cover, and eradicateGambusiaor provide aquatic vegeta- tion to mitigate the impact of this non-native fish. We strongly advocate the use of MSOM to elucidate the habitat drivers behind animal occupancy patterns and to derive unbiased occu- pancy estimates for monitoring programs.
Key words: Bayesian modeling; conservation; declining amphibians; frog community;Gambusia hol- brooki; habitat; metacommunity; species richness; wetland management.
INTRODUCTION
A fundamental goal of community ecology is to understand how environmental and spatial factors drive species–habitat patterns locally and shape metacommu- nity structure at larger spatial scales (Vellend 2010). Sets of local communities of animal species are frequently distributed across landscapes as metacommunities,
which are linked by dispersal of multiple species (Lei- bold et al. 2004). Understanding metacommunity theory requires ecologists to often apply complex models that provide insight into how species respond to environmen- tal parameters, and how species responses collectively shape the entire community. Species-specific models of the probability of occupancy, corrected for detection bias, are frequently implemented to determine habitat and landscape relationships within ecological communi- ties (MacKenzie et al. 2002). However, rarity in occur- rence may preclude the assessment of species detected at few survey sites in single-species occupancy models due to sparse data sets.
Manuscript received 26 April 2020; revised 22 July 2020;
accepted 6 October 2020. Corresponding Editor: Jacob R.
Goheen.
4E-mail: a.hamer@unimelb.edu.au
Article e02293; page 1
This is an open access article under the terms of the Creative Commons Attribution License, which permits use, distribution and reproduction in any medium, provided the original work is properly cited.
Multi-species occupancy models (MSOM) can derive inferences regarding habitat relationships for rare species and provide insights into species richness and other bio- diversity metrics (Dorazio and Royle 2005, Kery and´ Royle 2008). The first explicit description of hierarchical models for estimating species richness and species responses to habitat fragmentation was formulated by Zipkin et al. (2009). The key advantage of using a hierar- chical modeling framework over single-species models for estimating species occupancy is that they account for individual species responses to a parameter of interest, as well as the aggregated response by the whole commu- nity, which increases precision in estimates for infre- quently observed species through the use of collective community data (K´ery and Royle 2008, Zipkin et al.
2009).
Multi-species occupancy models also address the issue of imperfect species detection that often bias the statis- tics commonly used for community analyses under the elements of metacommunity structure (EMS) framework (Leibold and Mikkelson 2002). The EMS is a set of ana- lytical tools that uses species occurrence data to identify and classify metacommunity structure and link it to underlying environmental gradients (Mihaljevic et al.
2015). This framework was extended by Mihaljevic et al.
(2015) to account for imperfect detection of species at sites under the detection error-corrected EMS (DECEMS) framework, which integrates MSOM into the EMS framework thereby reducing bias in character- izing metacommunity structure by using occupancy models to uncouple species-specific occupancy and detection probabilities. Simulation modeling has also been used to demonstrate that the detection of meta- community patterns under the EMS framework is prone to Type II error (Schmera et al. 2018), which is analo- gous to a false negative result due to the failed detection of a species at a site (Guillera-Arroita and Lahoz-Mon- fort 2012). Multi-species occupancy models can be used to better inform how species-specific responses to envi- ronmental covariates can scale up to affect metacommu- nity-wide patterns of occupancy, thereby addressing a key gap within the EMS framework by improving the ability to link species-level processes to metacommunity structure (Mihaljevic et al. 2015).
Application of MSOM can provide insight into funda- mental concepts of metacommunity theory. Spatially explicit multi-species models that test the effect of dis- tance between habitat patches can shed light on the dis- persal processes underpinning a metacommunity, such as the mass-effect perspective that focuses on the effect of immigration and emigration on local population dynamics (Leibold et al. 2004). Also, because metacom- munity theory is largely an extension of metapopulation theory, which emphasizes greater species persistence with increased patch size and connectivity (Hanski 1994, 1998), larger, less-isolated patches should also support a greater number of species. Models that assess species responses to environmental gradients by including
abiotic and biotic variables relating to local habitat qual- ity essentially test the species-sorting perspective of metacommunity theory. This perspective emphasizes that heterogeneity in local patches instigates strong dif- ferences in the local demography of species, which occurs through the dispersal of species tracking local environmental conditions, but also emphasizes that spa- tial niche separation among species is more important than spatial dynamics (Leibold et al. 2004). The identifi- cation of important habitat parameters in MSOM can also guide management actions for individual species and communities (Zipkin et al. 2010, Maphisa et al.
2019).
Ecological concepts such as the response of aquatic communities to freshwater habitat gradients can be examined using MSOM. This hypothesis emphasizes that lentic waterbodies exist along a gradient from ephemeral to permanent ponds, where community struc- ture is determined by abiotic factors (e.g., pond drying) and biotic factors, particularly predation by fish (Well- born et al. 1996). The distribution of aquatic taxa along the gradient is largely governed by individual species’ life-history traits whereby species can have faster devel- opment rates in short-lived (ephemeral, typically fish- free) aquatic habitats, but are vulnerable to predation by fish in more permanent waterbodies (Wellborn et al.
1996). Conversely, species with anti-predator defenses but slower development rates may survive well in perma- nent waterbodies with fish but suffer catastrophic losses in more ephemeral ponds when they dry out (e.g., amphibians; Kats et al. 1988, Semlitsch 2000). The net result of these patterns in species adaptability is distinct patterns in community composition along the perma- nence gradient (Wellborn et al. 1996, Snodgrass et al.
2000a). Moreover, pond drying should be viewed as an environmental disturbance or perturbation, which results in radical changes to the abiotic and biotic condi- tions of the waterbody (Urban 2004). Consideration of wetland hydroperiod and fish predation into metacom- munity studies of freshwater ecosystems would provide fundamental insight into community structure and greatly inform conservation management.
Amphibian communities are inherently suited to test ideas surrounding metacommunity theory as aquatic- breeding species are restricted to breeding in freshwater ponds and wetlands embedded in a mosaic of terrestrial (non-breeding) habitat, and have complex life histories with larvae that metamorphose to a terrestrial stage and juveniles and adults that often disperse widely (Wilbur 1987). Accordingly, amphibian communities hold great potential for advancing a synthesis of local and regional processes in metacommunity ecology (Werner et al.
2007, 2009).
Globally, amphibian species have been declining and there is an urgent need to implement effective monitor- ing and management programs if we are to identify trends in occupancy patterns, to elucidate the proximate drivers of declines such as habitat change, and to
implement habitat restoration that halts or reverses decreases in the proportion of sites occupied (Adams and Muths 2019, Sterrett et al. 2019). MSOM have been integrated into a structured decision-making approach to inform the management of amphibian communities, based on the inclusion of key habitat variables (hydrope- riod, area, and connectivity) linked to important man- agement decisions (Grant et al. 2013). These models have also been used to evaluate anthropogenic impacts to amphibian communities and management practices (Muncy et al. 2014, Guzy et al. 2018, 2019). Rare amphibian species require sufficient data to inform man- agement practices underpinned by clear inferences, yet these data are hard to obtain due to their rarity (MacKenzie et al. 2005). This constraint may be over- come by using MSOM to essentially borrow information from more frequently detected species to improve the precision of parameter estimates for these data-poor spe- cies (Zipkin et al. 2009).
Here, we used MSOM to elucidate the spatial, biotic and abiotic factors driving community structure in a frog metacommunity, and to provide unbiased estimates of the probability of occupancy for each species inhabiting a coastal wetland system in southeastern Australia. A previ- ous study of the habitat relationships within this meta- community was constrained because the statistical methods used could not provide inferences for rare and very common species detected at wetland sites (Lane et al. 2007). There has also been extensive research con- ducted at the site on the endangered green and golden bell frog (Litoria aurea) that has examined relationships between occupancy and various habitat and landscape variables (e.g., Hamer et al. 2002a, Hamer and Mahony 2010, Valdez et al. 2015). However, these studies have not considered species occupancy within the entire frog meta- community. Therefore, we provide a fresh perspective into species–habitat relationships for this site and use our find- ings to test perspectives of metacommunity theory. We also provide new insight into the relationship between the non-native eastern mosquitofish (Gambusia holbrooki;
hereafter referred to as Gambusia) and patterns in frog occupancy. This small fish has been implicated in the decline ofLit. aureadue to predation on eggs and larvae (Pyke and White 2001, Hamer et al. 2002b, Remon et al.
2016) and we examined the interactions betweenGambu- sia, aquatic habitat complexity and wetland hydroperiod, in line with the models of freshwater community structure proposed by Wellborn et al. (1996).
We predicted that individual species relationships between both local and landscape variables would shape metacommunity structure, thereby connecting metacom- munity patterns to species-level processes and demon- strating how MSOM can test general ecological theories.
We also discuss the implications of our findings for wet- land restoration projects that can provide land managers with informed guidance on wetland creation and man- agement for amphibians and other wetland-dependent taxa.
METHODS
Study area
We conducted our study at 55 waterbodies on Koora- gang Island in southeastern Australia (see Google Earth image, Data S1). Kooragang Island (approximately 2,560 ha) is located in the Hunter River estuary, approx- imately 5 km northwest of Newcastle, New South Wales (32°500–32°540S, 151°420–151°470E). Kooragang Island was originally comprised of deltaic islands that were ini- tially used for agriculture. Land reclamation commenced after 1950 to consolidate the southeastern portion of the island into an industrial area, which is used for disposal of industrial waste and supports infrastructure associ- ated with a large coal-loading terminal. The northwest- ern (agricultural) end of the island was formerly grazing land but was managed as the Kooragang Wetland Reha- bilitation Project at the time of the study. This area is now managed as the Hunter Wetlands National Park.
The industrial and agricultural areas support a mosaic of freshwater wetlands varying in size and hydroperiod, interspersed with brackish wetlands in estuarine areas (Hamer et al. 2008). Thirteen frog species have been pre- viously recorded from the study area (Lane et al. 2007).
Further recent descriptions of the study area are in Val- dez et al. (2015).
Frog surveys
Frog surveys were conducted at 55 waterbodies over two breeding seasons, September–April in 2000–2001 and 2001–2002. This survey period covers the breeding season for spring- and summer-breeding frog species.
Thirty-two sites were included in a mark–recapture study forLitoria aureafocusing on waterbodies inhab- ited by the core of the population in the industrial and estuarine areas. The mark–recapture study comprised a maximum of 28 standardized nocturnal surveys at 32 sites, divided into 14 surveys at each site per year (for survey details see Hamer and Mahony 2007, 2010). Sur- veys at the remaining 23 sites were conducted mostly five times, two surveys in 2000–2001 and three surveys in 2001–2002. Seventeen sites were situated in the industrial area, and 38 sites were located in the agricultural and estuarine areas. Site selection included a range of water- body types so that the 55 sites were considered to be rep- resentative of the heterogeneity present in the wetland system.
Nocturnal surveys comprised quiet listening at each waterbody for approximately 10 minutes to detect call- ing male frogs (Scott and Woodward 1994). Frog species present in the local region have distinct mating calls and so there was minimal risk of misidentifications (i.e., false positive detections). Searches for frogs were then con- ducted in waterbodies with a head-mounted light using a standard visual encounter survey technique (Crump and Scott 1994). The surrounding terrestrial habitat
including trees and shrubs within 10 m of the waterbody was also searched. Surveys were mostly done by one per- son (A. J. Hamer), with survey effort for visual searches conducted in proportion to waterbody area and vegeta- tion complexity. Air temperature and water levels were measured at the start of each survey, because detectabil- ity of amphibians is often affected by ambient tempera- ture (Weir et al. 2005) and the availability of water at a site (Alford and Richards 1999). In limited instances when air temperature was not recorded during a survey, the mean temperature recorded from other sites on that same night was used, or when temperature was not recorded on a survey night, we used the minimum tem- perature recorded that night at the nearest weather sta- tion, within 5 km of the study area (University of Newcastle).
Habitat variables
Wetland area was recorded for each site using digitized maps and a Geographical Information System (MapInfo 4.5, MapInfo Corp., Troy, New York, USA) and Google Earth imagery (dated 10 January 2007 to account for the historical nature of the data set). The distance to the nearest wetland site was also measured using these meth- ods; however, we excluded sites where no frog species were detected or highly ephemeral sites, as these sites are unlikely to contribute to population persistence. We used water levels recorded at a site to determine hydroperiod:
permanent waterbodies were not observed to dry out over the two seasons; ephemeral waterbodies dried out on one or more occasions. Wetland ephemerality was scored as a binary variable (permanent wetlands, 0;
ephemeral wetlands, 1). The proportion of the water- body surface area covered by emergent vegetation and canopy overstory was recorded. Emergent vegetation included aquatic plants that extended above the water surface, whereas canopy overstory included trees and shrubs (>5 m in height; live or dead) around the wetland perimeter. The presence of Gambusiawas recorded by visual examination of the water column and dip-netting during diurnal site visits (see Hamer et al. 2008, Hamer and Mahony 2010). Descriptive statistics of habitat vari- ables recorded in the study area are in Appendix S1:
Table S1.
Data analysis and modeling
We used hierarchical Bayesian modeling to estimate community-level and species-specific responses to six habitat covariates: distance to the nearest wetland site (Distsite), wetland area (Area), presence/absence of Gambusia(Fish), proportion emergent vegetation cover (Emergveg), wetland ephemerality (Ephemerality), and proportion canopy cover (Canopy). There is widespread evidence that all six covariates are important determi- nants of amphibian occupancy, and the inclusion of each covariate examined six different components of
metacommunity or ecological theory (Appendix S2:
Table S1). Hydroperiod and fish presence are strong structuring forces of amphibian communities and so should be included in any model of expected amphibian community structure (Pechmann et al. 1989, Wellborn et al. 1996, Snodgrass et al. 2000a).
We also included survey-specific covariates to jointly estimate the probability of detection: number of days since 1 September (Days) to capture detection since the start of the field surveys and corresponding to the begin- ning of the activity season for spring-breeding frogs, including a quadratic term (Days2) to potentially cap- ture the window of activity for each species; air tempera- ture (Temp); whether a site had standing water during a survey or was otherwise dry (Wetness: 0, dry; 1, wet);
and survey year (Year: 1, 2000–2001; 2, 2001–2002). We assumed that the frog metacommunity was closed over the 2 yr during the study (i.e., the species pool remained constant), but added a year effect to account for poten- tial variation in frog activity (detection) between the two seasons due to annual fluctuations in seasonality (see Zipkin et al. 2009). Survey date (time since September) has been shown to influence detection probabilities for several frog species in southeastern Australia (Canessa et al. 2012, Heard et al. 2015). High water levels and higher temperatures have been shown to increase the probability of detection forLit. aureain the study area (Hamer and Mahony 2010).
We implemented the original species richness hierar- chical model developed by Zipkin et al. (2009) as modi- fied by others for examining responses by reptile and amphibian communities to anthropogenic impacts (Guzy et al. 2013, 2018, Hunt et al. 2013, Muncy et al.
2014). This hierarchical model links species-specific detection and occupancy, and is a much more informa- tive extension of the single-species hierarchical linear models used to estimate site occupancy rates of species with imperfect detection probabilities (Dorazio and Royle 2005, Dorazio et al. 2006, Kery and Royle 2008).´ Hierarchical multi-species models consider all occu- pancy and detection parameters as random effects rather than deterministic relations among parameters and pro- cesses, which improves estimation of individual parame- ters for individual species by considering each within the context of a group of related variables (Link 1999, Link et al. 2002). This approach increases the precision of estimates for rare or elusive species by also considering each within the context of the broader community (Sauer and Link 2002, Russell et al. 2009). Therefore, by generating separate estimates for species-specific occu- pancy and detection probabilities and then relating each to species richness, species-level and community-level information is combined into the same modeling frame- work (Dorazio and Royle 2005, Zipkin et al. 2009, Hunt et al. 2013). Essentially, models of data-poor species bor- row information from more frequently detected or data- rich species in order to improve precision and predictive ability for parameter estimates of rare species (Zipkin
et al. 2009). Therefore, estimates for these rarely observed species are drawn towards group averages (“Bayesian shrinkage”toward the mean; Link 1999).
The statistics underpinning the multi-species hierar- chical model we used have been described by others (e.g., Guzy et al. 2013, 2018, Hunt et al. 2013, Muncy et al.
2014) but are summarized here. The first level of the model assumed a true (but only partially observed) pres- ence–absence matrixzi,jfor speciesi=1, 2,. . .,Nat site j=1, 2,. . .,J, wherezi,j=1 if speciesiwas present at site j, andzi,j=0 if the species was absent. Becausezi,jwas uncertain, an occurrence model was specified wherezi,j~ Bern(Ψi,j), andΨi,jis the probability that speciesioccurs at sitej. The state variablezi,jis usually not known with certainty; instead, we observed dataxi,j,kfor speciesiat sitejduring sampling periodk, which are also assumed to be Bernoulli random variables if speciesiis present (Zipkin et al. 2009). Based on the survey data collected, we generated species-specific observance matrices for up to 28 sampling occasions at each of 55 sites where detec- tion was represented as 1, and non-detection was repre- sented as 0. Thus, the data provided a three-dimensional matrixxi,j,k for species iat sitej for the kth sampling occasion. The second level of the model (observation model) specified thatxi,j,k~Bern(θi,j,k×zi,j) wherezi,jis the true occurrence matrix described above, andθi,j,k is the detection probability for speciesiat sitejfor thekth sampling occasion.
Prior to modeling, multicollinearity was assessed among the habitat variables using Pearson correlation coefficients (r) for pairwise comparisons of continuous variables, and Spearman rank correlation coefficients for binary variables (rs; Appendix S3: Table S1). There was a strong correlation between emergent vegetation cover and wetland ephemerality (rs=0.58); therefore, these two variables were not included in the same model.
There was no strong correlation between the presence of Gambusiaat a site and ephemerality (rs=–0.11), or the other four variables (Appendix S3). Accordingly, we assessed two competing metacommunity hypotheses relating primarily to the effects ofGambusia, emergent vegetation cover and ephemerality on the frog metacom- munity. Model 1 included the following equations to relate species-specific covariate parameters (αandβval- ues), and occupancy and detection probabilities (Ψi,jand
θi,j,k, respectively) to the hierarchical models previously
described
Model 1:logitðΨi,jÞ ¼uiþα1iðDistsitejÞ þα2iðAreajÞ þα3iðFishjÞ þα4iðEmergvegjÞ þα5i FishjEmergvegj
þα6iðCanopyjÞ
logitðθi,j,kÞ ¼viþβ1iðDaysj,kÞ þβ2iðDays2j,kÞ þβ3iðTempj,kÞ þβ4iðWetnessj,kÞ þβ5iðYearj,kÞ
whereuiandviare species-level effects andαjandβjare site-level effects on occupancy and detection, respec- tively. Model 1 tested for a potential interaction between
the presence ofGambusiaat a site and emergent vegeta- tion cover, because aquatic vegetation may ameliorate Gambusiapredation on amphibians by providing habitat complexity as refugia (Baber and Babbitt 2004). Model 2 included the following equation for the species-specific occupancy parameters, while retaining the same parame- ters for detection probabilities as in Model 1
Model 2:logitðΨi,jÞ ¼uiþα1iðDistsitejÞ þα2iðAreajÞ þα3iðFishjÞ þα4iðEphemeralityjÞ þα5iFishjEphemeralityj
þα6iðCanopyjÞ
Model 2 tested for a potential interaction between the presence ofGambusiaat a site and wetland ephemerality, becauseGambusiaoccupancy may be lower in ephemeral wetlands (Pyke 2008) and hydroperiod can have a strong influence in shaping amphibian communities in wetlands (Wellborn et al. 1996). The covariate Distsite was included in both models to account for spatial non-inde- pendence among sites. One frog species has a spatially aggregated distribution in the study area (Lit. aurea;
Hamer et al. 2002a) indicating potential spatial autocor- relation among sites. Failing to account for spatial auto- correlation can lead to biased parameter estimates (Wintle and Bardos 2006) and should be an important consideration in amphibian occupancy studies (Ficetola 2015). However, there are no apparent barriers to frog movement in the study area and microchippedLit. aurea have been detected moving between the industrial and estuarine areas (Hamer et al. 2008). The variables Area and Distsite were log10(x)-transformed prior to analysis.
Continuous variables were standardized prior to analysis by converting tozscores (i.e., the mean was subtracted from each value and then divided by the standard devia- tion). Standardized covariates allowed direct compar- ison of model coefficients so that the relative importance of each covariate could be determined according to the magnitude of the coefficient. Missing values for survey- specific (detection) covariates at sites were replaced by the mean for that variable.
Both models therefore contained 13 species-specific parameters (ui,α1i,α2i,α3i,α4i,α5i,α6i,vi,β1i,β2i,β3i,β4i, β5i). An additional hierarchical component of the model was added by estimating community summaries (µ), which assume that the species-level parameters are ran- dom effects, each governed by a community-level hyper- parameter (Zipkin et al. 2009). For example,α1i~N(µα1, σα1) whereµα1is the mean community response (across species) to the Distsite covariate, andσα1is the standard deviation inα1among species.
We estimated model parameters and community sum- maries using a Bayesian analysis of the model with unin- formative priors for the hyper-parameters (i.e., U[−5, 5]
forαandβ, U[0, 10] forσ, and U[−10, 10] forμparame- ters), and species-specific model coefficients were trun- cated at5 fromμto avoid traps (see Guzy et al. 2018).
We calculated the mean and standard deviation of the model coefficients, and the 2.5th and 97.5th percentiles
of the posterior distribution, which represents a 95%
Bayesian credible interval (BCI). Parameter estimates of covariates with a BCI that did not overlap zero were considered to be clearly more important, whereas esti- mates with a BCI overlapping zero had greater uncer- tainty. However, some minor overlap of the BCI with zero was tolerated in inferring relationships (see Cum- ming and Finch 2005). Species-specific occupancy and detection estimates were derived using the log transfor- mation (exp(α)/(1+exp(α))). We estimated species rich- ness (number of species at a site) by summing the estimated probability of occupancy for each species detected at a site. We used Pearson correlation coeffi- cients in post hoc analyses to assess relationships between the mean estimated number of species and the four continuous covariates.
Data analyses were performed in the software pro- gram OpenBUGS 3.2.3 (Spiegelhalter et al. 2014) using R2WinBUGS (Sturtz et al. 2005). Each model was run using three replicate Markov chain Monte Carlo (MCMC) iterations to generate 40,000 samples from the posterior distribution of each model after discarding a
“burn-in”of 20,000 samples, with a thinning rate of 3.
The Gelman-Rubin statistic was checked for all esti- mated parameters and was found to indicate acceptable convergence (i.e.,R^<1.05; Gelman and Rubin 1992).
The relative fit of Model 1 and Model 2 was assessed using the Deviance Information Criterion (DIC; Spiegel- halter et al. 2002). The use of DIC for ranking hierarchi- cal occupancy models has been recently questioned, mainly because of the models’ latent parameters (Hoo- ten and Hobbs 2015) or because the model is sensitive to parameterization (Gelfand et al. 2006; also see Broms et al. 2016). However, despite the criticisms, DIC remains one of the most frequently used methods for ranking Bayesian hierarchical models (Hooten and Hobbs 2015) and is still advocated by others for ecologi- cal prediction (e.g., Stevens and Conway 2019). The best-supported model was the one with the lowest DIC value and greater than two units from the competing model. We also computed Bayesian Pvalues to assess model fit; a model with a good fit to the data has aP value near 0.5 (Gelman et al. 1996).
RESULTS
Frog detections
During the 2000–2001 and 2001–2002 breeding sea- sons 980 surveys were conducted at 55 wetland sites (mean=18 surveys per site; range: 4–28). A total of 11 frog species were detected (3.9 1.9 species per site [mean SD], range: 0–8), representing the taxonomic families Limnodynastidae and Myobatrachidae (ground frogs), and Pelodryadidae (tree frogs). No frogs were detected at two sites. The most frequently detected spe- cies was the striped marsh frog (Limnodynastes peronii;
naive occupancy rate=0.76), followed by the common
eastern froglet (Crinia signifera; 0.71) and the eastern dwarf tree frog (Litoria fallax; 0.71), whereas the Jervis Bay tree frog (Lit. jervisiensis) was detected at only one site (naive occupancy rate=0.02). A further three spe- cies were detected at fewer than five sites: green tree frog (Lit. caerulea), broad-palmed frog (Lit. latopalmata), and ornate burrowing frog (Platyplectrum ornatum). The remaining four species (spotted grass frogLim. tasman- iensis, green and golden bell frogLit. aurea, bleating tree frog Lit. dentata, Peron’s tree frog Lit. peronii) were detected at 8–34 sites (naive occupancy rates: 0.15–0.62).
All species detected are native, reproduce in water and have free-swimming aquatic larvae.
The mean estimated number of frog species (species richness) at a site was 4.7 (4.0–6.2), which is slightly higher than the naive mean species richness. The mean probability of occupancy across all species was 0.549 (95% BCI: 0.193–0.871), whereas the mean probability of detection was 0.092 (0.039–0.175). Mean estimated prob- abilities of occupancy varied widely among the frog spe- cies detected, ranging from 0.039 (95% BCI: 0.008–0.246) forLit. jervisiensisto 0.940 (0.725–0.990) forLim. peronii (Table 1). Mean estimated probabilities of detection were also highly variable among the 11 frog species, ranging from 0.036 (95% BCI: 0.010–0.108) for Lit. dentatato 0.283 (0.176–0.410) forLit. fallax(Table 1).
Model inference and fit
The best-supported model included the proportion cover of emergent vegetation (Model 1; DIC=4605.2).
There was no support for the model that included wet- land ephemerality (Model 2; DIC=4658.0). Moreover, there was no clear relationship between ephemerality and the mean estimated probability of occupancy (Appendix S4: Table S1). Bayesian P values for both models were close to 0.5 indicating acceptable model fit (Model 1,P=0.428; Model 2,P=0.433).
Community-level summary
There was a clear negative relationship between the mean estimated probability of occupancy across all frog species and distance to the nearest site (μα1; Table 2).
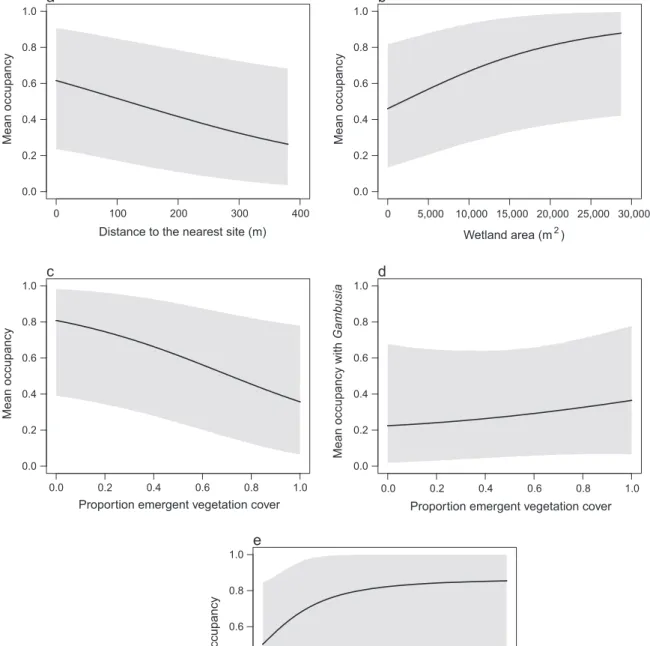
Mean occupancy was predicted to decrease from 0.627 at the site nearest to another site to 0.267 at the most distant site (Fig. 1a). There was a clear positive relation- ship between mean occupancy and wetland area (μα2; Table 2). Mean occupancy was predicted to increase from 0.470 to 0.882 at the smallest to largest sites, respectively (Fig. 1b).
There was a clear negative relationship between mean community occupancy and the presence of Gambusia and this response was the strongest among the covariates examined (μα3=–1.223; Table 2). Mean occupancy was predicted to decrease from 0.555 (95% BCI:
0.194–0.875) at sites with noGambusiapresent, to 0.210 (0.040–0.545) at sites withGambusiapresent. There was
also a negative relationship between mean occupancy and emergent vegetation cover (μα4; Fig. 1c), although the 95% BCI overlapped zero slightly (Table 2).
There was a strong positive interaction between the presence of Gambusia and emergent vegetation cover (μα5=1.183, 95% BCI: 0.269–2.162; Table 2).
TABLE1. Summary of model-estimated occupancy and detection probabilities for 11 frog species from three families detected on Kooragang Island, Australia.
Occupancy Detection
Species Occupancy 95% BCI Detection 95% BCI
Limnodynastidae
Limnodynastes peronii 0.940 0.725–0.990 0.114 0.062–0.192
Lim. tasmaniensis 0.936 0.749–0.989 0.064 0.028–0.125
Platyplectrum ornatum 0.099 0.015–0.434 0.075 0.022–0.220
Myobatrachidae
Crinia signifera 0.938 0.770–0.988 0.093 0.045–0.174
Pelodryadidae
Litoria aurea 0.721 0.374–0.916 0.200 0.099–0.354
Lit. caerulea 0.129 0.016–0.603 0.039 0.009–0.144
Lit. dentata 0.503 0.143–0.901 0.036 0.010–0.108
Lit. fallax 0.936 0.736–0.988 0.283 0.176–0.410
Lit. jervisiensis 0.039 0.008–0.246 0.066 0.014–0.244
Lit. latopalmata 0.065 0.009–0.345 0.065 0.017–0.211
Lit. peronii 0.707 0.321–0.945 0.038 0.012–0.101
Notes: Estimates were extracted from Model 1. Estimates include 95% Bayesian credible intervals (BCI).
TABLE2. Summary of hyper-parameters for occupancy (α) and detection (β) covariates across all 11 frog species detected on Kooragang Island.
Community-level hyper-parameter
Mean SD 95% BCI
Variable Definition
μα1 Distsite –0.463 0.221 –0.923 to–0.047
σα1 Distsite 0.281 0.230 0.008 to 0.844
μα2 Area 0.497 0.249 0.008 to 0.996
σα2 Area 0.461 0.298 0.030 to 1.163
μα3 Fish –1.223 0.577 –2.381 to–0.128
σα3 Fish 0.740 0.551 0.029 to 2.050
μα4 Emergveg –0.871 0.469 –1.816 to 0.030
σα4 Emergveg 0.915 0.419 0.221 to 1.897
μα5 Fish×Emergveg 1.183 0.478 0.269 to 2.162
σα5 Fish×Emergveg 0.673 0.457 0.041 to 1.760
μα6 Canopy 0.823 0.826 –0.771 to 2.518
σα6 Canopy 2.188 0.864 0.794 to 4.198
μβ1 Days –0.712 0.201 –1.090 to–0.297
σβ1 Days 0.198 0.184 0.008 to 0.677
μβ2 Days2 0.678 0.228 0.204 to 1.097
σβ2 Days2 0.394 0.193 0.157 to 0.892
μβ3 Temp 0.136 0.077 0.000 to 0.305
σβ3 Temp 0.151 0.089 0.020 to 0.369
μβ4 Wetness 0.612 0.296 0.023 to 1.197
σβ4 Wetness 0.609 0.272 0.191 to 1.262
μβ5 Year –0.170 0.106 –0.387 to 0.031
σβ5 Year 0.145 0.112 0.006 to 0.420
Notes: Hyper-parameter estimates were extracted from Model 1. Estimates include 95% Bayesian credible intervals (BCI). Vari- ables areμ, mean community response;σ, standard deviation in the response to the covariate across species; SD, standard devia- tion. Abbreviations are Distsite, distance to the nearest site; Area, wetland area; Fish, presence (1) or absence (0) ofGambusia holbrooki; Emergveg, proportion cover of emergent vegetation; Canopy, proportion canopy cover; Days, number of days since 1 September; Days2, quadratic effect of Days; Temp, air temperature; Wetness, presence of standing water during a survey; Year, sur- vey year (2000–2001, 1; 2001–2002, 2).
This interaction was stronger and more certain than the relationship between mean occupancy and emer- gent vegetation cover (μα4 = –0.871, 95% BCI:
–1.816–0.030; Table 2). When Gambusia is present at
a site, mean occupancy is predicted to increase from 0.225 at sites with no emergent vegetation cover, to 0.366 at sites with 100% emergent vegetation cover (Fig. 1d).
0 100 200 300 400
0.0 0.2 0.4 0.6 0.8 1.0
Distance to the nearest site (m)
Mean occupancy
a
0 5,000 10,000 15,000 20,000 25,000 30,000 0.0
0.2 0.4 0.6 0.8 1.0
Wetland area (m2)
Mean occupancy
b
0.0 0.2 0.4 0.6 0.8 1.0
0.0 0.2 0.4 0.6 0.8 1.0
Proportion emergent vegetation cover
Mean occupancy
c
0.0 0.2 0.4 0.6 0.8 1.0
0.0 0.2 0.4 0.6 0.8 1.0
Proportion emergent vegetation cover
Mean occupancy with Gambusia
d
0.0 0.1 0.2 0.3 0.4 0.5 0.6
0.0 0.2 0.4 0.6 0.8 1.0
Proportion canopy cover
Mean occupancy
e
FIG. 1. (a, b, c, e) Mean estimates of the probability of occupancy (shaded areas are 95% Bayesian credible intervals) across the frog metacommunity vs. four habitat covariates recorded on Kooragang Island, Australia. (d) The mean estimated occupancy prob- ability in the presence of an interaction betweenGambusiaand emergent vegetation cover is also shown.
There was a positive but ambiguous relationship between mean occupancy and proportion canopy cover, with the 95% BCI widely overlapping zero (μα6; Table 2;
Fig. 1e).
There was a clear negative relationship between the mean estimated probability of detection across all frog species and the number of days since the survey season began (μβ1), although a positive quadratic effect of the number of days (μβ2) also indicated that detection across all species peaked during the season (Table 2). The prob- ability of detection also increased with air temperature (μβ3) and if a site contained water during a survey (μβ4; Table 2). There was no clear relationship between mean detection and survey year (μβ5; Table 2).
Species-specific summary
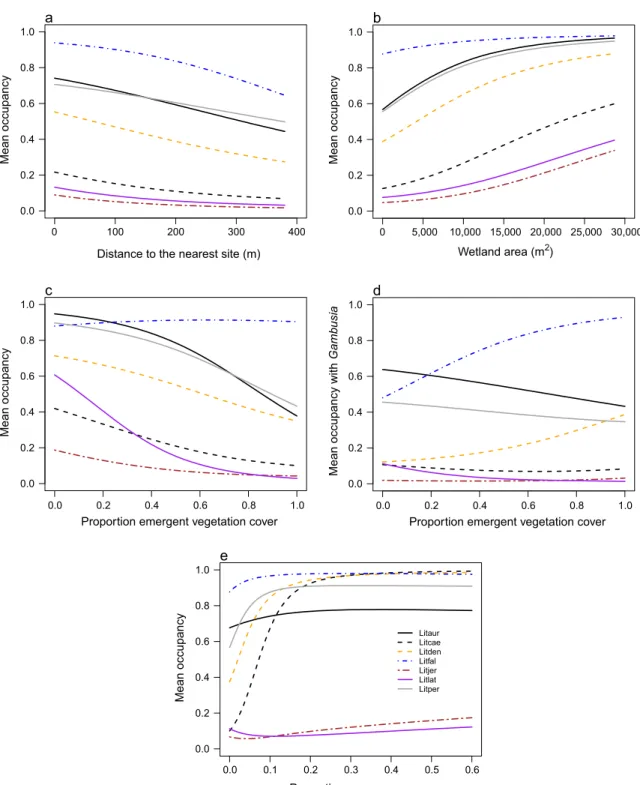
There was a negative relationship between the esti- mated probability of occupancy for all 11 species and distance to the nearest site (Figs. 2a, 3a), although only Lit. fallaxhad a clear negative relationship with the 95%
BCI not overlapping zero (Appendix S5: Table S1). The mean probability of occupancy for all species was posi- tively related to wetland area, with the clearest relation- ships for Lim. peronii, Lit. aurea, and Lit. peronii (Appendix S5: Table S1). There were small to negligible increases in predicted occupancy with wetland area for ground frogs (Fig. 2b), while most tree frog species showed larger increases (Fig. 3b).
There was a negative relationship between the esti- mated probability of species occupancy and the presence ofGambusia(Fig. 4), with Lit. latopalmata andPlaty- plectrum ornatum having clear negative relationships (Appendix S5: Table S1). There was a negative relation- ship between the estimated probability of occupancy for species and emergent vegetation cover at a site (Figs. 2c, 3c; Appendix S5: Table S1). The predicted decrease in occupancy was greatest forLit. aurea,Lit. latopalmata, andP. ornatum. For example, occupancy byLit. latopal- matawas predicted to decrease from 0.610 at sites with no emergent vegetation, to 0.029 at sites with 100%
emergent vegetation cover (Fig. 3c).
There was a positive interaction between the presence ofGambusiaat a site and emergent vegetation cover, with clear relationships forLim. tasmaniensis,Lit. aurea, and Lit. dentata(Figs. 2d and 3d; Appendix S5: Table S1).
For example, whenGambusiaare present, occupancy by Lim. tasmaniensiswas predicted to increase from 0.167 at sites with no emergent vegetation cover, to 0.938 at sites with 100% emergent vegetation cover (Fig. 2d).
There were mixed relationships with canopy cover;
there was a strong clear negative relationship with the predicted occupancy for Lim. peronii while the other ground frogs showed negligible increase with canopy cover (Fig. 2e), whereas there were strong clear increases in predicted occupancy for the tree frogsLit. caerulea andLit. dentatawith an increase in canopy cover at a site (Fig. 3e; Appendix S5: Table S1).
Species richness summary
There was no strong correlation between the estimated number of species at a site and distance to the nearest site (r = –0.112) or emergent vegetation cover (r=0.063; Appendix S6: Figs. S1 and S4). There were positive correlations between estimated species richness and wetland area (r=0.374) and canopy cover (r=0.286); Appendix S6: Figs. S2 and S5). Mean esti- mated number of species at sites where Gambusia was absent and present was 5.3 (95% BCI: 3.4–8.0) and 4.5 (1.6–7.1), respectively (Appendix S6: Fig. S3).
DISCUSSION
Our application of multi-species occupancy modeling (MSOM) clearly showed habitat relationships for both very common and rare frog species that would not have been possible using either single-species occupancy mod- els or statistical methods under the EMS framework.
Even despite the relatively high survey effort, there was a low probability of occupancy and detection for several rare species, which would have likely produced biased and imprecise parameter estimates from single-species occupancy models (see Guillera-Arroita et al. 2010).
Our application of a MSOM should be considered as an example of improvement to the EMS framework under the detection error-corrected EMS (DECEMS) frame- work because it enabled insight into both species-specific and metacommunity-wide patterns in occupancy. In many instances, habitat relationships for individual spe- cies were also consistent with the mean community response, thereby providing evidence of how species- specific responses can generate broader patterns in meta- community structure. However, there were divergent responses in occupancy amongst some species to local habitat covariates. Our results also demonstrated a link between abiotic and biotic factors at the local scale and landscape processes (connectivity) arising from dispersal within an amphibian metacommunity. We discuss these results according to metacommunity theory and provide recommendations for wetland restoration projects seek- ing to accommodate the ecological requirements of amphibians and other wetland-dependent taxa.
Our results at both the species-specific and commu- nity levels are aligned with metacommunity theory: the mean estimated probability of occupancy increased with wetland area and connectivity (i.e., less distance to the nearest site). Consistent relationships at multiple response levels to wetland area and connectivity empha- size that habitat patch size and dispersal are important in maintaining species composition within amphibian metacommunities (Wright et al. 2020). Metapopulation theory posits that larger patches can support larger pop- ulation sizes and that connectivity will increase popula- tion persistence (Hanski 1998). Hence, there is likely to be frequent dispersal of the individuals of many species among the wetland sites in the study area. For instance,
a mark–recapture study of Litoria aurea in the study area detected frogs moving to the nearest wetland site (Hamer et al. 2008). This result therefore illustrates that the mass-effect perspective of metacommunity theory,
which emphasizes the role that immigration and emigra- tion affects local population densities (Leibold et al.
2004), is partly driving metacommunity structure in our study area. Larger habitat patches are also hypothesized
0 100 200 300 400
0.0 0.2 0.4 0.6 0.8 1.0
Distance to the nearest site (m)
Mean occupancy
a
0 5,000 10,000 15,000 20,000 25,000 30,000 0.0
0.2 0.4 0.6 0.8 1.0
Wetland area (m2)
Mean occupancy
b
0.0 0.2 0.4 0.6 0.8 1.0
0.0 0.2 0.4 0.6 0.8 1.0
Proportion emergent vegetation cover
Mean occupancy
c
0.0 0.2 0.4 0.6 0.8 1.0
0.0 0.2 0.4 0.6 0.8 1.0
Proportion emergent vegetation cover
Mean occupancy with Gambusia
d
0.0 0.1 0.2 0.3 0.4 0.5 0.6
0.0 0.2 0.4 0.6 0.8 1.0
Proportion canopy cover
Mean occupancy
Crisig Limper Limtas Plaorn
e
FIG. 2. (a, b, c, e) Mean species-specific estimates of the probability of occupancy for four frog species from two families:
Limnodynastidae and Myobatrachidae (ground frogs) detected on Kooragang Island vs. four habitat covariates, (d) including an interaction betweenGambusiapresence and emergent vegetation cover. Credible intervals are omitted for clarity. Species codes: Cri- sig,Crinia signifera; Limper,Limnodynastes peronii; Limtas,Lim. tasmaniensis; Plaorn,Platyplectrum ornatum.
to support a greater number of species (species–area relationship; Hanski 1994) and we found a positive rela- tionship between wetland area and species richness
(Appendix S6: Fig. S2). Our results suggest that wetland restoration programs should create large, well-connected wetlands to increase the chance of amphibian
0 100 200 300 400
0.0 0.2 0.4 0.6 0.8 1.0
Distance to the nearest site (m)
Mean occupancy
a
0 5,000 10,000 15,000 20,000 25,000 30,000 0.0
0.2 0.4 0.6 0.8 1.0
Wetland area (m2)
Mean occupancy
b
0.0 0.2 0.4 0.6 0.8 1.0
0.0 0.2 0.4 0.6 0.8 1.0
Proportion emergent vegetation cover
Mean occupancy
c
0.0 0.2 0.4 0.6 0.8 1.0
0.0 0.2 0.4 0.6 0.8 1.0
Proportion emergent vegetation cover
Mean occupancy with Gambusia
d
0.0 0.1 0.2 0.3 0.4 0.5 0.6
0.0 0.2 0.4 0.6 0.8 1.0
Proportion canopy cover
Mean occupancy
Litaur Litcae Litden Litfal Litjer Litlat Litper
e
FIG. 3. (a, b, c, e) Mean species-specific estimates of the probability of occupancy for seven frog species from the family Pelodryadidae (tree frogs) detected on Kooragang Island vs. four habitat covariates, (d) including an interaction betweenGambusia presence and emergent vegetation cover. Credible intervals are omitted for clarity. Species codes: Litaur,Litoria aurea; Litcae,Lit.
caerulea; Litden,Lit. dentata; Litfal,Lit. fallax; Litjer,Lit. jervisiensis; Litlat,Lit. latopalmata; Litper,Lit. peronii.
colonization and persistence. This approach would also likely benefit a range of wetland species including aqua- tic macroinvertebrates (Hill et al. 2015), freshwater tur- tles (Roe and Georges 2007), and waterbirds (Murray et al. 2013) that require landscape-scale management to conserve populations.
There was a strong negative relationship between mean occupancy and the presence of Gambusia at the community and species-specific levels. This result high- lights the importance of fish as aquatic predators in structuring amphibian metacommunities. The presence of Gambusia has been previously shown to shape amphibian communities by reducing the occupancy, abundance or survival of some species (Baber and Bab- bitt 2004, Hamer and Parris 2013, Shulse et al. 2013).
Strong negative associations have been reported between Gambusiaand detections of tadpoles of several frog spe- cies (e.g.,Lit. aurea) in wetlands on Kooragang Island, but that adults do not avoid sites withGambusia(Klop- Toker et al. 2018). Aside from amphibians, Gambusia also have detrimental impacts on populations of aquatic invertebrates and other fish species in freshwater wet- lands (Pyke 2008), and so an ecosystem-based approach may be required to control the negative effects of this fish on freshwater communities.
Within the frog metacommunity, the strongest nega- tive relationships were between Gambusia and species
that breed in ephemeral ponds such asLit. latopalmata andPlatyplectrum ornatum. For instance,P. ornatumhas a short larval development period suited to temporary ponds (Anstis 2013), and ephemeral-pond-breeding frog species typically do not possess behavioral defenses against fish predators (Kats et al. 1988). Moreover, these relationships were independent of the effects of hydrope- riod, as there was no strong correlation between ephemerality and Gambusiapresence in the study area, andGambusiahave been observed colonizing ephemeral wetlands during localized flooding after heavy rainfall (Hamer 1998). As such, it appears that the distribution of these and other frog species in the study area was restricted by the presence of Gambusia. Experimental evidence suggests thatGambusiahas the potential to sig- nificantly affect larval populations ofP. ornatumin natu- ral waterbodies where these species co-occur (Komak and Crossland 2000), but there are also several other frog species detected in the study area that have tadpoles observed to be attacked and eaten byGambusiain exper- iments, includingLimnodynastes peronii,Lit. aurea,Lit.
dentata, and Lit. peronii(Morgan and Buttemer 1996, Webb and Joss 1997, Pyke and White 2000).
There was a negative relationship between mean com- munity and species-specific occupancy and emergent vegetation cover. However, there was also no clear rela- tionship with species richness. While most amphibian
0.0 0.2 0.4 0.6 0.8 1.0
Mean occupancy Crisig Limper Limtas Plaorn Litaur Litcae Litden Litfal Litjer Litlat Litper
a) Limnod./ Myobat. b) Pelodryadidae
Gambusia absent Gambusia present
Species
FIG. 4. Mean species-specific estimates (and 95% Bayesian credible intervals) of the probability of occupancy for 11 frog species from three families (a) Limnodynastidae and Myobatrachidae (ground frogs) and (b) Pelodryadidae (tree frogs) detected on Koora- gang Island vs. the presence or absence of the eastern mosquitofish (Gambusia holbrooki) at wetland sites. See Figs. 2 and 3 for spe- cies codes.
studies reported an increase in occupancy with increased emergent vegetation cover at a site (Appendix S2:
Table S1), there are some exceptions. For example, Knut- son et al. (2004) found that amphibian reproductive suc- cess was highest in ponds with less emergent vegetation and lacking fish. In a field manipulation experiment on Kooragang Island, increased emergent vegetation cover did not increase occupancy rates by Lit. aureain wet- lands (Fardell et al. 2018). Our measure of aquatic vege- tation complexity only considered emergent vegetation and there may also be relationships between occupancy and other vegetation strata, such as submerged and floating vegetation, which provide shelter for both frogs and tadpoles, and egg-laying sites (Semlitsch 2000).
Nonetheless, sections of waterbodies with open water provide calling sites for breeding aggregations. Within the frog metacommunity we examined,Lit. aurea, Lit.
latopalmata, andPlatyplectrum ornatum had the stron- gest negative relationship with emergent vegetation cover, implying that these species require areas of open water as calling sites. For instance, Fardell et al. (2018) reported that occupancy by adult femaleLit. aureaon Kooragang Island was higher at sites with a medium density of emergent vegetation, but that occupancy by males was also equal in sparsely vegetated wetlands.
Wetland managers therefore need to ensure that emer- gent vegetation does not smother wetlands, and that some wetland sections may require careful thinning of emergent vegetation to provide open pools of water.
Elsewhere, created wetlands with little aquatic vegetation are preferred breeding sites by some amphibian species (Porej and Hetherington 2005, Swartz et al. 2020).
There was no support for a model that included ephemerality rather than emergent vegetation cover, indicating that wetland hydroperiod had no discernible influence on occupancy. However, we used a simple cate- gorical variable for hydroperiod that may not have repre- sented the full complexity of wetland hydrology experienced at sites during the study. While a previous synthesis highlighted the strong role that hydroperiod plays in structuring freshwater communities (Wellborn et al. 1996), primarily because of the relationship with fish predation (Snodgrass et al. 2000b), this study found that emergent vegetation was more important in deter- mining community composition. Accordingly, our find- ings do not fully concur with the freshwater habitat gradient model proposed by Wellborn et al. (1996), although there may be other unmeasured covariates that were affecting this relationship in our study area. For instance, this model was found to be not applicable to frog communities in urban ecosystems due to a greater prevalence of permanent waterbodies in urban areas (Hamer and Parris 2013). Hydroperiod was not an important factor in determining community structure in other studies that detected similar frog species in Aus- tralian wetlands (Hamer and Parris 2011, Hamer 2016).
Further investigations into the effect of hydroperiod on Australian frog species in wetland restoration and
monitoring programs are warranted, including the need to develop a standard measure of hydroperiod that accu- rately encapsulates the ecological requirements of indi- vidual species within the broader community as well as the complexities of wetland hydrology. Nonetheless, cur- rent evidence suggests that wetland restoration programs should aim to create waterbodies with varying hydrope- riods to address the life-history requirements of individ- ual amphibian species (Semlitsch 2000) and other taxa (e.g., macroinvertebrates [Hill et al. 2017], freshwater turtles [Roe and Georges 2007]).
The relationship between emergent vegetation cover and the presence of Gambusiawas accentuated through the strong interaction between the two covariates; mean community occupancy increased with vegetation cover at sites whereGambusiawas present, thereby providing evi- dence that aquatic habitat complexity may reduce preda- tion rates. Moreover, there was a strong clear positive interaction forLim. tasmaniensis,Lit. aurea, andLit. den- tata. There is evidence that Gambusiaattacks and con- sumesLim. tasmaniensistadpoles (Turner 2017), although experimental evidence suggests thatLim. tasmaniensiscan detect and subsequently avoidGambusia(Lane and Mah- ony 2002), presumably by taking refuge amongst aquatic vegetation in wetlands. Moreover,Lim. tasmaniensisand Lit. aureado not possess life-history traits that may other- wise permit coexistence with predatory fish (i.e., both spe- cies have relatively long larval development periods; Lane and Mahony 2002, Hamer et al. 2002b), and so tadpoles may depend on habitat structure or reduced activity to evade fish (Jansen and Healey 2003, Sanders et al. 2015).
High aquatic habitat complexity reducesGambusiapreda- tion on amphibian larvae (Baber and Babbitt 2004), and the planting of aquatic vegetation cover has been advo- cated in wetland restoration to increase amphibian occu- pancy and reproductive success (Pearl et al. 2005, Shulse et al. 2012, Holgerson et al. 2019, Rowe et al. 2019). Pre- dation byGambusiaon eggs and tadpoles is recognized as a key threat toLit. aurea(Pyke and White 2001), although the presence of aquatic vegetation is thought to ameliorate the impact ofGambusiain many populations (White and Pyke 2008). Similarly, our results suggest that establishing emergent vegetation cover may offset the negative effect of Gambusiaat wetland sites. However, as discussed previ- ously, emergent vegetation should not be allowed to com- pletely cover wetlands, and the best management regime may be to create a mosaic of both sparsely and densely vegetated habitats (Fardell et al. 2018). This outcome could also be achieved by pond draining to both eradicate Gambusiaand thin macrophytes (Pollard et al. 2017). One experimental study suggested that aquatic vegetation may provide insufficient refuge for aquatic invertebrates and amphibian larvae from Gambusia predation, and that direct removal of this fish is the best method to improve the conservation potential of restored wetlands (Shulse et al. 2013).
There was an increase in mean community occupancy with increasing canopy cover, although the wide credible