Collection of Works, vol. 43
Sapienza University of Rome
WAR, PEACE AND NATIONBUILDING (1853–1918)
Editors in chief
Prof. Aleksandar Rastović, PhD Prof. Andrea Carteny, PhD
Editor
Biljana Vučetić, PhD
Belgrade 2020
Prof. Antonello Biagini, PhD (Unitelma, Sapienza University Rome) Prof. Andrea Carteny, PhD (CEMAS, Sapienza University Rome)
Petar V. Krestić, PhD (Institute of History Belgrade) Prof. Luca Micheletta, PhD (Sapienza University Rome) Prof. Mira Radojević, PhD (corresponding member of the SASA)
Prof. Aleksandar Rastović, PhD (Institute of History Belgrade) Prof. Alessandro Saggioro, PhD (Sapienza University Rome)
Biljana Vučetić, PhD (Institute of History Belgrade)
This book has been published with the financial support of The Ministry of the Education, Science and Tehnological Development
of the Republic of Serbia
FOREWORD 9 11 Mira Radojević
THE QUESTION OF SERBIAN NATIONAL INTEGRATION
AT THE TIME OF CREATION OF THE YUGOSLAV STATE IN 1918
31 Andrea Carteny
FROM THE LAUSANNE CONGRESS TO THE ROME PACT UNTIL
THE FIUME LEAGUE, NATIONALITIES AND NATIONALISMS (1916–1920)
I EXPRESSION OF NATIONALISM IN EUROPE
57 Gábor Demeter, Zsolt Bottlik, Krisztián CsaplárDegovics
THE ROLE OF ETHNIC MAPPING IN NATIONBUILDING AND ITS INFLUENCE ON POLITICAL DECISIONMAKING ACROSS THE BALKAN PENINSULA (1840s–1910s)
81 Giordano Altarozzi
ITALIAN INFLUENCES ON ROMANIAN NATIONBUILDING (SECOND HALF OF THE 19th CENTURY)
91 Alessandro Vagnini
THE MANY WAYS TO SEE THE NATION.
LIBERALS AND CONSERVATIVES IN ROMANIA 1914–1918
101 Vladimir Jovanović, Biljana Vučetić
ROADSIDE MEMORIALS AND NATIONAL IDENTITY IN 19th CENTURY SERBIA
123 Aleksandar Rastović
BRITISH PRESS COVERAGE OF SERBIA 1890–1895
THE ARMY OF THE PRINCIPALITY OF SERBIA IN THE PLANS OF NATIONAL LIBERATION AND UNIFICATION IN THE MID19th CENTURY
161 Jelena Radosavljević
THE BULGARIAN CHURCH QUESTION AND NATIONBUILDING IN THE BALKAN PENINSULA 1870–1878
Milun Stijović 177
THE STRUGGLE OF THE SERBIAN PEOPLE IN KOSOVO AND METOHIJA FOR THE PRESERVATION OF NATIONAL IDENTITY UNDER THE TURKISH RULE DURING THE 19th AND EARLY 20th CENTURIES
189 Vemund Aarbakke
WESTERN THRACE IN A THREEWAY CONTEST BETWEEN BULGARIA–GREECE AND THE OTTOMAN EMPIRE 1912–1923
Biljana Stojić 205
THE INTERNATIONAL DIMENSION OF A LOCAL PROBLEM:
SERBIAN GOALS VERSUS ITALIAN ASPIRATIONS IN ALBANIA (1912–1914)
II WARTIME NATIONALISMS
225 Fabio L. Grassi
OTTOMAN DEMOGRAPHIC ENGINEERING BEFORE AND DURING WORLD WAR I
239 Roberto Sciarrone
THE OTTOMAN EMPIRE AND THE CAUCASUS FRONT (1914–1915)
253 Árpád Hornyák
A DOCUMENT OF NATIONBUILDING AND STATE DISINTEGRATION:
THE BELGRADE MILITARY CONVENTION
269 Giuseppe Motta
CHARITY IN TIME OF WAR. THE JOINT DISTRIBUTION COMMITTEE IN RUSSIA IN THE CONTEXT OF HUMANITARIAN INTERNATIONALISM
289 Aleksandar Životić
“BLACK HAND” MYTHS, MISSUSE OF FACTS AND HISTORIOGRAPHICAL CONTROVERSIES
303 Georgeta Fodor, Maria TătarDan
“FOR THE HEALTH OF THE NATION”:
(RE)AFFIRMING GENDER ROLES IN INTERWAR ROMANIA
321 Ana Stolić
D’ANNUNZIO’S SEIZURE OF FIUME (RIJEKA) IN 1919
AND THE PROCESS OF POLITISATION OF WOMEN IN SERBIA (KINGDOM OF SERBS, CROATS AND SLOVENES)
339 Jovana Šaljić Ratković
LITERATURE IN SERVICE OF THE NATION:
HOW “POBRATIMSTVO“ WAS CREATED
357 Aleksandra Vuletić
DEMOGRAPHIC STATISTICS AS A MEANS OF NATIONAL REPRESENTATION IN SERBIA IN THE SECOND HALF OF THE 19th CENTURY
373 Gordana Garić Petrović
SOME REGIONAL SPECIFICITIES OF AGRICULTURAL
PRODUCTION IN SERBIA: OLD DISTRICTS AND LIBERATED AREAS IN LIGHT OF STATISTICAL DATA (1878–1912)
DOI: 10.34298/9788677431402.01 Gábor DEMETER
Hungarian Academy of Sciences Historical Institute
Research Center for the Humanities Budapest
Hungary Zsolt BOTTLIK
Eötvös Loránd University Budapest
Hungary
Krisztián CSAPLÁRDEGOVICS Hungarian Academy of Sciences Historical Institute
Research Center for the Humanities Budapest
Hungary
THE ROLE OF ETHNIC MAPPING IN NATIONBUILDING AND ITS INFLUENCE ON POLITICAL DECISIONMAKING ACROSS THE BALKAN PENINSULA (1840s–1910s)
Abstract: Beyond highlighting the role and functions of ethnic maps of the Balkan Peninsula in the 19th century in the context of the emerging, nationalist ideology (1); this article tries to draw attention to some misinterpretations or abuses made intentionally by cartographers, (2) by comparing the original datasets with the officially published and reinterpreted tables found in the HHStA (2a), and by comparing the western and eastern and Balkan cartographic practices and visualization methods (2b). All these could lead to different interpretations (not to mention the different interpretations of the terms used to denote the same nation), which made ethnic maps adequate instruments to advocate the national idea, turning them from a scientific method (thematic mapping) to a political tool of creating the nation (instead of depicting it). Our case studies examine (a) whether the firstgeneration ethnic patch maps depicted the situation in the Balkans better, or the reinterpreted modern piechart maps are more appropriate to illustrate ethnic diversity; (b) whether Ottoman data are completely unreliable or they could serve as a basis of ethnic mapping;
(c) whether the investigated Ottoman data from the 1830s and the 1870s were available to western cartographers at all or not and how data were distorted; and (d) whether there were any maps based on Ottoman data that reached the level of decisionmakers and how this related to other, western map constructions. We also compare the features of nationalist and imperial ethnic cartography, the languagecentric and religiocentric approach and the differences between these approaches, and finally we also try to offer a rather limited method of how to mutually control the reliability of sources produced by competing parties (on the example of Ottoman and Exarchist data).
Keywords: ethnic mapping techniques, Balkans, Ottomans, Exarchate, Kiepert, Teplov, Boué.
The 19th century brought about significant changes in hearts and minds. It was the age of the national revival,1 culminating in the fight between the traditional concept of the state nation (empire) and the new idea of the nation state. The adoption of Darwinism and terms such as the “competition of races”, or “natural selection” in social science and history resulted in a new and teleological concept, which claimed that there was a natural evolution trend towards the nation and nation states, and these were also considered the most developed social formations and political entities. This also implied that the struggle for survival or competition between the nations was a natural phenomenon. Nationalism, as a political movement, also utilized this concept, when it articulated to unite everyone belonging to the same nation into a single state with “natural boundaries”,2 propagating the emergence of the nation state versus empires, considering the latter an obsolete formation.3
A new ideology always needs new argumentation to legitimize its existence and aspirations, and it also requires new instruments to serve these arguments. Among these one can find ethnic mapping, which is considered a special method of nation
building. Together with the fabrication of the historical past (a task left to historians), ethnic mapping (a task designated for geographers and cartographers) was an excellent instrument to advertise national goals and desires (even to externalize internal problems), as maps were cheaper than establishing or maintaining schools, while being able to influence minds through their visibility and publicity. For instance, 1000 copies of the same map cost 2000 francs,4 and from this amount all Greek schools in Macedonia could be supplied with effective propaganda material.
Compared to other instruments and methods to spread nationalist propaganda, maps could be produced, reproduced and disseminated easily.5 Though mapreading also requires some skills (reading pamphlets also required these), teachers could easily transmit the message of maps to “illiterate” masses. Furthermore, paintings (ethnic maps can also be interpreted in such way) are more easily perceived by the human
1
4
See the terms like “Risorgimento”, “Vazrazhdane”, etc.
2Not in physicalgeographical terms (this does not refer to mountain chains and watersheds), but in the politicalgeographical sense.
3Nationalism became one of the main driving forces in the struggle for independence besides social argumentation (oppression) and the economic criticism of the financial efficiency of the Ottoman Empire (the lack of transparency, lack of local utilization of sources).
Ottoman Diplomatic Documents on the OriginsofWorld War One,IV(ODD), The Macedonian Issue, 1879–1912, Part 2, 1905–1912, Edited by Tokay, Gül and Küneralp, Sinan, Isis Press, Istanbul 2011, Nr. 1426, 15, Nov. 1906.
The cheapest rifle (another adequate instrument to exert pressure on minds), an obsolete Werndl, was 6 francs at the time, while a good Martini cost 10–15 pounds sterling (220–300 francs). ODD, IV/1, Nr. 357 (1902). By comparison, the annual expenses of the Greek lycée in Saloniki were 70,000 francs, while the Greek government supported the educational and other efforts of the Patriarchate with 1.5 million francs a year. Ipek Yosmaoğlu, Blood Ties:
Religion, Violence and the Politics of Nationhood in Ottoman Macedonia, 1878–1908, Cornell Univ. 2013, 66, 71–78.
5
on Political DecisionMaking Across the Balkan Peninsula (1840s–1910s) mind than printed texts.6 This gives an advantage to maps compared to other compressed forms of knowledge, such as book reviews, which have the same functions.7 The organization supporting Hellenes and Hellenization in Macedonia, the Syllogos, was also aware of these advantages, when it decided to order a ProGreek “ethnocratic” ethnic map from Kiepert and to disseminate it in all Greek schools of Macedonia, thereby diminishing the unfavourable effect of Kiepert’s former map (1876). Nevertheless, this case illustrates that maps could have different target groups, from masses to decisionmakers,8 and that maps could also serve as propaganda material besides being instruments of planning. It also highlights that even the same author produced contradictory maps, which questioned the scientific credibility of ethnic mapping in general (Map 1–2).
Maps could also carry a special message beyond their original “content”. This often led to misinterpretations. In Croatia the cadastral land surveys in connection with the planned tax reforms in 1883 resulted in an antimodernist mass movement and the burning of
cadastral and other maps as a protest against government measures.9 Here maps symbolized the centralizing state power, and the Croatian case is a good example to prove Anderson’s concept about the general role and function of maps.10 The vast Hungarian cartographic material in the Paris Exhibition in 1900 also confirms the idea that maps also function as representations.11
Ethnic maps became the key meansofnot only visualizing, but also of inventing and promoting the national thought.12 Not only politicians, but contemporary scholars also recognised and accepted this ambivalent relationship between ethnic mapping and politics,13 though 19th century proponents still considered the former a scientific
7
8
6In the 20th century, 90% of the stimuli were visual. School statistics in favor of the Greeks were initially published in the form of statistical tables, but were soon visualized as the visual impact of a map is usually stronger. SeeI.Yosmaoğlu, Blood Ties, 98.
Pregled geografske literature o Balkanskom poluostrvu, edited by Jovan Cvijić. Volume 4 of this series contains the excerpts of more than 140 works from 1898–1900, of which only 33% related to natural sciences (geology, meteorology and physical geography), while all the other targeted human geography or mapping.
See: Harley “Maps, knowledge, and power”, in: G. L. Henderson, M. Waterstone, Geographic Thought: A Praxis Perspective. Routledge, 277–278.
9HRHDAPr.Zv. (Hrvatski državni arhiv, Predsjedništvo Zemaljske vlade) 78. fond, 181. box: 63356/1883.
10 Benedict Anderson, Imagined Communities. Reflections onthe Origin and Spread of Nationalism, Verso, London–New York (2006, revised edition), Chapter 10, 163–187.
11While the accounts in the other 28 countries’ maps were not longer than a paragraph each, the list of Hungarian maps constituted more than two pages, the second longest enumeration after Russia. The maps represented the tremendous civilizational activity of the central power in discovering, regulating, ruling and transforming the landscape. Veronika Eszik, A magyar–horvát tengermellék mint nemzetiesített táj. Adalék az intézményesülő földrajztudomány és a nemzetépítés kapcsolatához, Korall 16, no. 62 (2018) 77–78.
12B. Anderson, Imagined Communities.
13This relationship between the state and humanities was not considered unnatural at the time. This is the era of nationalized science, when the task of certain disciplines was to secure cohesive forces for the society (nation).
method.14 The fact that ethnic maps were used for propaganda purposes overshadowing scientific concerns – a demonstration in Greece in 1903 demanded a ban on maps that were unfavourable for the Greek cause and even urged for a governmental counteroffensive15 – has determined the status of ethnic mapping up to now, degrading it from a positivistic method of the era of the “nationalized science”
(the 19th century) to a suspicious, opportunistic practice.
As ethnic mapping is not purely a scientific method, but a propaganda material and an instrument of nationmaking, the various interpretations can be very misleading and dangerous. (1) Recent works in EastCentral and Southeast Europe still vindicate the importance of old ethnic maps,16 considering them not only political material, but scientifically established works. (2) The methodological mistakes committed by the 19th century cartographers recur in modern works and the application of old, fuzzy categories is still observable.17
Map 1. A simplified sketch map on the evolution of Cvijić’s ideas regarding the ethnic picture of the Balkans (redrawn after Wilkinson)
14
15
I. Yosmaoğlu, Blood Ties, 88. Though opportunistic tendencies are not negligible, there was a firm belief that ethnographic maps promoted “justice” and “development”.
I. Yosmaoğlu, Blood ties, 94.
16See the ethnic map in: Georgi Markov, Bulgariya i Balkanskiya sayuz sreshtu Osmanskata Imperiya, 1911–1913, Izd. Zahariy Stoyanov, Sofia 2012.
17 MustafaM. Kruja, Ne historine Shqiptare, OMSCA1, Tirana 2012 (recent reprint or posthumous work of an Albanian minister). Pál Fodor, Kisebbségek az Oszmán Birodalomban.
on Political DecisionMaking Across the Balkan Peninsula (1840s–1910s)
Map 2a. Variations on the same topic: the ethnic map of Kiepert handed at the Berlin Congress (above) and the ethnocratic map of the same author
ordered by the Greek propaganda (below)
Map 2b. Variations of the same topic: the ethnic map of Kiepert handed at the Berlin Congress (above) and the ethnocratic map of the same author
ordered by the Greek propaganda (below)
The goal of this study is partly to reveal some tendencies of manipulations in the past, through some examples. In doing so we tried to collect and evaluate ethnic data (including some unpublished manuscripts), census methods and visualization techniques in order to compare them and check their relevance. These all point to the fact that data 14–20. sz. [Minorities in the Ottoman Empire], História 34, no. 8 (2012) 30–34. See the map by Béla Nagy on page 33, showing the Muslim relative majority in each vilayet, because Christians were splintered among the “newborn” nations.
on Political DecisionMaking Across the Balkan Peninsula (1840s–1910s) integrity and reliability in the 19th century Balkans were weak. But while the inherent obscurity of ethnic categories (such as “Bulgarian”)18 is hardly eliminable by any map editors, methodological mistakes of visualization could have been avoided. And if these mistakes are abundant, it means that the ethnic maps of the investigated era did not meet the standards of contemporary science from the methodological point of view (as they could have been designed/visualized better). In other words, if even those parts of the work were not carried out by applying a professional approach, that could have been done anyway, it implies that scientific criteria were simply subjected to other (political) goals.19 That is why we decided to deconstruct the old ethnographic patch maps into their building bricks (data) and then to rebuild them using a different visualization method (pie chart maps), whichwethought to bemore appropriatetoillustrate ethnic proportions.20 We went down even to the manuscript level, if available, using the archives of HHStA and CDA (Sofia). In order to make maps comparable with each other, a similar scaling, projection system and legends were used.
The idea to compare maps based on the same (or similar) data, but using a different visualization technique, came from the observation that the first ethnographic patch maps (Boué, 1847, or Šafaryk, Map 3)21 neglected the illustration of Muslims; however, recent literature puts their share in the Balkans to 30–45%, relying on – partly deficient – 18th century defters.22 Illustrating the raw data of the first Ottoman census (1830s) in piechart maps (Map 4), the picture we obtained was significantly different from that of these western patch maps,23 and the results
20
18Should this term include Pomaks and Slavicspeaking patriarchists, or not? This would largely influence the results. The competing Balkan nations did not agree as to what „Bulgarian”
meant; in other words not only did different ethnic categories exist, but even numerous approaches coexisted for the same term, further diversifying the palette.
19We leave to other historians to discuss these in detail.
Piechart maps are better if the goal is the illustration of the heterogeneity or population numbers or population density, while this maptype is inapt to delimit boundaries or homogeneous territories. For the latter purpose usually patch maps were used in the investigated time period, but they distorted ethnic proportions and numbers.
21Lejean (1861) and Habenicht were the first who tried to illustrate Muslims with patches. This happened not earlier than the Crimean War (when the Ottoman Empire became an ally of the Powers first in the 19th century), so political circumstances had a nonnegligible influence on mapping practices.
Anton Minkov, Conversion to Islam in the Balkans: Kisve Bahasi Petitions and Ottoman Social Life 1670–1730, Brill, Leiden 2004. See also: Bruce McGowan, Economic Life in Ottoman Europe. Taxation, Trade and the Struggle for Land, 1600–1800, Cambridge University Press, New York 1981, 80–114.
23Three reasons can explain the difference between the maps. First, the Ottoman census distorts in favour of the Muslims, therefore early mappers, being aware of this fact, refrained from using Ottoman data. Second, they were unable to obtain the census data (of course, this raises the question as to what extent these maps can be considered scientific products, and the answer is unfavourable – see Justin McCarthy’s criticism of western mappers). Third, they considered their maps as tools to highlight a problem (that millions of Christians live under Ottoman rule) – hence the overemphasis on the Christian/Slavic character of the peninsula. In the latter case, the scientific character of ethnic mapping can be questioned ab ovo.
22
basically confirmed the stance of 18th century cizye defters. The comparison of the pie chart map based on the 1831 census data with pie chart maps created from the data of the next census (1870s, Map 5) denied the presumption that Ottoman data were completely useless. In other words, if numbers are not correct, then at least ethnic proportions are correct in the 1831 dataset or– not worse than in later statistics based on a more precise approach! Thus our pie charts relying on the original Ottoman data still offer a more realistic picture than the first generation of western patch maps.
Map 3. A patch map of the early era neglecting Muslims of the Balkans (Boué, 1847)
on Political DecisionMaking Across the Balkan Peninsula (1840s–1910s)
LEGEND23°25°27°RUS.29° N
A21°EastofGr. HUNGARY Religiousdistribution ofthepopulation45° Danube
Maçinlsakça Sünne TÜLÇA Mahmudiye Hirsova Babadaği
Muslim WLL1 talomitaNon-Muslim BUCHAREST D
na bu e
S E R B I A
Köstence
Danube
VIDINSilistreMecidiye LomRUSÇUK Tutrakan AdliyeRahovaNigebolu ZistoviHezargradHacioğluR
Boundaries Boundaryofthe OttomanEmpire Boundary ofthevilayets Boundary ofthesanjaks Boundary ofthekazas
BerkofçaMankalya Ivraca Balçik VÁRNALovca43°Orhaniye SOFIA
ŞumnuPilevne TIRNOVACuma RahoviceDiranovaPravadi Osmanpazar SelviBebrova TiravnaKazganGabrovaAydos ISLIMYE KızanlıkYambolu Burgaz FILIBEZagra-1 Zagra-iA. ÇirpanKızılagaç
RadmirIzladiNumberof inhabitants (1000males)
Müsevri Dupnice
Ihtiman TatarpazarcikBacksea 100KöstendilSamakov Cum'a MUSKÜBTo
Vardar Mesta
Territories OttomanEmpire TunaVilajetand VilajetofEdirne
41°
Struma
N CisrEDIRNEKirkiliseHassköy-MustafaPinalhisar AniçelebiSultanyerHavsaVize Baba-I-A DimetokaLüleburgaz GümülçindGisf-l-ErgeneÇorly HayraboluEregliFerecikMalkaraISTANBULTEKFÜRDAĞI SeaofMarmaraThasosKesan InozMarmara Adasi0AegeanSeaGELIBOLU 25°Samothraki29°
SALONIKIOthercountries ŞarköyDog 27° Map5.Ethnoreligiousproportionsofthesameareainthe1870s
on Political DecisionMaking Across the Balkan Peninsula (1840s–1910s) To sum up, if the two visualization methods (pie chart and patch maps) show a similar picture (outlook), this means that the results are independent from the method, thus old maps can be considered reliable. If the results differ from each other, this means that either distortions or intentional manipulation occurred during the process of visualization, which questions the reliability of the map. And if we compare the original patch maps of Gopčević with the piechart variant (Map 6), or the material found in HHStA, Nachlass Szapáry and Nachlass Kral24 (patch maps, redrawn in pie chart forms), the differences between the two methods of illustration are evident.
Nonetheless, the outlined method (comparing patch maps and piechart variants) is only able to handle cartographic problems – those arising during the visualization process. However, unintentional distortions and intentional manipulations may occur not only during visualization, but even at the level of applied categories (depending on the interpretation of the “nation”) and at the level of numbers too. The manuscripts found in HHStA, or the automatic reclassification of Macedonians into Bulgarians in Austrian practice is an evident example of this problem (Table 1).
Table 1. Differences between the published data and the original manuscript on the ethnic pattern of the Balkans I.
Official appendix of an Austrian ethnic map:
Jews Total
3600
Albanians Greeks Vlachs Gypsies
Muslim Orthodox
Orthodox Muslim Greeks Greeks
Janina 450 800 77,700 6,000 6,400 1,000
Leskovic 11,000 5,000 4,000 1,000
Konica 1,200 12,600 4,000 200
Filat 12,000 9,000 6,000 1,000
Ajdonat 5,000 5,000 5,000 800
Metsovo 850 4,700 50
Statistische daten über Nationalitaten und Religionen in Makedonien.
k.k Hof und Staatsdruckerei, 1905.
95,950 21,000 18,000 28,000 15,800 5,600 184,350
24For the original Austrian patch maps and the redrawn piechart maps see: Gábor Demeter, Krisztián CsaplárDegovics, Zsolt Bottlik, Етническите карти и статистики като политическа реклама и инструменти за изграждане на нация (1878–1913) – надеждност на данните, Makedonski pregled 39, no. 2 (2016) 47–82.
Jews Total Original manuscript in HHStA, Wien (same area):
Albanians Greeks Vlachs Gypsies
Muslim Orthodox
Orthodox Muslim Greeks Greeks
Janina 4,500 4,400 81,000 12,000
Leskovic 8,000 5,800 1,000 200
Konica 2,000 2,000 15,000 5,800
Filat 1,000 1,000 5,000
Ajdonat 3,000 3,000 3,500
Metsovo 5,800
108,000 18,000 25,000 37,800 15,800 5,900 211,100 HHStA, Wien, PA XII. Kt. 273. Compiled from the reports of Pára, Ippen and Kral.
The modern nation state tried to get rid of the fuzzy or multiple identity forms that do not fit into the imagined schemes – with the aid of censuses and ethnic maps – by overemphasizing one selected element of the multidimensional identity.25 Thus ethnographic maps usually offered a restricted/limited or specific interpretation of the nation. In fact, ethnographic maps contributed to the creation of the modern nations by flattening the dimensions of identity, rather than to depict them properly.
This resulted in contradictory maps using the same raw data (Map 6–7). Contrary to the practices of nation states, the imperial mapping of AustriaHungary refused these homogenization techniques for political reasons and, instead, a multidimensional classification was used to depict the situation in the Balkans.
Map 6. The difference between piechart maps and patch maps (as techniques of illustration) based on the same dataset (Gopčević, 1889)
25See also B. Anderson, Imagined Communities, Chapter 10, 163–187.
on Political DecisionMaking Across the Balkan Peninsula (1840s–1910s)
Map 7. Variations on the same topic: completely different ethnic piechart maps of the contested Macedonian region created from the data and patch maps of proSerb Gopčević (1889),
Greek Nikolaides (1899) and Bulgarian Ivanov (1912)
During the Great Eastern Crisis several ethnic maps were created that showed all the symptoms and problems discussed above. One of the most famous maps is the ethnic map of Heinrich Kiepert, which served as the basis for decisionmaking in Berlin. However, (1) it was not the only variant depicting his views (Map 2); (2) his views were exposed to severe criticism and (3) there were also other authors who used different methods supporting one of the Powers’s concepts. In the following lines we try to analyze them in a case study.
Kiepert’s map26 was based on the data of Sax, Jireček, Kanitz, Bradaška and Jakšić, and he made use of the map of Lejean and Hahn. Although his map (Map 2) became famous as the one used at the Berlin Congress, the polyglot Hungarian geographer (and Turcophile turanist) Béla ErődiHarrach criticized its concept in early 1876,27 claiming that there were many mistakes in the map. His thesis was that the religion for Muslims was still a stronger marker of identity than ethnicity defined by the spoken language: a Bosniak or Pomak would rather choose the Ottoman Empire and Turks (considering them their real compatriots) over their Slavicspeaking brethren.
Thus the overemphasis of language in Kiepert’s map as the main determinative factor of ethnicity has a diminishing effect on the Muslim character of the Empire.28
26Kiepert was taught by historians Ranke and Meinecke, and worked together with Karl Ritter, the founder of modern geography. Thus, the intertwining of these two disciplines – both often accused of political motivations and inclinations – was characteristic of his career.
27Béla Erődi, Kartografia (Ethnographische Übersichtskarte des Europäischen Orients), Földrajzi Közlemények 4 (1876) 341–344.
28Béla Erődi, Földrajzi és népismei tanulmányaim európai Törökországban az 1869‐iki felvétel alkalmával, Földrajzi Közlemények 2 (1874).
As we mentioned, Kiepert soon revised his ideas due to the Greek pressure and his “ethnocratic” map29 was in complete contrast to the cartographer’s former work.
However, it was not only Kiepert in that era who created a map directly to support decisionmaking. The Russian Teplov’s map (Map 8) was also more than political propaganda or the expression of sympathy towards one of the races in the Ottoman Empire, as it functioned as an aide‐material in the conference of Constantinople to promote Russian interests. But it was completely different from Kiepert’s map. First, it was a choropleth map illustrating two groups at the same time, indicating the proportions with colour tones. Second, it contained religious and not ethnic classification.30 Third, it also indicated the population number (males, in fact), which patch maps failed to do. So, Teplov’s map was methodologically more sophisticated than Kiepert’s, despite its numerous mistakes (see later). Teplov’s map did not distort the relations radically in favour of Christians in Bulgaria (especially if we compare it to the suggested preliminary boundaries of Bulgaria), and he did not claim that the new state would be dominantly Bulgarian – contrary to what some languagebased patch maps (the map of Kiepert) would suggest.
Compared to this, Kiepert’s map (speaking of visualization techniques) was methodologically less elaborated. The crosshatching, applied by him, also came under criticism for not being able to illustrate ethnic proportions, not to mention the fact that he ignored to indicate 309 thousand Muslim Bosniaks, the 250 thousand Circassians between Niš and Kosovo and the 485 thousand Muslims of Macedonia (many were incorporated into the Slavic ethnic group in his map based on their spoken language).
What Erődi offered – relying on Ottoman ethnoreligious categories (millets) – was also not a viable option. The combination of the linguistic and ethnoreligious categories was also attempted, but as Cvijić wrote, “Sax’s Austrian bureaucratism tore nations into atoms”. Up to then ethnic maps favouring one particular group were the “norm”,31 but, with the advent of Sax, the Macedonian “ethnic salad” was invented in maps – and AustriaHungary would continue to use this approach in the future for its own political reasons.
Besides the visualization problems and the question of data interpretation (how to create ethnic categories from ethnoreligious groups), the third key problem is the statistics – the problem of basic data. Regarding the number of Christians, one cannot decide which source is more reliable: Teplov’s dataset relying on the Exarchate’s data from 1877, or his map created for the conference in Constantinople or the Ottoman census. Therefore, we carried out two experiments: (1) first, to examine the problem
29Tableau Ethnocratique des pays du sud‐estdel’Europe, Berlin 1878.
30Though in another material Teplov also tried to give ethnic data, like Kiepert, at least for the Bulgarians, using the census of the Exarchate, neither showed an overwhelming Bulgarian majority, while a huge number of nonexarchist Christians were also indicated. In the material from the Exarchate the number and proportion of Muslims were too small compared to other western and Ottoman statistics.Itis not surprising that this data series was not used in Constantinople, but the other one based on the Ottoman census of 1873!
B. Yosmaoğlu, Blood Ties, 94.
31
on Political DecisionMaking Across the Balkan Peninsula (1840s–1910s) whether Christians or Muslims are more underrepresented in official Ottoman datasets; (2) second,toexamine whether OttomanornonOttoman datasets are more reliable. For the first experiment we used the 1831 census data. For the second experiment, a comparative analysis of the ethnodemographic characteristics of the Danube vilayet was carried out, using four different datasets.32
In order to find an answer to the first question, the kazalevel data of the census in 1831 were mapped using the piechart method, and the results were compared to the map based on the data of the 1870s (using the data published in the Extraitdu Courrier d’Orient and some Ottoman salname). The hypothesis is the following: if the ethnic proportions are quite similar (there were no significant wars, expulsions, though the administrative division probably changed), it means that the two millets were treated in the same way in the Ottoman census. What is evident comparing Map 4 and 5 is that – while the size (representing the number of the census population) of the pie charts is inconsequent, the ethnoreligious proportions seem to be stable in this time interval! In other words, one may come to the conclusion that none of the two millets were more underrepresented in Ottoman statistics than the other.33
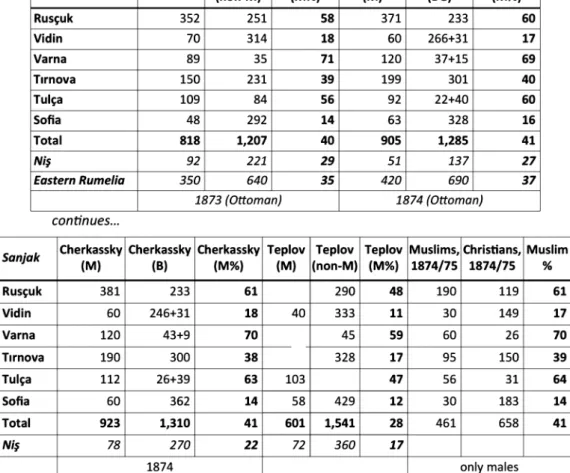
For the second experiment, we used the article of the Encyclopaedia Britannica (1876), Aubaret’s and St. Claire’s statistics and Ottoman statistics published by Ismail Kemal in the Danube (Dunav) newspaper (Table 2). The latter was compared to the detailed statistics of Teplov (1876), and Stavrides, Jocelyn and Cherkassky (all prior to 1877, but these are based on ethnoreligious and not ethnic categories) (Table 3–4). The goal was to identify the direction of the information flow and the accompanying distortions.
Despite the similarity of total numbers, the four estimations of the Danube vilayet are different (the proportion of Bulgarians varied between 50 and 63%, their number is rated between 1.1 and 1.5 million). Some data suggest (Armenian Christians) that St. Clair and the Danube newspaper used a common source, but reclassed the data differently: the former used ethnic, the latter social categories (settlers and established). The source mightbe
the Ottoman Tahriri Cedid from 1874.34 The Encyclopaedia Britannica also used a different source and a reclassification completely based on ethnic terms. All the other western estimations of Jocelyn, the English tercüman Stavrides and Russian prince Cherkassky correspond to the data of the Ottoman data series in general. Both the proportions and the numbers are similar.
Differences may be explained by the application of different multiplicators (to count the total population, different multiplicators were used for Ottomans and Christians),35 or by the selection of different Ottoman sources.
32The selection of the location was reasoned by the fact that after the census in the 1830s, the first modern Ottoman census was carried out in the Danube vilayet in 1866. See: Aşkın Koyuncu, Tuna vilâyeti’nde nüfus ve demografi (1864–1877), Turkish Studies 9, no. 4 (2014) 675–737.
33There are only some exceptions such as Ihtiman, where the proportions are switched, probably due to a mistake.
A. Koyuncu, Tuna vilâyeti’nde nüfus ve demografi.
35Muslims were supposed to live in smaller households, but this was not the case with all districts.
34
Table 2. Four different statistics on the ethnoreligious composition of the Danube Vilayet Total population of the Danube Vilayet
(excluding Niş sanjak) in 1876 estimated by French consul Aubaret
Group MUSLIMS
Turks Circassians Tatars
Male population of the Danube Vilayet (excluding Niş sanjak) in 1866–1873 according to the editor of the Danube
newspaper Ismail Kemal
Group Population
MUSLIMS 481,798 (42%)
Established Muslims 392,369 (34%) Muslim settlers 64,398 (6%) Muslim Gypsies 25,031 (2%) CHRISTIANS 646,215 (57%)
Bulgarians 592,573 (52%)
Greeks 7,655 (1%)
Armenians 2,128 (0%)
Catholics 3,556 (0%)
other Christians 40,303 (4%)
JEWS 5,375 (0%)
NONMUSLIM Gypsies 7,663 (1%) Population
1,120,000 (48%) 774,000 (33%) 200,000 (8%) 110,000 (5%) 35,000 (1%) 1,233,500 (52%) 1,130,000 (48%) 12,000 (1%) 12,000 (1%) 12,000 (1%) 2,500 (0%) 65,000 (3%)
Gypsies NONMUSLIMS
Bulgarians Gypsies Greeks Jews Armenians Vlachs and others
Male Population of the Danube Vilayet
(including Niş) in 1876 according to Ottomanofficer Saint Clair Total population of the Danube Vilayet (including Niş and Sofia sanjaks) according to the 1876 edition of Encyclopaedia Britannica:
Group Population Group Population
MUSLIMS Bulgarians 1,500,000 (63%)
Turk Muslims 457,018 (36%) Turks 500,000 (21%)
Other Muslims 104,639 (8%) Tatars 100,000 (4%)
Gypsies 8,220 (1%) Circassians 90,000 (4%)
NON‐MUSLIMS Albanians 70,000 (3%)
Armenian Christians 2,128 (0%) Vlachs 40,000 (2%)
Vlach and Greek
56,647 (4%) Gypsies
Christians
25,000 (1%) Bulgarian Christians 639,813 (50%) Russians 10,000 (0%)
Jews 5,847 (0%) Armenians 10,000 (0%)
Jews 10,000 (0%)
Greeks 8,000 (0%)
Serbs
Аркадиев, Димитър: Изменения в броя на населението по българските земи в състава на Османската Империя. National Statistical Institute,
http://spisaniestatistika.nsi.bg/page/bg/details.php?article_id=84&tab=en, 25–27.
5,000 (0%)
on Political DecisionMaking Across the Balkan Peninsula (1840s–1910s) Table 3. Some European data series based on Ottoman sources (in 1000 prs)
Sanjak Jocelyn (M)
(nonM)
Jocelyn Jocelyn Stavrides
(M%) (M)
Stavrides
(BG) (M%)
Stavrides
352 251 58 371 233 60
Rusçuk
Vidin 70 314 18 60 266+31 17
Varna 89 35 71 120 37+15 69
150 231 39 199 301 40
Tırnova Tulça Sofia
109 84 56 92 22+40 60
48 292 14 63 328 16
Total 818 1,207 40 41
92 221 29 51 27
Niş
Eastern Rumelia
905 1,285
137
420 690
1874 (Ottoman)
350 640 35 37
1873 (Ottoman) continues…
Sanjak
Cherkassky(M) Cherkassky(B) Cherkassky(M%) Teplov Teplov Teplov(M%) Muslims, Christians, Muslim
(M) (nonM) 1874/75 1874/75 %
Rusçuk 381 233 61 268 290 48 190 119 61
Vidin 60 246+31 18 40 333 11 30 149 17
Varna 120 43+9 70 64 45 59 60 26 70
190 300 38 68 328 17 95 150 39
Tırnova
Tulça 112 26+39 63 103 116 47 56 31 64
Sofia 60 362 14 58 429 12 30 183 14
Total 923 1,310 41 601 1,541 28 461 658
41
Niş 78 270 22 72 360 17
1874 only males
Data from: Koyuncu, Tuna vilâyeti”nde nüfusvedemografi. Jocelyn’s data are lower, because they refer to the 1873 or pre1873 Ottoman salname, which gave a different number compared to subsequent sources.
Table 4. Differences between Teplov’s two datasets
Muslims NonMuslims Total Muslims in %
1,694 1,976 3,670 46%
English consulates (total population) Teplov, 1876/77 (total population) Teplov II (males, Map)
1,057 2,745 3,802 28%
715 1,175 1,890 38%
Data from: Turan, Ömer: The Turkish Minority in Bulgaria (1878–1908). Ankara: Türk Tarih Kurumu, 1998. Including the Niş sanjak and Eastern Rumelia.
As already stated, Teplov provided two, completely different data series regarding numbers and percentages. The one, giving higher numbers (indicating the total population), did not correspond to the western data series of Jocelyn, Cherkassky and Stavrides and thus to the 1874 Ottoman source. Teplov gives the lowest number and proportion for the Muslims (cca. 30%). Relying on the Exarchate’s statistics he calculated with only 1.05–1.3 million Bulgarians, which means that their proportion remained under 50% and this also implied that there were at least one million non
exarchist Christians in his statistics living in Greater Bulgaria.
The above mentioned dataset of Teplovisnot identical with that he prepared for the conference in Constantinople. For this he provided another data series – and this implicitly means that he considered the latter more reliable or unchallengeable.36 The question is how the two data series related to each other. Accepting Teplov’s first (Exarchist) statistics would imply that Ottomans were able to count Exarchist Bulgarians properly (their data are close to each other both in Ottoman and Exarchist sources), but were incapable of counting hundreds of thousands of other Orthodox people, which is implausible.37
Though the aggregated numbers in his dataset indicating the total population are twice as high as in the other one (1.8 million males vs. 3.8 million inhabitants in Bulgaria, Niš and Eastern Rumelia), a detailed analysis confirms that it is not the result of multiplying the number of males by 2. So, it is evident that the two data series were based on two different sources.
The comparative analysis proves that Teplov in his second data series used the ethnoreligious data of the Ottoman registers from 1873 and 1874. A serious mistake made in his map confirms this. The 1874 salname erroneously registered the Christian population of the Sofia sanjak in the Muslim column (and the Muslims were indicated as Christians), but only here. As it was well known that Sofia had a Christian majority, Teplov tried to figure out new values for the Christians to gain the Christian majority – instead of switching data between the two columns. That is why his map shows only 50–60% of Christians in Sofia, Kjustendil, Dupnitsa and Radomir, etc., and that is why he used here rounded values. But if we take a closer look at the former, 1873 census, we may find that the data recorded in the Muslim column of the 1874 salname are indicated correctly in the Christian column (and the proportion of Christians reaches 80–90%). This mistake also proves that Teplov did not have direct access to the original Ottoman data.
36
37
Teplov’s map indicates only the male population, while the dataset using the Exarchate’s data on the Bulgarian population refers to total numbers and uses ethnic categories (which the map did not), and gives a kazalevel territorial breakdown.
A. Koyuncu, Osmanlı‐Rus Harbi, 197–198. Ethnic data from the conscription of the Exarchate (1876/77). Bilal N. Şimşir, Rumeli’den Türk Göçleri, Vol 3, Türk Tarih Kurumu, Ankara 1989.
and Nikolay Todorov, The Balkan City, 1400–1900, University of Washington Press, Seattle
& London 1983. The published data series in 1874 contain mistakes. Recalculated data in brackets. For explanation, see text.
on Political DecisionMaking Across the Balkan Peninsula (1840s–1910s)
Map 8. Part from Teplov’s choropleth map, with data inscriptions
It is evident that despite these mistakes, this data series of Teplov is more appropriate than his data series which relies on the Exarchate’s data. In the latter dataset, the number and proportion of Muslims was too small compared to all other, either western or Ottoman statistics, while huge masses of nonexarchist Christians were indicatedasunexplained. In other words, when submitting his maptothe conference, Teplov voted for the reliability of Ottoman data. Though the Exarchate’s
data on Bulgarians may be realistic (the number was not higher than given in Ottoman sources: 1.05 million persons vs. 605 thousand males), in other aspects this “mixed”
statistics is not credible.
Conclusions
Our investigations proved that distortions with regard to the number and proportion of Muslims and Christians appearing in Ottoman documents (long debated by the then opposing parties and recent historiography too) were quite similar.
Neither group was over or underemphasized in the first censuses. Ottoman ethnoreligious data shouldbeconsidered reliable at least regarding percentage values (absolute numbers showed great variety even within a small timespan and are considered unreliable) as the comparison of the old Ottoman census and the subsequent modern census carried out in the early 1870s according to the western principles and methods proved it. While the methods of the census did change significantly during the elapsed 40 years, the proportions did not – thus results are independent from the applied method. The ethnoreligious picture obtained from the earliest Ottoman censuses (1830s) is way better than the contemporary first
generation western patch maps, createdby Boué and Šafaryk (1840s). It is also evident that these maps partly served Austrian political interests.38
We also proved that even Ottoman statistics were used in decision‐making, which confirms that these were considered reliable by some of the contemporary political observers, even if they served inimical powers (Russia). Teplov’s case also indicated that Ottoman sources were accessible – though indirectly and with many mistakes – for European scholars unable to read Osmanli, thus the thesis of McCarthy that they usually neglected Ottoman data is not always true. On the other hand, the case of Encyclopaedia Britannica also highlights that sometimes the incorrect data became more widespread because of the greater “authority” of the publisher.
We also proved that there is a possibility to obtain reliable ethnic data from different sources – even originating from opposing parties, by combining these sources and crosschecking their reliability.As
one would expect higher numbers for Exarchists in an Exarchist census than in Ottoman (supposing tendentiousness and partiality from both parties), the similarity of numbers in these documents implies that the Exarchate’s data on the number of Bulgarians can be used for statistical calculations (contrary to the Patriarchate’s data). That way at least the proportion of Muslims and Exarchists can be verified for each district (however, this method does still not enable us to handle other ethnic or religious categories).
38Boué’s explorations were financed by the Austrians. See: Hugo Hassinger, Österreichs Anteil an der Erforschung der Erde. Ein Beitrag zur Kulturgeschichte Österreichs, Wien 1949, Adolf Holzhausen, 131. Boué’s and Šafaryk’s proSlavic map of the Balkans fitted into the scheme of propagating AustroYugoslavism (Kopitar).
on Political DecisionMaking Across the Balkan Peninsula (1840s–1910s) We also proved that the patchtechnique in the 19th century was intentionally chosen as a method of illustration (the piechart technique was also known!), but was not the best method to illustrate ethnic proportions and numbers. Therefore early ethnic maps were more likely to serve political goals and were less of scientific character. Ethnic maps based on language flattened identity and the picture they suggested remarkably differed from ethnic maps based on other features of identity.39
39This study was supported by the NKFIFK 128 978 project.
7
Gábor Demeter, Zsolt Bottlik, Krisztián CsaplárDegovics IL RUOLO DELLA MAPPATURA ETNICA NELLA FORMAZIONE NAZIONALE E LA SUA INFLUENZA SUL PROCESSO DECISIONALE POLITICO IN TUTTA LA
PENISOLA BALCANICA (DAL QUARTO DECENNIO DEL XIX SECOLO AL PRIMO DECENNIO DEL XX SECOLO)
Riassunto
Oltre a sottolineare il ruolo e la funzione delle mappe etniche della penisola balcanica nel XIX secolo, nel contesto di una nuova ideologia nazionalista, (1) questo documento richiama l’attenzione su alcune interpretazioni errate o abusi intenzionali dei cartografi, (2) sia confrontando gli insiemi dei dati autentici con le tabelle ufficialmente pubblicate e reinterpretate, conservate presso l’Archivio di Stato austriaco (HHStA) (2a), che confrontando pratiche cartografiche e metodi di visualizzazione occidentali, orientali e balcanici (2b). Tutto ciò può portare a interpretazioni differenti (per non parlare delle diverse interpretazioni dei termini che denotano la stessa nazione), il che ha reso le mappe etniche un mezzo appropriato di propagazione dell’idea nazionale. Invece di essere un metodo scientifico (mappatura tematica), la cartografia è diventata uno strumento politico per creare la nazione (invece di descriverla). Nei nostri casi di studio, esaminiamo (a) se le prime generazioni di mappe etniche classiche rappresentavano meglio la situazione nei Balcani, o se lo facevano meglio quelle moderne e reinterpretate che visualizzavano la diversità etnica con diagrammi a torta; (b) se i dati ottomani sono completamente inaffidabili o possono servire come base per la mappatura etnica; (c) se i dati ottomani esaminati, che abbiamo analizzato, degli anni ‘30 e ‘70 del XIX secolo fossero o meno disponibili ai cartografi occidentali e come siano stati distorti; e (d) se c’erano delle mappe fatte sulla base di dati ottomani pervenuti a quelli che prendevano decisioni, e come ciò era correlato alla produzione di altre mappe occidentali. Confrontiamo anche le caratteristiche della cartografia etnica nazionalista e imperialista, gli approcci basati sulla lingua e sulla religione e le differenze tra questi approcci. Infine offriamo, pur essendo limitato, un metodo di controllo incrociato sull’affidabilità di fonti delle parti opposte (usando l’esempio dei dati ottomani e quelli degli esarcati).
Parole chiave: tecniche di mappatura etnica, Balcani, Ottomani, Esarcato, Kiepert, Teplov, Bouè